School of Medicine
66 Characterization of Satellite-Derived Air Pollutant Measurements for T2DM Incidence Correlation Studies
Adriana Payan-Medina; Ramkiran Gouripeddi (School of Medicine, Department of Biomedical Informatics, Center for Clinical and Translational Science, and Center of Excellence in Exposure Health Informatics); Naomi Riches (Biomedical Informatics and Center of Excellence in Exposure Health Informatics); and Julio Facelli (Biomedical Informatics, University of Utah)
Faculty Mentor: Ramkiran Gouripeddi (Biomedical Informatics, University of Utah)
Introduction: Physiologically detrimental chemicals from motor vehicles, fossil fuels, and industrial emissions can have devastating impacts on global health. Chemical pollution and particulates can be inhaled deep into the lungs and enter circulation within the bloodstream, contributing to tissue damage, increased cardiovascular or respiratory health risks, and inflammatory or metabolic insults [1]. Preliminary studies have shown that criteria pollutants (CO, NO2, O3, PM2.5, SO2) stimulate these conditions, potentially promoting an increase in type 2 diabetes mellitus (T2DM) incidence in locations with adverse air quality (AQ) [2], inducing lifelong morbidity and encumbering the health care system. Forthcoming economic development and urbanization cause projected increases in air pollution and an increased burden of T2DM incidence [1], demonstrating the need for widespread and accurate pollutant measurements. Several studies have utilized ground monitored AQ measurements to investigate the correlation between T2DM prevalence and exposure levels, finding statistically significant, positive relationships [1,2]. Unfortunately, not all AQ and T2DM relationship factors are reported consistently: such studies still hold considerable ambiguity concerning the validity of the ground-monitor obtained AQ measurements. A critical issue not successfully addressed is the reliability of a ground based AQ monitor on those living outside its range. Ground-based monitors are generally located in population-dense areas, leaving 79 million Americans in unmonitored or monitor sparse locations [3]. In contrast, satellite data from the National Aeronautics and Space Administration (NASA) gives access to spatiotemporal air pollution data through global exposure coverage of criteria pollutant concentrations through geographic coordinate specific values.
Methods: To expand the spatial and temporal availability of air quality data, a data retrieval infrastructure that generated practical, spatially, and temporally widespread chemical pollutant files for the criteria pollutants separated by year and location was developed. This infrastructure was designed through NASA’s Modern-Era Retrospective analysis for Research and Applications, Version 2 (MERRA-2) and Ozone Monitoring Instrument (OMI) pollutant concentration measurements [4], available through geographic-coordinate gridded daily files. After these daily files were retrieved for each of the criteria pollutants, they were filtered for missing days and quality flags that may arise in heavy cloud or snow conditions. The gridded data was matched to the zip code and census tract level using reverse geocoding with parallelized K-D tree implementation. This NASA satellite data retrieval infrastructure transformed 30 thousand daily chemical pollution files into a data resource with 15 years of criteria pollutant concentration data, organized by year and location with indicators on data missingness and quality.
Figure 1. (a) Utah County Environmental Protection Agency, (b) Utah County MERRA-2 Satellite, (c) Carbon County MERRA-2 Satellite 2019 PM2.5 Data Trends.
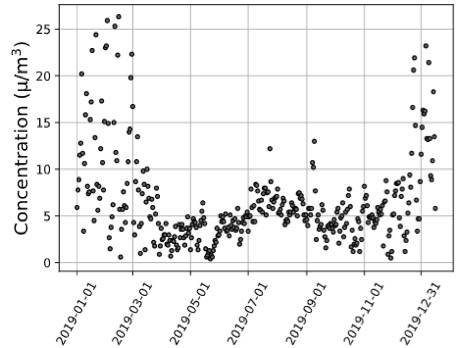
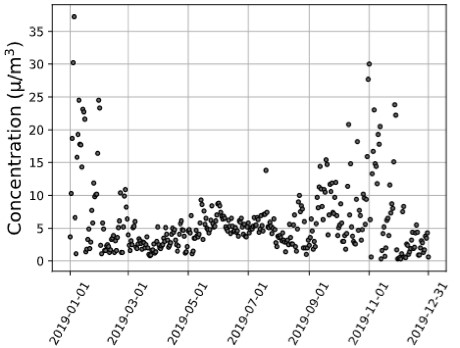
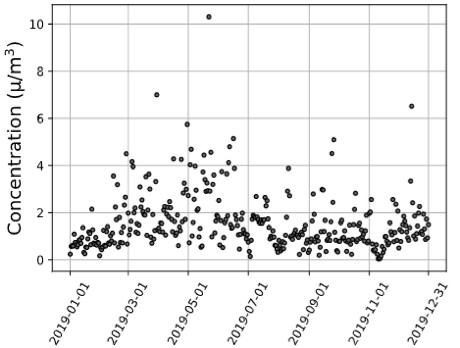
Discussion: With the results of this analysis, satellite data could be used to track pollutant profiles, provide support for AQ forecasting, and provide input to AQ models and data for model evaluation. For example, the closest ground-based monitor air quality monitor to Carbon County, Utah, is 145 kilometers away, located in Utah County. As demonstrated in Figure 1, although the Utah County satellite and Utah County Environmental Protection Agency (EPA) monitor measurements model one another, there are significant differences between the EPA and satellite Utah County measurements and the satellite Carbon County measurements. This variation between satellite instrument AQ measurements and EPA monitor measurements quantified through a correlation quantification exemplifies a county where satellite AQ data could provide more precise criteria pollutant concentrations. This illustrates how satellite data have considerable applications in locations lacking AQ monitors or complement data from sites with existing ground monitors. Our study will provide insight into future satellite-health applications, emphasizing satellite data with ground monitors to advance knowledge on chemical pollutants’ contribution to cardiometabolic disease morbidity. Correspondingly, suitable public health legislative policy regarding AQ could be created abreast of reliable, widespread pollutant exposure levels.
References: [1] Yang A. et al. Environmental International (2021). [2] Riches N. et al. Environmental Research. (2022). [3] US Environmental Protection Agency. Pre-generated data files. Accessed July 13, 2020. https://aqs.epa.gov/aqsweb/airdata/download_files.html. [4] NASA MERRA-2 and OMI. Daily data files. Accessed June 10, 2020. https://disc.gsfc.nasa.gov/datasets.
Acknowledgments: This work was supported by the National Library of Medicine (T15LM5920634), the Undergraduate Research Opportunities Program, the National COVID Cohort Collaborative (N3C) Supplement (3UL1TR002538- 03S3), National Institute of Diabetes and Digestive and Kidney Diseases Ruth L. Kirschstein National Research Service Award of the National Institutes of Health under award number [5T32DK110966-04] and the National Center for Advancing Translational Sciences (UL1TR002538). The Center of Excellence for Exposure Health Informatics was established from efforts of the Utah PRISMS Informatics Center (NIH/NIBIB U54EB021973). Computational resources were provided by the University of Utah Center for High Performance Computing, partially funded by the NIH Shared Instrumentation Grant (1S10OD021644-01A1).
