Mines & Earth Sciences
80 Assessing Yellowstone Seismic Velocity Structure Using a Dense Seismic Array
Chloe Barry; Jamie Farrell (Geology and Geophysics); and Fan-Chi Lin (Geology and Geophysics)
Faculty Mentor: Fan-Chi Lin and Jamie Farrell (Geology & Geophysics, University of Utah)
The Yellowstone magmatic system represents one of the largest continental silicic volcanic centers, notable for three explosive eruptions occurring in the last 2.1 million years [1,2]. The volcanic system is marked by frequent earthquakes, episodic ground deformation, high heat flux, and hydrothermal features [1,2]. The system is underlain by two magma reservoirs that are largely constructed of stacked sill complexes [2] and is fed by a west-northwest dipping plume in the upper mantle. The plume generates basaltic partial melts which collect in the lower sill complex located in the lower crust. These partial melts then further fractionate, and the lessdense silicic melt rises to the upper rhyolitic sill complex located in the upper crust [2]. These two sill complexes are likely connected by dikes and have been imaged through seismic tomography, however the resolution of the models is often limited by the earthquake-station ray path distribution. In order to improve these models, it is necessary to improve the ray path coverage and identify areas of the models that do not agree with the new observations.
To achieve this, a temporary dense array of 608 Zland 3-component geophones were deployed along the main roads of Yellowstone National Park from 08/18/2020 through 09/21/2020 (Figure 1).
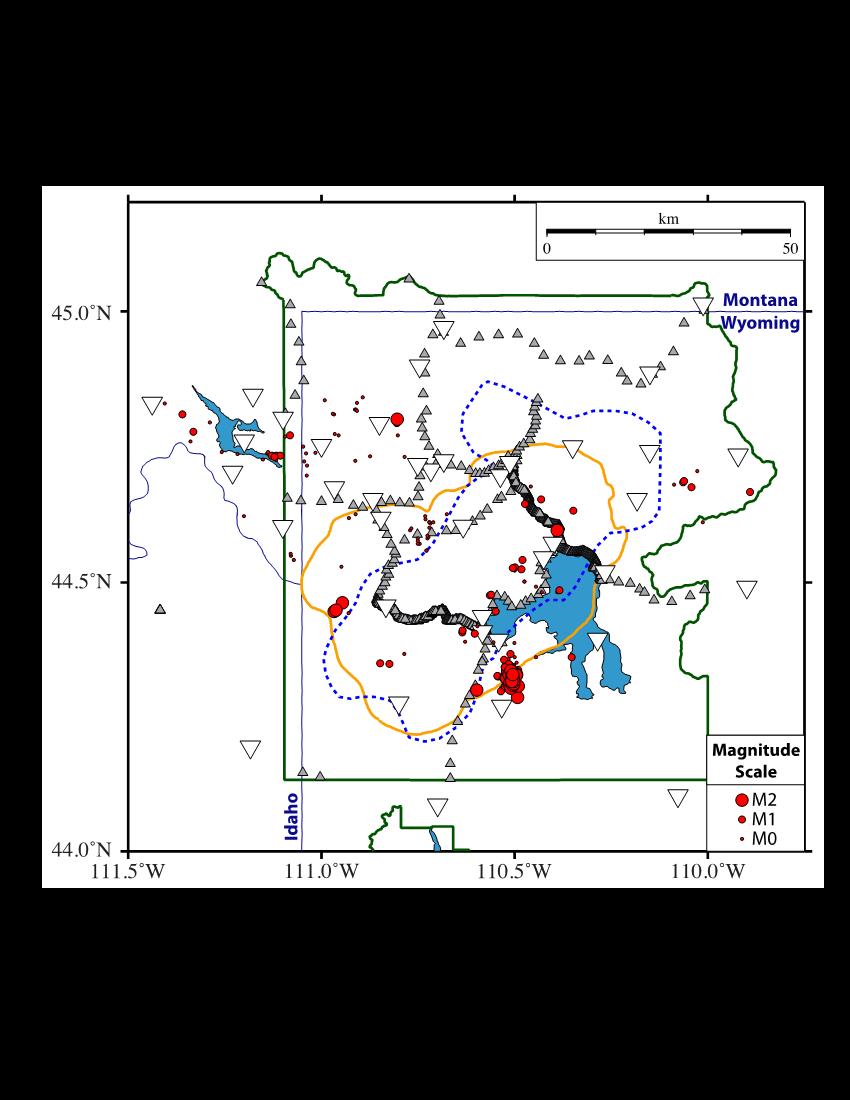
Figure 1: A map of Yellowstone showing nodal stations labeled as grey triangles and permanent stations as white inverted triangles. The orange line outlines the 0.63 Ma Yellowstone caldera, and the blue dashed line represents the spatial extent of the upper-crustal magma reservoir. Red circles represent earthquakes that occurred during the nodal deployment and are sized based on magnitude.
This is the first dense array of its kind to be deployed in Yellowstone. In this study, we measured body wave arrivals, or P-wave and S-wave arrivals, from local earthquakes across the dense array to better understand the subsurface magmatic structure of Yellowstone. The measured travel times are compared with predictions based on a 1D reference velocity model. The observed travel time discrepancies are then used to assess areas where the model needs to be adjusted (Figure 2).
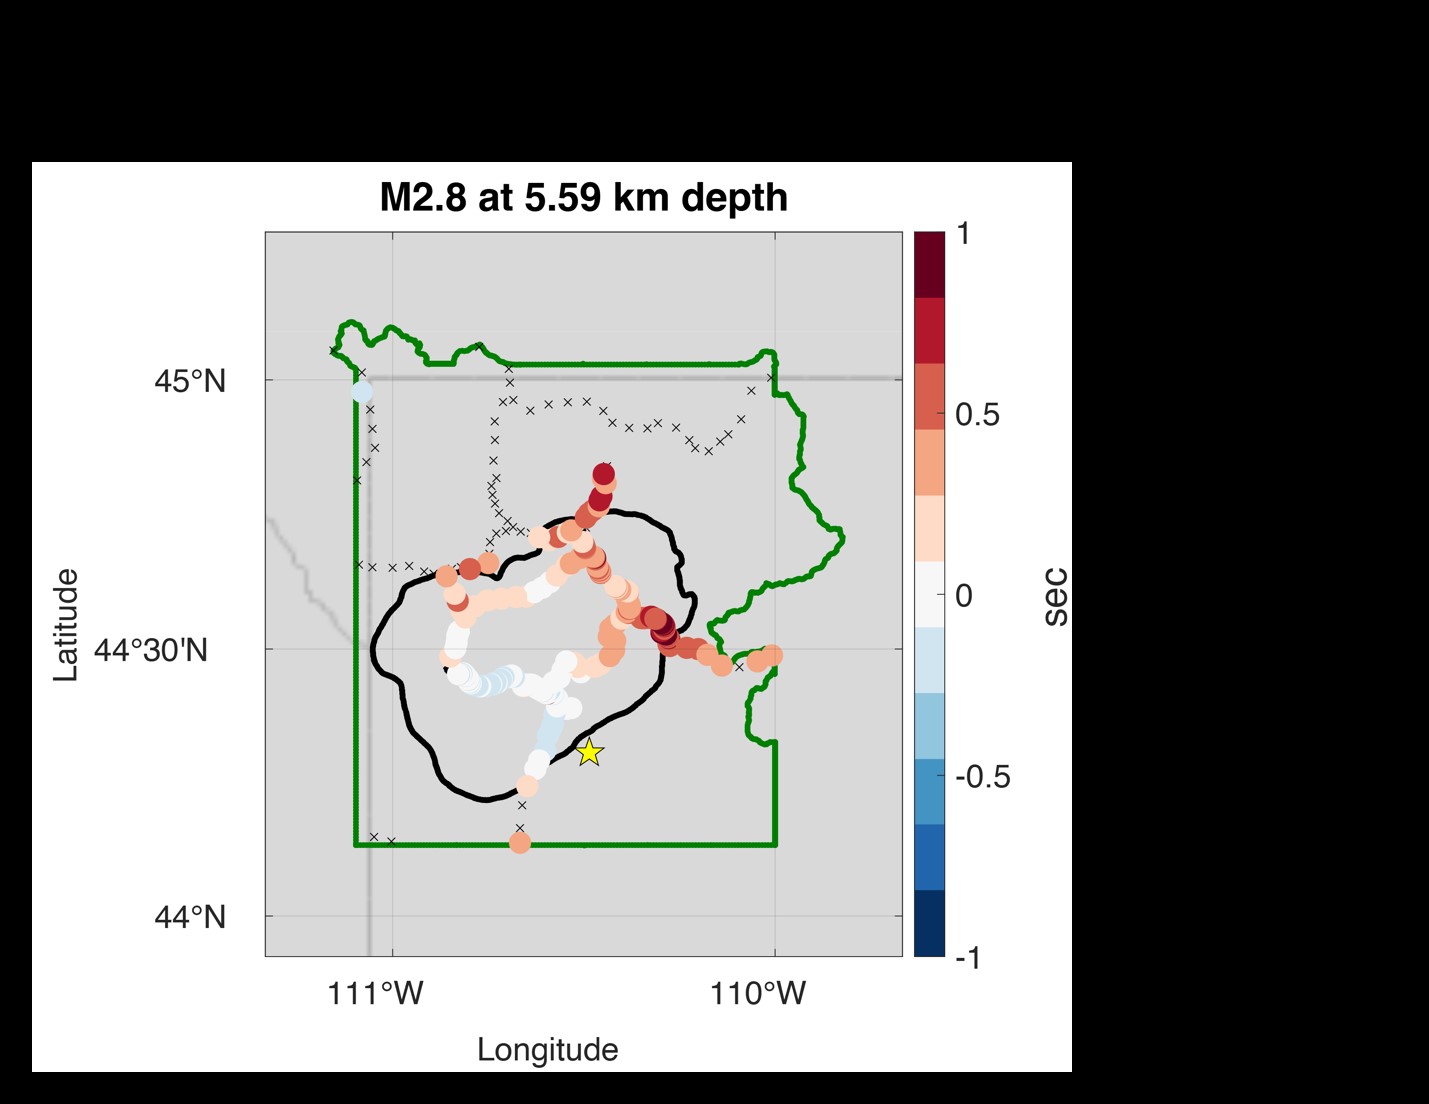
Figure 2: A map of the nodal stations color coded based on the P-wave misfit in seconds for the M 2.8 earthquake. The black line is the 0.63 Ma Yellowstone caldera. Red color coding is for positive misfit where the dense array data velocities are slower than the model, and blue color coding is for negative misfit where the dense array data velocities are faster than the model. The yellow star represents the earthquake location, and the green line represents the boarder of Yellowstone National Park. The black crosses represent stations where no travel time picks were made.
We will use body wave ray tracing to determine the 3D sensitivity of our measurements and to understand how the Yellowstone magma body, which has low velocity, contributes to our observation. This process of modeling and comparing will help us to evaluate the most recent 3D velocity model of Yellowstone [2] and provide insight for a future tomographic inversion.
[1] Farrell, J., R. B. Smith, S. Husen, and T. Diehl (2014), Tomography from 26 years of seismicity revealing that the spatial extent of the Yellowstone crustal magma reservoir extends well beyond the Yellowstone caldera, Geophys. Res. Lett., 41, doi: 10.1002/2014GL059588
[2] Huang, H.H., F.-C. Lin, B. Schmandt, J. Farrell, R.B. Smith, and V.C. Tsai (2015), The Yellowstone magmatic system from the mantle plume to the upper crust, Science, 348, doi: 10.1126/science.aaa5648
