Social and Behavioral Science
120 Investigating the Perseverance and Bias Blind Spot Relationship
Jordan Davidson and Frank Drews (Psychology)
Faculty Mentor: Frank Drews (Psychology, University of Utah)
However, while cognitive biases are easy to intuit and detect in the motivations of the people around us, the same evidence of bias is no longer obviously apparent when one reflects on their own judgment and decision making. Engaging in meta-cognitive considerations, people tend to believe that their own perspective is uniquely objective and that those who disagree with their assertions are unilaterally biased, exhibiting a sort of “naïve realism” (Robinson et al., 1995).
This asymmetrical ability to perceive cognitive bias in the self versus others is known as the bias blind spot, and appears to be present in the majority of people (Pronin et al., 2002; 2004).
While the bias blind spot is pervasive, there are individual differences to what extent a person displays bias blind spot, i.e., some individuals with a bias blind spot believe more strongly that they are less biased than others while some believe they are only a little less biased than average (Scopelliti et al., 2015). While these individual differences are apparent throughout much of the research on bias blind spot, there is a perplexing lack of correlations between bias blind spot and various measures of cognitive sophistication (i.e., thinking dispositions and cognitive abilities) (West et al., 2012), personality, and self-evaluative measures (Scopelliti et al., 2015). Possibly motivated by the lack of correlational findings, research has focused more on the cognitive processes underlying bias blind spot.
The cognitive mechanisms that guide bias blind spot are not thought to be unidimensional. Instead, several contributors to its existence are discussed in the literature. Primarily, bias blind spot is believed to come from the “introspection illusion,” or a tendency to believe our own intuitions reveal objective insight for ourselves while others’ intuitions are riddled with bias (Pronin & Kugler, 2007). This belief leads to the aforementioned naïve realism bias, another potential process behind bias blind spot. Similarly, research has also shown that people tend to overemphasize their own intentions when self-evaluating while simultaneously ignoring the intentions of others when evaluating them (Kruger & Gilovich, 2004). While naïve realism and the introspection illusion are largely considered to be the main motivator behind bias blind spot, there is still the possibility that this metabias could also be—at least partially— explained in self-enhancing motivational terms (Pronin et al., 2002; West et al., 2012).
There are a number of ways that people exhibit other “positive illusions,” or unrealistically optimistic views of the self (Taylor & Brown, 1988). However, these illusions are not always detrimental, and have been argued by Taylor & Brown to foster positive mental health outcomes. Additionally, positive illusions may be associated with increased ambition and perseverance (Johnson et al., 2013). As bias blind spot could be considered as a type of positive illusion, it stands to reason that it may be associated with an increased ability to persevere.
In research conducted by Styk and Klinkosz (2020), perseverance is believed to be a product of individual dispositions and situational factors. Furthermore, there are individual differences in
levels of perseverance. While the operational definition of perseverance is not as well-defined as bias blind spot within current literature, Styk and Klinkosz described perseverance as an ability to pursue a goal by overcoming a desire to give up even in the presence of distractions. This definition of perseverance was adopted for the current study.
In the present research, we explore perseverance as a potential motivator for the bias blind spot. While previous research has largely investigated the consequences (Scopelliti et al., 2015) and cognitive mechanisms (Mandel et al., 2022; Pronin et al., 2007; West et al., 2015) behind bias blind spot, research into its potential advantages has been less investigated.
METHOD
MaterialsBias Blind Spot. The bias blind spot scale developed by Scopelliti et al. (2015) was used verbatim for the study to assess the magnitude of bias blind spot in participants. The scale comprised 14 different common cognitive biases. A brief description of each bias was given, followed by two questions pertaining to the bias in question. The first question asked, “to what extent are you likely to show this tendency?” on a 7-point Likert scale (1 = not at all likely, 7 = very highly likely), followed immediately by a similar question asking, “to what extent do you believe the average University of Utah student is likely to show this tendency?” on the same 7- point Likert scale.
For each of the 14 cognitive biases, the rating given to the self was subtracted from the rating given to the average University of Utah student to create a “bias score” for each participant. A positive bias score was indicative of bias blind spot for that bias. For example, if a participant had a bias score of 1 for the action/inaction bias, this meant they rated other students as being 1 point more susceptible than themselves to committing action/inaction bias. A “bias blind spot score” then aggregated each bias score for the participant. This worked much the same way as the individual biases: if a participant had a bias blind spot score of 1, that meant that— across all 14 biases described—they believed other students to be 1 point more susceptible on average to cognitive bias.
Perseverance. In order to examine perseverance, participants were asked to complete randomly generated mazes on a computer (see Figure 1).
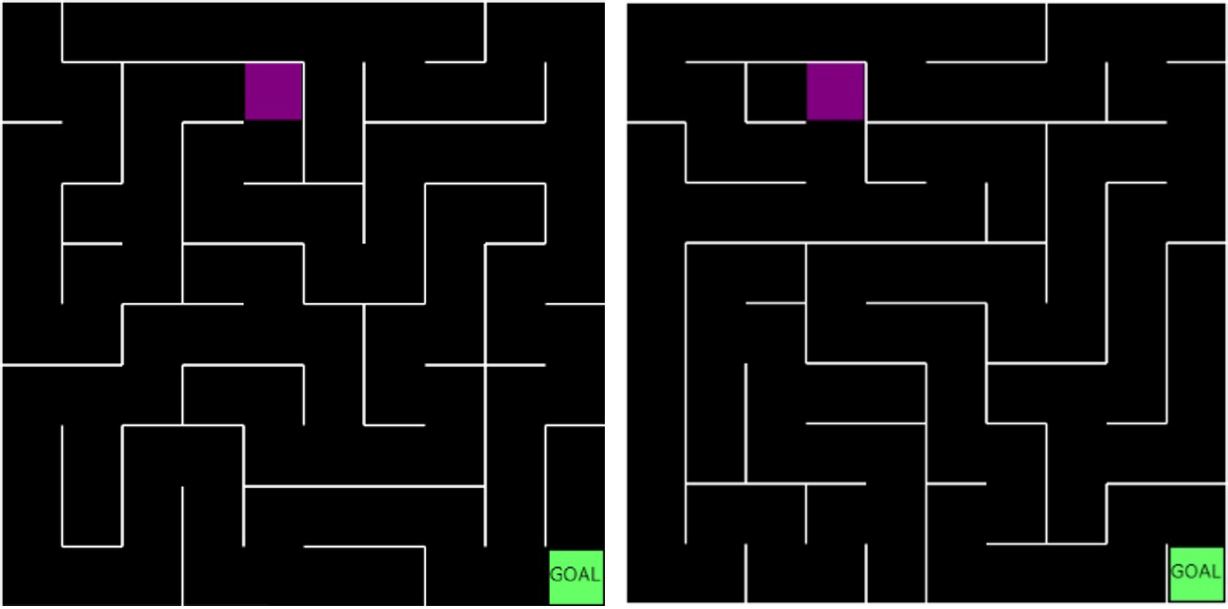
Figure 1. Examples of an easy (left) or difficult (right) maze.
Half of the participants were given “easy” mazes while half were given “difficult” mazes. Easy mazes had one direct route to the goal while difficult mazes generated multiple pathways and dead ends. The different level of mazes were created to see if there was a difference in performance for a sustained monotonous endeavor through the easy mazes—more in line with how Styk and Klinkosz measured perseverance (2020)—and sustained cognitive involvement as a form of perseverance in the form of the difficult mazes.
The maze task was adapted from Styk & Klinkosz (2020) where mazes were used to measure perseverance. However, unlike Styk and Klinkosz’s study that used a publicly accessible website, a private website was created for the sole purpose of the study. The mazes were written in JavaScript for easier web integration, and featured keyboard movement instead of the mouse movement that Styk and Klinkosz’s mazes utilized. Three main data points were also recorded for each participant to measure their individual levels of perseverance: (1) the number of mazes completed before ending the study, (2) the total amount of time spent on the maze portion of the study, and (3) time on task, i.e., how much of their total time was spent actively solving mazes (after accounting for load time of each maze and delays in moving through the maze).
Procedure
Research assistants (RAs) were trained to avoid using the word “bias” with participants at all stages of the experiment until debrief. Previous research has shown that using the negatively connotated word “bias” can incidentally bias participants into answering questions in a way that makes them appear more objective (Pronin et al., 2002; Scopelliti et al., 2015). A more neutral term, “cognitive tendency,” was used instead in both verbal and written instructions. Participants were randomly assigned to easy or difficult mazes before they arrived.
After consent was obtained, participants were instructed to complete a survey on Qualtrics in a separate, private room. The survey contained the 14-point bias blind spot scale and demographic questions. A randomly generated ID number was created by Qualtrics at the end of the survey. This anonymized number identifying participant information was combined with the maze data while simultaneously allowing survey and maze data to be linked together for data analysis. The participants were instructed to alert the RA after completion of the survey to move on to the second part of the study. The RA would then fill out a form that generated easy or difficult mazes depending on the participant’s predetermined assignment. RAs would deliver verbal instructions from a script to standardize how participants were instructed to complete the maze portion of the task. Because we were concerned with how perseverant the participants were, instructions were intentionally vague when asking the participants to complete mazes. Participants were asked to complete as many mazes “as they were able to do.” This gave them the opportunity to end the task based on their own assessment of when they felt unable to continue, thus measuring their perseverance limit for the maze task. Once they had completed as many mazes as they were able to do, they were instructed to click a Quit button that was able to be clicked at any time while doing mazes. Finally, the participants answered two questions related to difficulty and two questions related to the enjoyability of the mazes. Participants were then debriefed and given the opportunity to ask questions. Course credit was given for their participation.
RESULTSAs expected, the bias blind spot was successfully replicated: participants rated themselves as less susceptible (M=3.72) than other University of Utah students (M=4.64) to the biases, t(100)=13.154, p<.001. Asymmetrical ratings between self and other were noticeable and statistically significant for almost all of the 14 individual biases (all ps<.001), with a notable exception for the ostrich effect, which did not reach statistical significance between ratings of self and other (p=.134). Since the ostrich effect was not significant, we eliminated this bias from our calculation of bias blind spot and data analysis.
There was also one apparent difference between measures of performance on easy versus difficult mazes. Participants completed more easy mazes (M=92.67) than participants who completed difficult mazes (M=65.76), t(100)=2.908, p=.004. However, there were no statistically significant differences in total time spent on mazes between the two difficulties (p=.882), nor was there a significant difference between the two difficulties of mazes in time on task (p=.086).
An ANCOVA was conducted to determine significant differences between maze difficulty level on number of mazes completed, total time spent on the maze task, and time on task while controlling for bias blind spot. The effect of maze difficulty on the number of mazes completed by each participant (F(1,100)=4.961, p=.028), total time spent on the mazes (F(1,100)=5.154, p=.025), and time on task (F(1,100)=4.994, p=.028) were all significant. This revealed that bias blind spot and maze difficulty were significant predictors of all three measures of perseverance.
Further analysis showed that bias blind spot score was only significantly correlated with measures of perseverance on the difficult mazes. Bias blind spot score and number of mazes completed were found to be moderately and positively correlated on difficult mazes, r(100)=.387, p=.005, while showing a nonsignificant weak, negative correlation on easier mazes, r(100)=-.096, p=.505. A similar effect was discovered when examining time on task. On difficult mazes, a positive moderate correlation was found to be significant between bias blind spot score and time on task, r(100)=.433, p=.002, while remaining nonsignificant for easier mazes, r(100)=-.005, p=.997. Bias blind spot was also moderately and positively correlated with total time spent on difficult mazes, r(100)=.41, p=.003 and not significantly correlated on easier mazes, r(100)=.005, p=.974 (see Figure 2).
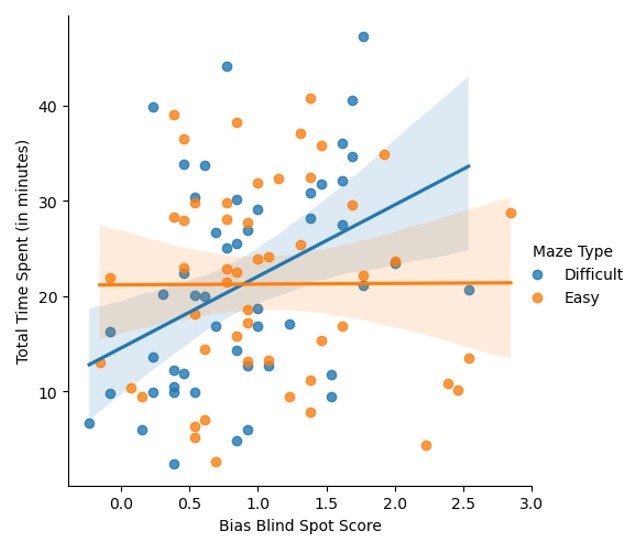
Figure 2. Scatterplot showing the relationship between bias blind spot score and total time spent on the maze task for each participant, split by maze difficulty. The other two measures of perseverance—time on task and number of mazes completed—had a similar relationship to bias blind spot score.
DISCUSSION
Since ANCOVA results were significant for all three measures of perseverance when controlling for bias blind spot, it can be inferred that individual differences in bias blind spot affect performance and behavior on tasks requiring perseverance. Participants who displayed a higher bias blind spot score—and therefore, a more positive view of the self in terms of rational decision making—tended to persevere on more difficult tasks. This finding could lend insight into why the bias blind spot may, in turn, be a persistent feature of human cognition: a more positive view of one’s rational decision making could motivate one to persevere. While the bias blind spot certainly has negative consequences (Scopelliti et al., 2015), there could be more personally beneficial motivators for its existence.
It is notable that the relationship between bias blind spot and measures of perseverance were only significant for the more difficult mazes, and not significant whatsoever for easier mazes. In effect, the easier mazes served as a control group for this study. It was only when participants needed to persevere on more cognitively involved tasks that bias blind spot contributed to a participants’ level of perseverance, while perseverant behavior on more mindless tasks is unaffected by a person’s magnitude of bias blind spot. It can be deduced that bias blind spot may benefit an individual’s perseverance only when they must persevere on difficult or challenging tasks.
Data collection for a second study is currently ongoing, in which participants are shown feedback on performance. Data from this study will be shown to the participant, namely how many mazes the average participant completed. A counter is displayed to the side of the maze that shows in real time how many mazes the participant has completed and also a true average number of mazes other students have completed, based on the current study. This second study is designed to see how much a direct self/other comparison will affect perseverant behavior in participants depending on their magnitude of bias blind spot. If measures of perseverance are affected differently by this feedback, it could indicate that perseverant behavior in those with a higher bias blind spot is grounded in a need to be better than others, rather than a need to look at oneself positively. This would indicate whether bias blind spot manifests more from an inward introspection of the self or a more outward need to be unique or better-than-average compared to peers.
Kahneman, D., Slovic, P., & Tversky, A. (Eds.). (1982). Judgment under uncertainty: Heuristics and biases. Cambridge University Press.
Kruger, J., & Gilovich, T. (2004). Actions, intentions, and self-assessment: The road to self- enhancement is paved with good intentions. Personality and Psychology Bulletin, 30(3), 328-339. https://doi.org/10.1177/0146167203259932
Mandel, D. R., Collins, R. N., Walker, A. C., Fugelsang, J. A., & Risko, E. F. (2022).
Hypothesized drivers of the bias blind spot—cognitive sophistication, introspection bias, and conversational processes. Judgment and Decision Making, 17(6), 1392-1421. https://doi.org/10.1017/S1930297500009475
Nisbett, R. E. & Ross, L. (1980). Human Inference: Strategies and Shortcomings of Social Judgment. Englewood Cliffs, NJ, USA: Prentice-Hall.
Pronin, E., Lin, D. Y., & Ross, L. (2002). The bias blind spot: Perceptions of bias in self versus others. Personality and Social Psychology Bulletin, 28(3), 369-381. https://doi.org/10.1177/0146167202286008
Pronin, E., Gilovich, T., & Ross, L. (2004). Objectivity in the Eye of the Beholder: Divergent Perceptions of Bias in Self Versus Others. Psychological Review, 111(3), 781-799. https://doi.org/10.1037/0033-295X.111.3.781
Pronin, E. & Kugler, M. (2007). Valuing thoughts, ignoring behavior: The introspection illusion as a source of the bias blind spot. Journal of Experimental Social Psychology, 43(2007), 565-578. https://doi.org/10.1016/j.jesp.2006.05.011
Robinson, R. J., Keltner, D., Ward, A., & Ross, L. (1995). Actual versus assumed differences in construal: “Naive realism” in intergroup perception and conflict. Journal of Personality and Social Psychology, 68(3), 404-417. https://doi.org/10.1037/0022-3514.68.3.404
Scopelliti, I., Morewedge, C. K., McCormick, E., Min, H. L., Lebrecht, S., & Kassam, K. S. (2015). Bias blind spot: Structure, measurement, and consequences. Management Science, 61(10), 2468-2486. https://doi.org/10.1287/mnsc.2014.2096
Styk, W., & Klinkosz, W. (2020). The maze test: A computer tool for testing perseverance.
Psychology Research and Behavior Management, 2020(13), 1277-1288. https://doi.org/10.2147/PRBM.S271558
Taylor, S. E. & Brown, J. D. (1988). Illusion and well-being: A social psychological perspective on mental health. Psychological Bulletin, 103(2), 193-210. https://doi.org/10.1037/0033- 2909.103.2.193
West, R. F., Meserve, R. J., & Stanovich, K. E. (2012). Cognitive sophistication does not attenuate the bias blind spot. Journal of Personality and Social Psychology, 103(3), 506-
