College of Engineering
22 Investigation of Contaminants In Stormwater Entering Red Butte Creek from University of Utah
Wona Kim and Jennifer Weidhaas (Civil and Environmental Engineering)
Faculty Mentor: Jennifer Weidhaas (Civil & Environmental Engineering, University of Utah)
If people gather to create an environment for humans in a place where there are only trees, rivers, and animals, the population density will increase, thus increasing the possibility of contamination of nearby rivers and streams [1]. The location of my research, Red Butte Creek, is located in Salt Lake City, Utah. Red Butte Creek is a river flowing in a natural area with few sources of pollution. The source of pollution can be the rainwater that passed from the University of Utah campus. This water runoff can lead to contamination of the Jordan River and the Great Salt Lake [2]. However, as time passed and human influences began to pollute the water quality. It is necessary to manage and preserve this place through continuous measurement and research of water pollution [3]. Weather data in Salt Lake City shows that from October to March, snowfall ranges from 0.2 inches to 0.6 inches [4]. Water that melts from snow or rain is called stormwater, and it causes problems whenever the stormwater carries pollutants from human activities. For example, the pollutants may happen from parking lots, buildings, fertilizers on lawns, and excess sediment or leaves. The pollutants from these stormwaters are not only harmful to the environment but also to the humans living around them. The project I worked on is a water quality test and results at Red Butte Creek into which polluted stormwater ran.
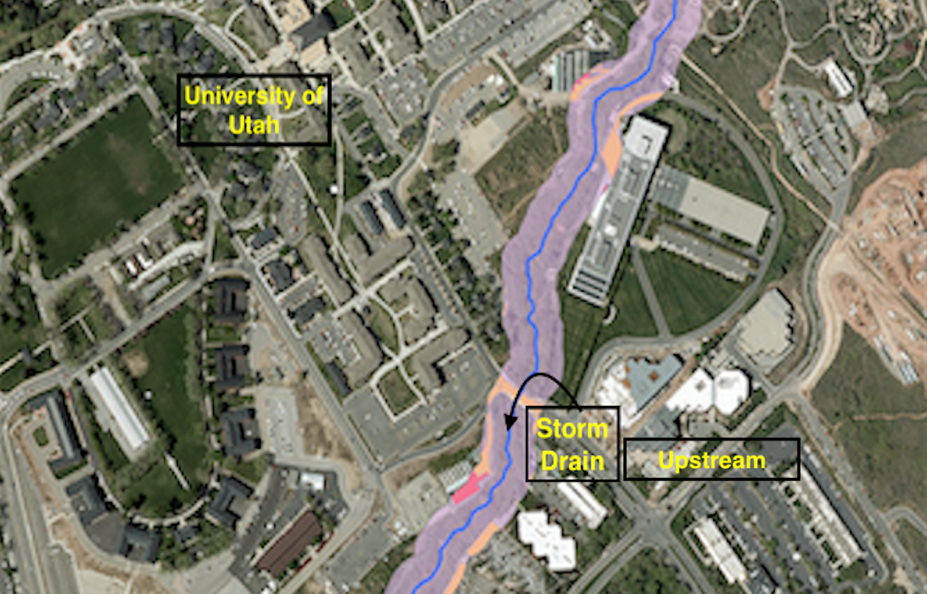
Figure 1: Location of Red Butte Creek Storm Drain
METHODS
Sampling Sites
Two water sample collection sites are shown in figure 1 which are Storm Drain and Upstream. Samples were collected above the stormwater outfall, from within the stormwater outfall, and below the stormwater outfall where the stream water is well mixed with the stormwater. They were collected twice a week for 5 weeks, a total of 9 samples. The sampling sites were in different conditions according to the weather since the research progressed during Summer. If the temperature at the creek was higher than 12°C, it had difficulty getting stormwater because of its dryness. Also, sample collection was varied based on rainfall during this period.
Sample Collection Methods
Water samples were collected at the site mentioned above with autoclaved bottles. Bottles were rinsed 2 times with each site’s water to remove factors that may change the experimental results. Then 2 bottles were filled with 1L of each sample by hand. Temperature, pH, and electrical conductivity were recorded from the site. Samples were collected on May 25th 2022, June 1st, June 8th, June 15th, June 22th, June 29th, July 6th, July 13th, and July 20th. Samples were not collected during periods of the rainy season and heat waves.
Analytical Methods
The methods used for this research were pH, E.coli, Turbidity, and TDS(Total Dissolved Solid). Turbidity and pH were measured again in the lab by each meter as first soon as possible to prevent any changes as time passes. The TDS was measured by gravimetric methods after filtration onto a 0.45 um filter. E. coli was measured by culture-based methods using EPA method 1603. For E.coli experiments, samples were diluted at a 1:1 ratio. Then, isolate heatresistant E.coli from water using pre-prepared m-TEC Agar filtration technology. After the Autoclave procedure, samples are identified using urea substrate to identify bacteria.
RESULTS
Figure 1 indicates the results for each parameter which were measured in this research. As the time approached August, the temperature of the site increased and the amount of water in the creek decreased. Except for the Temperature graph, the blue color indicates the measured value of Stormwater. On July 21st, the Storm Drain was not tested since there was not enough water to run the experiment. pH values of Storm Drain are all low compared to Upstream water. About pH of 6.5-8.5 is appropriate for the creek to maintain its conditions, and most of the pH values are located between the indicated values [5]. According to the graph of turbidity in Figure 1, Upstream has relatively high values than Stormwater. The relationship between turbidity and stream flow can be one of the reasons for this result. Turbidity refers to the degree of turbidity of water containing suspended matter, which can determine the amount of sediment or nutrients and bacteria. Since both E.coli and turbidity parameters measure the matter contained in water, these are proportional Therefore, comparing the two graphs in Figure 1, it has a similar trend line when errors that may occur during the experiment are excluded.
Figure 2. Graphs of Each Parameter
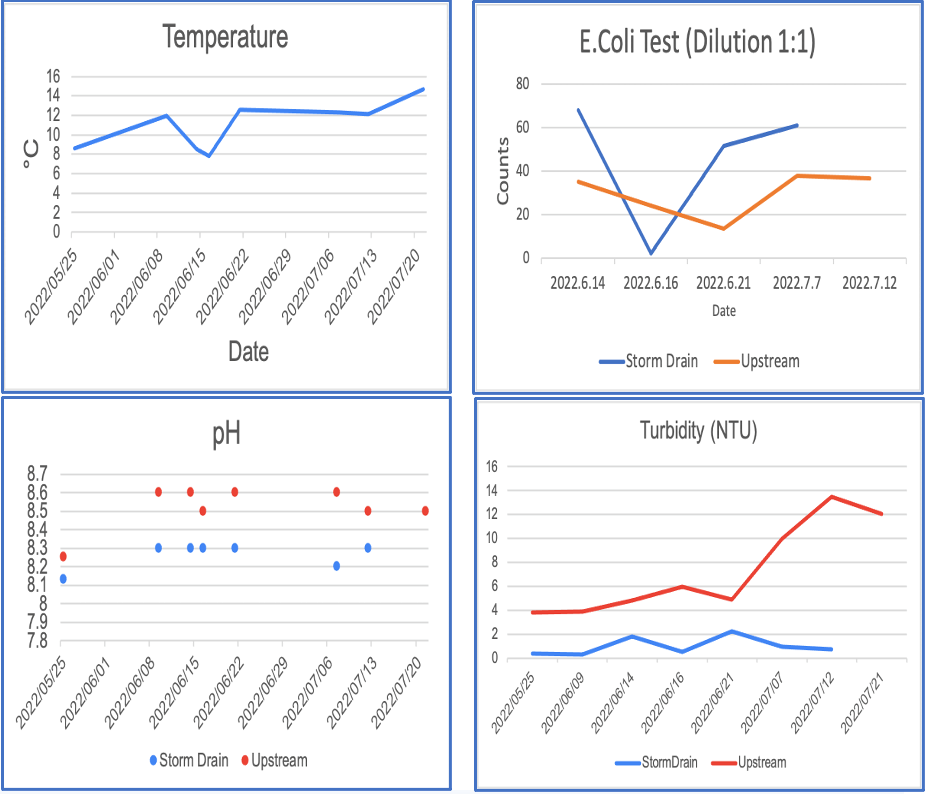
Table 1. Average & Standard Deviation for Each Parameter Parameter
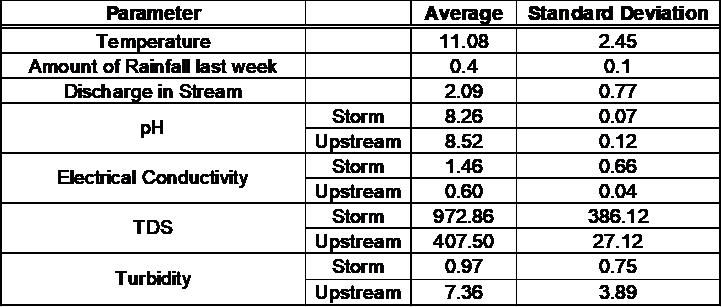
Table 2. t-Test and p Value Between the Upstream and Storm Drain Samples
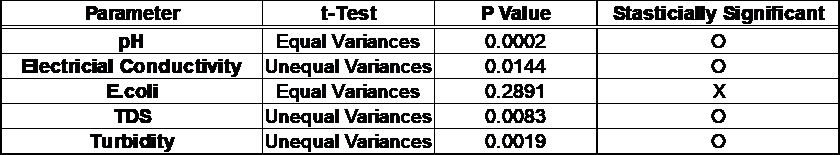
Both of the tables are to compare the values between the Storm Drain and Upstream. The values for Storm Drain with pH and TDS were higher than Upstream, and Electrical Conductivity and Turbidity values were lower than Upstream. A p-value of 0.05 or lower is considered statistically significant. According to Table 2, all parameters were statistically significant except for E.coli which had a higher value than 0.05.
CONCLUSION
The average pH and turbidity values of the Storm Drain are less than the Upstream while average electrical conductivity and TDS values were higher than the Upstream. These data result indicates that the stream is more contaminated after the Storm Drain input. Because the flow rate upstream is higher than in the storm drain, the measured turbidity values are larger. Changes can occur because of various chemicals and pollutants when passing through a pipe.
ACKNOWLEDGEMENTS
This work was supported by funding from the Undergraduate Research Opportunities Program at the University of Utah awarded to Wona Kim. I would like to thank my advisor Dr. Jennifer Weidhaas supporting this research. I would also like to thank Dana Tran, Stephen Cavanaugh, and Makayla Loey for helping me learn methods to complete this project.
REFERENCES
[1] Giddings, E. (2000). Water quality and macroinvertebrate communities of emigration and Red Butte Creeks, Salt Lake County, Utah. Fact Sheet. https://doi.org/10.3133/fs16100
[2] Red Butte Canyon Research Natural Area. (n.d.). Retrieved March 7, 2022, from https://redbuttecanyon.net/
[3] Liyanage, C., & Yamada, K. (2017). Impact of population growth on the water quality of natural water bodies. Sustainability, 9(8), 1405. https://doi.org/10.3390/su9081405
[4] US Department of Commerce, N. O. A. A. (2022, January 24). Climate. Retrieved March 2, 2022, from https://www.weather.gov/wrh/Climate?wfo=slc
[5] Water quality. (n.d.). Retrieved February 6, 2023, from http://www.cotf.edu/ete/modules/waterq3/WQassess3a.html#:~:text=Most%20streams%20have %20a%20neutral,8.6%20may%20be%20too%20basic.
