School of Medicine
38 Examining the Temporal Relationship Between Air Quality Trends and Glycemic Outcomes Among Patients with Type 2 Diabetes Mellitus
Catherine Petersen (University of Utah); Ramkiran Gouripeddi (Biomedical Informatics, University of Utah); Sejal Mistry (University of Utah); and Julio C. Facelli (University of Utah)
Faculty Mentor: Ramkiran Gouripeddi (Biomedical Informatics, University of Utah)
Abstract
Type 2 diabetes mellitus (T2DM) is a chronic condition caused by insulin resistance and metabolic dysfunction. Approximately 37 million individuals in the United States have T2DM.6 Long term exposure to air pollution is thought to increase insulin resistance and impair glucose metabolism due to oxidative stress and inflammation.4 Particulate matter with an aerodynamic diameter ≤ 2.5 μm (PM2.5), more specifically its ultrafine component, can cross the pulmonary alveolar membrane and direct inflammatory effects on target organs.4 While several studies have identified a relationship between PM2.5 concentrations and onset of T2DM1,2,4, few studies have examined the role of air pollution on glycemic outcomes after T2DM diagnosis. There is a possibility of air pollution worsening glycemic control and metabolic dysfunction and contribute to poor glycemic outcomes. Therefore, the objective of this research was to evaluate the relationship between temporal trends in PM2.5 concentrations and glycemic outcomes among patients with T2DM in Davis, Utah, and Salt Lake Counties in Utah. Electronic medical record data from EPIC for 143,434 patients with an eligible ICD-10 diagnosis code for T2DM from 2010-2022 were selected for analysis. PM2.5 concentrations were extracted from the EPA’s Air Quality System in Davis, Utah, and Salt Lake counties in Utah. The date of a patient’s initial diagnosis was found and visually assessed with one-year trends in PM2.5 concentrations. Analysis is ongoing and it is hopeful that the results of this study will elucidate the role of PM2.5 concentrations on glycemic outcomes in patients with T2DM and may inform public health interventions to minimize air pollution and encourage better outcomes for individuals with T2DM.
Introduction
Type 2 diabetes mellitus (T2DM) is a chronic condition caused by insulin resistance and metabolic dysfunction4. Diabetes affects roughly 37 million people, with T2DM accounting for roughly 90-95% of diabetes prevelence6. T2DM is associated with many diabetes-related complications, including heart disease, vision loss, and kidney disease.7
The potential risk factor of interest for this study is exposure to air pollution. As illustrated in Figure 1, the ultrafine component of particulate matter with an aerodynamic diameter ≤ 2.5 μm (PM2.5), can cross the pulmonary alveolar membrane and is thought to increase insulin resistance and impair glucose metabolism due to oxidative stress and inflammation on target organs.3 Although several past studies have identified a relationship between PM2.5 concentrations and onset of T2DM1,2,4, few studies have examined the role of air pollution on glycemic outcomes after T2DM diagnosis. Therefore, the objective of this research was to evaluate the relationship between temporal trends in PM2.5 concentrations and glycemic outcomes among patients with T2DM in Davis, Utah, and Salt Lake Counties in Utah.
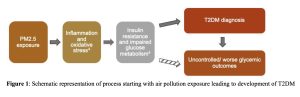
Figure 1: Schematic representation of process starting with air pollution exposure leading to development of T2DM
Methods
In this study, electronic medical records from EPIC at the University of Utah from 2000-2021 were obtained and processed for 143,434 patients with an ICD-9 or ICD-10 diagnosis code for T2DM. Patients with an address in the state of Utah and with a zip code in Salt Lake, Davis, or Utah counties were included. PM2.5 concentrations were obtained from monitors in the EPA Air Quality Systems. The daily average concentration of PM2.5 were obtained under local conditions from 2000-2021 to use as an approximation of air quality levels in Salt Lake, Davis, and Utah counties. The Haversine distance from each included patient to each monitor of interest was calculated using the patient and monitor latitude and longitude. Next, the three nearest monitors for each patient were identified. Patients with an address more than 45 km away from the nearest EPA monitor and patients lacking an eligible ICD-9 or ICD-10 code signifying a T2DM diagnosis were excluded. The date of first diagnosis with an eligible ICD-9 or ICD-10 code for type 2 diabetes was extracted from EPIC electronic medical records and the date one year after diagnosis was obtained. All available PM2.5 average daily concentrations were found at the nearest monitor to a patient for 365 days after they were diagnosed with T2DM. Patients with fewer than 100 PM2.5 measurements in the year following diagnosis were excluded. Missing PM2.5 concentrations were imputed using linear interpolation and PM2.5 concentrations were scaled using a mean variance scalar. After cleaning the subject data to meet determined inclusion/exclusion criteria, as depicted in Figure 2, a total of 33,968 patients were included in the study. From these patients, we extracted the mean age, gender ratio, number with pre-HbA1c and post-HbA1c information available, how many had increased HbA1c after 1 year, how many had decreased HbA1c after 1 year, and how many had no change in HbA1c after 1 year. Along with this, we found how many were prescribed with an anti-diabetic medication after diagnosis, and which type of medication they were prescribed to.
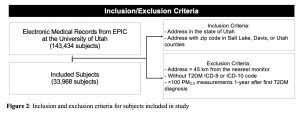
Figure 2: Inclusion and exclusion criteria for subjects included in study
Exposure profiles of daily PM2.5 concentrations 1-year after T2DM diagnosis were identified using shape-based K-means time-series clustering5. K-means clustering is a type of unsupervised machine learning method that identifies subgroups of data. Shape-based time-series clustering methods use cross-correlation to identify clusters in time-series data3. A K-means shape-based time-series clustering algorithm was trained to identify temporal PM2.5 exposure profiles using a maximum iteration of 10, initialization of 1, and clusters of 2-20. Clustering performance was evaluated by calculating the inertia for each cluster and the elbow method was used to identify the optimal cluster number. This work was done using Python 3.9.12. Packages used were pandas 1.4.2, numpy 1.22.3, geopy 2.2.0, and seaborn 0.11.2.
Results
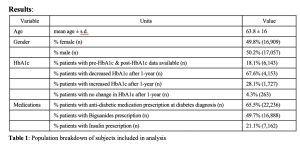
Table 1: Population breakdown of subjects included in analysis
As seen in Table 1, of the 33,968 subjects included in analysis, the mean age was 63.8 years old, with a standard deviation of 16 years. 49.8% (16,909 subjects) of the subjects analyzed were female and 50.2% (17,057 subjects) were male. Of all the subjects included, 18.1% (6,143 subjects) had pre-HbA1c data available for six months before or three months after T2DM diagnosis and post-HbA1c data available for six months after a year post diagnosis. Of the patients with available HbA1c data, 67.6% (4,153 subjects) had a decrease and 28.1% (1,727 subjects) had an increase in HbA1c after one year, while 4.3% (263 subjects) showed no change. Of all subjects included, 65.5% (22,236 subjects) were prescribed with an anti-diabetic medication at the time of diagnosis. Of all subjects included, 49.7% (16,888 subjects) were prescribed with Biguanides and 21.1% (7,162 subjects) were prescribed with Insulin.
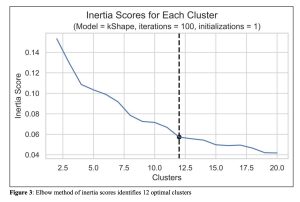
Figure 3: Elbow method of inertia scores identifies 12 optimal clusters
To determine the optimal number of clusters, the inertia score was calculated for each cluster in our model. The elbow method was then used to determine the optimal number of clusters for analysis. To do this, the inertia score was plotted against number of clusters where it was determined that rate of decline was roughly exponential until K = 12, where it became more linear. Using this information, we determined that 12 clusters would be used for analysis.
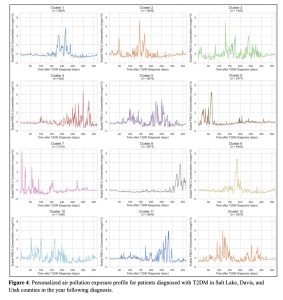
Figure 4: Personalized air pollution exposure profile for patients diagnosed with T2DM in Salt Lake, Davis, and Utah counties in the year following diagnosis.
Shape time-series clustering with 12 clusters were plotted (Figure 4). Cluster size ranged from n = 626 to n = 6402. Groups were clustered together based on similar features shared. For each cluster, the scaled PM2.5 concentration in μg/m3 was plotted against 365 days after the date of T2DM diagnosis. This created a visual representation of air quality trends for one year for each group of patients. We identified variability in air pollution types for each cluster of patients. For some patients, PM2.5 concentration is at a relatively low level for most of the year with dramatic spikes signifying suddenly bad air quality (note which clusters this fits with). For others, there were multiple peaks, while others fluctuated dramatically throughout the duration of the year (note which cluster this describes). Overall, the highest scaled PM2.5 concentration observed was just above 8 μg/m3 and the lowest scaled PM2.5 concentration observed was close to -2 μg/m3.
Discussion
The purpose of this study was to evaluate the relationship between temporal trends in PM2.5 concentrations and glycemic outcomes among patients with T2DM in Davis, Utah, and Salt Lake Counties in Utah. This process allowed is to identify personal profiles of daily PM2.5 exposure for included patients in the year after they were diagnosed with type 2 diabetes.
This study was unique when compared to other research has done because it is the first study to characterize temporal trends in PM2.5 concentration after a type 2 diabetes diagnosis using data-driven methods. This is important because it allows us to develop a deeper understanding of how air pollutant exposure can potentially be a risk factor for uncontrolled or worsening glycemic outcomes.
Some limitations include a lack of access to data on indoor air quality. This is an issue because most people spend a significant amount of time indoors, where exposure to pollutants can be quite different than it is outside. For the purposes of this study, it was assumed that available EPA data could be used to approximate the general air pollution that a patient was exposed to in the year following diagnosis. The study was also limited by the inability to generate a personal air pollution profile for patients lacking an address. This could have skewed the results to favor information about a potentially more affluent subset of the population of the counties of interest, leaving out information about particularly vulnerable individuals. Due to the nature of the demographic information available, for patients with addresses, only one address was available to be used when generating exposure profiles. This means that there is a possibility that many of the patients moved or resided at a different address than was listed in the year after they received their T2DM diagnosis. Due to this, there is a potential that the PM2.5 concentrations that a patient was actually exposed to were different to those estimated for this study. In the study, PM2.5 concentrations in the year preceding the onset of diabetes were not found due to time constraints, which affects the ability to correlate exposure to pollutants with glycemic outcomes.
Future steps to be taken for this study include an analysis of HbA1c measurements in the time period in question. This will allow us to observe how blood sugar levels fluctuate over time and to identify any potential pattern in relation to exposure to pollutants. To further expand on this study, it would also be beneficial to expand the time frame to include both time prior to diagnosis and more than one year after diagnosis. This will allow us to create more comprehensive individual exposure profiles and develop a deeper understanding of the role of PM2.5 exposure in predicting glycemic outcomes. Further analysis is also needed to determine the role of type of air pollution exposure throughout the year. For example, for some groups, air quality was relatively consistent for most of the year following diagnosis, with several dramatic spikes, while for other groups, it fluctuated dramatically. Further analysis could help determine the effects of different exposure types throughout the year. Another direction to take this work in could be to incorporate information on various covariates known to influence diabetes onset and outcomes into the study. These covariates include demographic information such as age, race, gender, and BMI or medications being taken. Incorporating these covariates would allow us to develop a more nuanced understanding of the interplay of more of the factors that affect glycemic outcomes among patients with T2DM.
Acknowledgements
This work was supported by funding from the Office of Undergraduate Research’s Summer Program for Undergraduate Research at the University of Utah awarded to Catherine Petersen. The study was approved by University of Utah Institutional Review Board: IRB_00134728. This research was supported by the National Library of Medicine (T15LM007124), the National Institute of Diabetes and Digestive and Kidney Diseases (F30DK134113), and the National Center for Advancing Translational Sciences (UL1TR002538). All analysis was done in Protected Environment of the Center for High Performance Computing, partially funded by the NIH Shared Instrumentation Grant 1S10OD021644-01A1.
Bibliography
Li Y, Xu L, Shan Z, Teng W, Han C. Association between air pollution and type 2 diabetes: an updated review of the literature. Ther Adv Endocrinol Metab. 2019 Dec 24;10:2042018819897046. doi: 10.1177/2042018819897046. PMID: 31903180; PMCID: PMC6931138.
Meo SA, Memon AN, Sheikh SA, Rouq FA, Usmani AM, Hassan A, Arian SA. Effect of environmental air pollution on type 2 diabetes mellitus. Eur Rev Med Pharmacol Sci. 2015 Jan;19(1):123-8. PMID: 25635985.
Paparrizos J, Gravano L. K-shape: Efficient and accurate clustering of time series: ACM SIGMOD RECORD: Vol 45, no 1 [Internet]. ACM SIGMOD Record. 2016 [cited 2022Aug2]. Available from: https://dl.acm.org/doi/10.1145/2949741.2949758
Riches NO, Gouripeddi R, Payan-Medina A, Facelli JC. K-means cluster analysis of cooperative effects of CO, NO2, O3, PM2.5, PM10, and SO2 on incidence of type 2 diabetes mellitus in the US. Environ Res. 2022 Sep;212(Pt B):113259. doi: 10.1016/j.envres.2022.113259. Epub 2022 Apr 20. PMID: 35460634.
Tavenard R, Faouzi J, Vandewiele G, Divo F, Androz G, Holtz C, et al. Tslearn, A Machine Learning Toolkit for Time Series Data. Journal of Machine Learning Research. 2020;21(118):1–6.
Type 2 diabetes [Internet]. Centers for Disease Control and Prevention. Centers for Disease Control and Prevention; 2021 [cited 2022Aug2]. Available from: https://www.cdc.gov/diabetes/basics/type2.html
Type 2 diabetes mellitus [Internet]. Harvard Health. 2022 [cited 2022Aug1]. Available from: https://www.health.harvard.edu/a_to_z/type-2-diabetes-mellitus-a-
