College of Science
57 Bioinformatics to Detect Functional Interactions Important for the DNA Repair Enzyme MUTYH
Tara Tazehabadi (University of Utah)
Faculty Mentor: Martin P. Horvath (School of Biological Sciences, University of Utah)
Abstract
DNA is the blueprint of all biological life as it provides the means necessary for sharing of genetic information. DNA is formed and stabilized by interactions between four unique bases, Adenine (A), Cytosine (C), Guanine (G), and Thymine (T) which come together in predetermined patterns to create a two-stranded structure known as the double helix. Genetic information is stored in the precise pairing and arrangements of the four bases, encoded in the form of a sequence to allow correct information to be sent to replicated strands.
Adenine must pair with Thymine, and Guanine must pair with Cytosine to retain the stability and information of the DNA. However, exposure of DNA to reactive oxygen and nitrogen species (ROS) lead to chemical damage, DNA base modifications, and incorrect pairings of bases. This mispairing caused by DNA damage can ultimately result in mutations, permanent changes to the information encoded in the DNA sequence, which can lead to malignant cellular phenotypes and life-threatening diseases such as cancer (Banda et al. 2017).
For billions of years, biological systems have been exposed to DNA damage, creating selective pressure that resulted in an ensemble of DNA repair strategies through evolution. My Honors Thesis focuses on the base excision DNA repair enzyme MutY in bacteria and its homologous protein in humans, MUTYH. MutY and MUTYH prevent the accumulation of mutation in DNA by working with partner proteins belonging to the GO DNA repair pathway.
MutY and MUTYH prevent the accumulation of mutations by recognizing and initiating repair at sites where 8-oxo-Guanine mispairs with Adenine (8OG:A mispairs). The 8OG:A mismatch arises due to oxidation of Guanine in G:C pairs followed by replication, and if not repaired can lead to permanent G:C to T:A mutations. In humans, these mutations may lead further to lung, rectal, and colon cancers. The GO pathway involves the recognition, excision, and replacement of the mismatched 8OG:A base pair to restore the authentic G:C base pair. MutY initiates repair on the 8OG:A lesion, and repair is completed with the help of other GO pathway proteins XthA and Nfo which work with MutY in bacteria, as well as APEX1 and OGG1 which work with MUTYH in humans. The GO DNA repair pathway is very complex, and it is not clearly understood how MutY and MUTYH are interacting with their partner proteins. Understanding the functional and physical interactions of these proteins with each other would provide crucial insights and allow us to make predictions about their behaviors and reactions in medical and pharmaceutical settings.
It is known that MutY and MUTYH depend on other proteins, but the exact mechanism of their interaction is still unclear. In my Honors Research I applied Bioinformatics to look for evidence of functional interactions among GO partner proteins as recorded in the evolutionary history of these proteins. A statistical calculator known as Mutual Information (MI) measured pairwise codependency and associations between specific residues belonging to MutY or between one residue belonging to MutY and another residue belonging to a GO repair pathway partner protein. The analysis requires finding many examples of the protein from several different species of organisms. Fortunately, most organisms have a MutY or MUTYH encoding gene. In one set of experiments I looked for functional interactions between residues across the N- terminal and C-terminal domains of MutY and MUTYH, and examined how the results changed as the number of species increased from 50 species to 5000 species. In a second set of experiments I looked for functional interactions between residues belonging to MutY and its GO repair partner proteins, XthA and Nfo. In a final set of experiments I looked for functional interactions between MUTYH and its GO repair proteins, OGG1 and APEX1.
Through several experiments with the MI calculator I have found evidence for functional interactions between MutY and its partner proteins, between MUTYH and its partner proteins, as well as between the two domains of MutY and between the two domains of MUTYH. The number of species included for MI analysis had a big impact in raising the confidence level, such that experiments with more than 200 species gave the best results with confident evidence supporting coevolution and functional interactions.
To further interpret the functional interactions indicated by high MI scores, I visualized the functionally significant residues in a three-dimensional molecular environment with help from the molecular display program ChimeraX. The interactions identified by Bioinformatics and visualized at the molecular level suggest that proteins are evolving together. By observing the residues that have been deemed as important, functional, and evolutionary significant in this thesis, it can become possible to create better mechanism maps of how MutY and MUTYH work, how they interact with their partner proteins, and if certain regions in the protein can be targeted by medicine to reduce the development of cancer or increase the chances of curing cancer in patients with existing lung, rectal, and colon cancers.
Introduction
Although researchers have been able to understand the structure and role of Deoxyribonucleic Acid (DNA) for several decades (Watson and Crick 1953), it has only recently been possible to access large databases containing sequences of DNA encoding proteins, enzymes, and functional RNAs. In 1944, Avery, MacLoad and McCarty showed that the uptake of pure DNA from a virulent bacterial strain could confer virulence to a nonvirulent strain (Avery, Macleod, and McCarty 1944). Their work was followed by Hershey and Chase validating the role of DNA as a genetic information encoding molecule (Hershey and Chase 1952), and by Watson, Crick and Franklin finally explaining the double-helix structure of DNA in 1953 (Watson and Crick 1953). Following that, it took approximately 20 or more years of technological advances before the first DNA sequencing method became available for use (Sanger, Nicklen, and Coulson 1977; Maxam and Gilbert 1977). In the 1990s, large databases established efficient search tools such as the Basic Local Alignment Search Tool (BLAST) at the National Center for Biotechnology Information (NCBI). In 2002, a database for sequences called GeneBank began including whole genome shotgun sequences generated by a semi-automatic technique (K. Smith 2013; K. A. Smith 2008). This recent easy access to large data sets and increasing availability of user-friendly search tools has enabled researchers to ask questions about the function and evolution of proteins across species of organisms, a study that falls into the field called Bioinformatics. Bioinformatics allows us to find evidence for the functional and physical interactions between proteins, domains of proteins, and amino acids, that have worked together through billions of years at a molecular level to improve certain functions such as prevention of mutations in DNA. My Honors Thesis applied a Bioinformatics approach to understand the particular system associated with MutY and MUTYH DNA repair proteins that is dedicated to prevention of mutations and called the GO DNA Repair pathway to detect Mutations in DNA resulting from DNA damage. Exposure to reactive oxygen and nitrogen species (ROS) damages the chemical structure of DNA, adding or changing atoms on the bases, and breaking the phosphodiester backbone. These DNA damaging lesions are especially dangerous during DNA replication because the altered chemical structures can now become permanent mutations caused by incorrect pairing of base pairs (Banda et al. 2017). One of these mispairs known as the 8-oxo-7,8-dihydroguanine: Adenine (8OG:A) mismatch is caused due to the low redox potential of guanine, meaning a high susceptibility to oxidation, coupled with template ambiguity since 8OG can pair with either C or A in the active site of DNA polymerase during DNA replication (Yeang and Haussler 2007; Trasviña-Arenas et al. 2021). MutM (Fpg), MutY, and MutT in bacteria and their functional counterparts in humans OGG1, MUTYH, and NUDT1 respectively, act as a three-part defense system to protect against G:C to T:A mutations. This defense system is called the GO DNA repair pathway and relies on base excision to remove adenine from 8OG:A mismatches as the first step in restoring the authentic G:C base pair (Figure 1).
In the GO repair pathway in Eukaryotes, OGG1 recognizes and excises the damaged 8OG from the 8OG:C lesion leaving behind an Apurinic/apyrimidinic (AP) site, meaning a deoxyribose sugar with no base attached, also called an abasic site. Adenine excision by OGG1 is followed by APEX1 which hydrolyzes the phosphodiester DNA backbone at the AP site, thus making a substrate for DNA polymerase to fill in the missing C nucleotide and DNA Ligase to seal any nicks in the DNA. If DNA replication occurs before OGG1 can find and initiate repair at the OG:C lesion, there is a chance that one of the daughter DNA molecules will now have an OG:A lesion since OG can template insertion of C through Watson-Crick-Franklin base pairing or template insertion of A through a Hoogsten base pair. One more round of replication propels the OG:A lesion into a permanent T:A mutation. To avoid this outcome, MUTYH is dedicated to finding and initiating repair at the OG:A lesion by excising the adenine base. Similar to repair at the OG:C lesion, the resulting AP site across from OG is processed by all of the same GO repair pathway partner proteins APEX1, DNA polymerase, and DNA ligase, to restore an OG:C base pair, giving OGG1 a second chance to complete the repair process.
It is important to note that OGG1 and MUTYH have similar functionalities in that OGG1 removes OG from OG:C base pairs and MUTYH removes A from OG:A base pairs. However, there are instances where the two have to work parallel to each other if OGG1 is unable to recognize or excise the lesion in DNA (Banda et al. 2017)). The exact mechanism of how MUTYH and OGG1 collaborate is still unclear. While we know a lot about the mechanism of OGG1 and MUTYH acting on DNA to repair and prevent mutations, the exact mechanism and interactions between the GO DNA repair pathway proteins is relatively underexplored. For instance, how do such proteins work together to coordinate repair at OG:C and OG:A lesions? And can their physical interactions and communications allow us to create better mechanism maps of their repair pathway?
Similar questions apply to the GO Repair Pathway in the Eubacteria domain where MutY interacts with its two partner proteins, Nfo, and XthA to recognize, excise adenine and replace the mismatched 8OG:A with 8OG:C, restoring a substrate for the MutM-encoded enzyme Fpg which functions analogously to OGG1 in mammals. As observed in Figure 1, communication between multiple proteins is essential in this complex GO DNA Repair pathway. However, exactly how these proteins communicate with each other is still unclear and understudied.
At the intramolecular level, N-terminal and C-terminal domains play critical roles in the function, activity, folding, stability, and shape of MutY and MUTYH. These two domains work together and provide distinct functions to find and initiate repair at 8OG:A mispairs (Bhardwaj et al. 2010). For instance, the N-terminal domain (NTD) in MutY exhibits an adenine-specific binding pocket and contains the catalytic residues that are required for base excision (Woods et al. 2016), whereas the C-terminal domain (CTD) plays an important role in 8OG recognition (Russelburg et al. 2019). Communication between the CTD and the NTD is crucial since removing Adenine at other locations in the DNA would accelerate mutations instead of preventing mutations. While we recognize the separable biochemical functions for the NTD and CTD, we still do not understand how the two domains “talk” to each other to relay the information that yes, this is an authentic 8OG:A lesion, and it is “OK” to remove the adenine here. To understand this question and uncover the functional interactions responsible for this relaying of information, I applied Bioinformatics in my Honors Research project.
Bioinformatics allows for a statistical measure of codependency between two proteins or domains of proteins, also called Mutual Information (MI, see Figure 2), making it possible to find evidence for functional interactions between two different proteins or between two domains in the same protein. Bioinformatics and MI enabled this thesis to draw conclusions and create assumptions behind the precise molecular team work and behavior of the proteins involved in the GO DNA repair pathway. My Honors Thesis will demonstrate that traceable patterns of co- changing regions exist in the sequence alignments of proteins belonging to the GO DNA Repair pathway as detected by statistically significant hig MI scores.
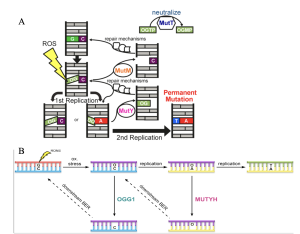
Figure 1. The GO DNA repair pathway. A: In bacteria, MutY acts as a final line of defense to prevent G:C to T:A mutations. Figure from Russelburg et al., 2020. B: In mammals, the GO repair pathway features the key base excision repair enzymes OGG1 and MUTYH. Figure from Banda et al., 2017).
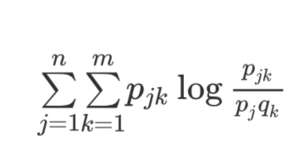
Figure 2. Mutual Information calculation. The Mutual Information (MI) calculation detects interesting covariation between two sets of data defined by j elements for one data set and by k elements in the second data set. For my application, the j elements are the different amino acid residues at one particular position in the sequence alignment for Protein A, and the k elements are the different amino acid residues at a second particular position in the alignment of Protein B. The variables pj and qk refer to the frequency with which the different k and j amino acid residues are observed at the two positions. Importantly, pjk is the frequency observed for the combination of a pair of amino acids at the two positions. In some cases, Protein A and Protein B are two domains from the same protein, as is the case when looking for covariation for positions in the NTD and CTD of MUTYH, for example. The calculation is repeated for all possible pairwise position comparisons in the two proteins.
Results
DNA replication involves a tradeoff between speed and accuracy meaning mispairing of the nucleotides on the template and newly synthesized strand is inevitable. MutY in bacteria and MUTYH in eukarya play important roles in prevention of mutation that otherwise would result from 8-oxo-7,8-dihydro-guanine:Adenine (8OG:A) miss-pairs and work with other proteins in the GO DNA repair pathway to restore the authentic G:C base pair. If left untreated and unrecognized, the pile up of G:C to T:A mutations can lead to lung, rectal and colon cancers as is the case for certain heritable alleles of MUTYH which underperform and predispose family members to early onset disease. In order to understand the teamwork and mechanistic relationships between MutY and MUTYH and their partner proteins in the GO DNA repair pathway, it is important to observe their interactions. The working hypothesis of my Honors Thesis research is that evidence for functional interactions involving MutY in bacteria or MUTYH in eukarya is recorded in the evolutionary history of these proteins. Taking a Bioinformatics approach allowed me to detect covariation over millennia of evolution, measured in the Mutual Information (MI) score and infer functional interactions between two proteins or two domains of the same protein. To calculate MI score, I used the Mutual Information (MI) Calculator which was previously written in the R programming language by Dr. Martin Horvath from the School of Biological Sciences, College of Science, at the University of Utah. A detailed description of how to run the MI calculator can be found in Methods. Essentially, the MI calculator examines alignments of protein sequences to measure the codependency between two amino acid positions (columns) in those sequence alignments, always pairing a column from protein A with a column from protein B. Covariation is expected over the course of evolution if the two amino acid positions are paying attention to each other through functional interactions. The results are summarized into a single graph called the MI distribution graph.
For the calculations to work properly, it is essential to follow the workflow outlined in Figure 3. All experiments required sequences to be downloaded as FASTA files from the correct database and to be put into PROMALS3D to create an alignment of the sequences. The alignments were adjusted by adding the correct headers and removing extra gaps as calculated by R programs I created using the R Studio interactive developer environment (IDE). Protein alignments were analyzed by the MI calculator, and interesting positions in the proteins identified by especially high mutual information scores were visualized in molecular models created with the program ChimeraX.
Interpreting the MI Score Distribution
As we will be looking at several outcomes from different experiments, it is useful to begin with how to interpret the MI score distribution. The MI calculator works by measuring covariation in alignments of amino acid sequences from two separate proteins, reporting the level of covariation as the Mutual Information (MI) score for each possible pairwise comparison of positions in Protein A and Protein B. These MI scores are plotted as a distribution labeled “Info”, an abbreviation of Information, with purple bars as seen in Figure 4. MI score is indicated along the X-axis of the graph, and as we move to the right of the graph, the MI score increases. High MI scores are the interesting outcomes reflecting a high degree of covariation and are taken as evidence for functional interaction.
However, from the purple bars alone we cannot conclude which mutual interactions are statistically significant. Accordingly, we tested for statistical significance by randomizing the species order and repeating the MI calculation to produce the Random distribution labeled “Rand”, as shown with the blue bars in Figure 4. The Random distribution defines regions of the MI score that are caused by random chance and are not statistically significant. The degree to which the two distributions, Information and Random are different, especially in the right-hand portion of the graph reporting high MI scores, gives us confidence that the high MI scores are statistically significant. Furthermore, if the two distributions are highly similar, there is possibly no detectable covariation between the proteins, or data have not been handled correctly while conducting the experiment.
Validating the MI Calculator Results
Given the unfamiliar nature of the MI Calculator in looking for patterns of covariation, it was necessary to check its performance before conducting more experiments. Specifically, I wanted to be sure that the test for statistical significance was working. For example, would the statistical significance test alert me if there are no functional interactions between Protein A and Protein B? I was concerned about MI score validity because initial tests almost always gave interesting patterns with strong differences between the Information and Random distributions. What would the results look like if the two proteins have no chance to interact?
To answer these questions, an experiment was conducted in which the N-terminal domain (NTD) of MUTYH was compared to the NTD of MutY. In this situation, there is no possible way for the two domains to interact since one is evolving in mammals and the other is evolving in bacteria. This experiment was conducted two times using different numbers of species for verification. Since MUTYH and MutY are from different domains of life, Eukarya and Bacteria respectively, the MI distribution graph should show no functional interactions, such that all mutual interactions can be explained by random chance, if the MI calculator and the quality control check were working correctly. As seen in Figure 5, all mutual interactions between the two domains reported in the Information distribution (Info, purple) were equal in value and height with the Randomized interactions (Rand, blue). These MI scores and MI distribution graphs explain that no functional interactions which were not rejected by our control experiment were observed between the two domains of life which had separately evolved from each other billions of years ago. This experiment therefore validates the strategy for statistical significance, giving me confidence that the MI Calculator works properly and accurately.
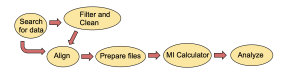
Figure 3. Workflow diagram
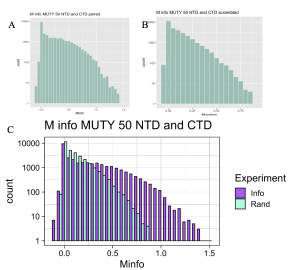
Figure 4. MI Distribution Graph. The example is taken from the analysis of MutY NTD versus MutY CTD across 50 species. A,B: Separate graphs produced for analysis when species are paired (A) and when species order is scrambled (B). C: Combination of the Information and Random distributions to produce the MI distribution graph. The Information MI score distribution (Info, purple) extends to higher MI scores plotted along the X-axis compared to the Random distribution (Rand, cyan), indicating that not all mutual interactions are by random chance. The difference between the Info and Rand MI scores in the right-hand region of the plot reporting rare, high-scoring positions indicates statistically significant interactions between the two domains of MutY.
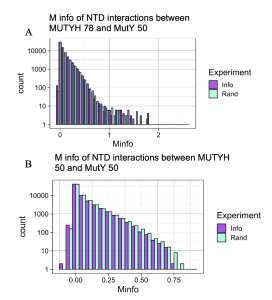
Figure 5. Checking Mutual Interactions between the NTD of MutY and NTD of MUTYH. Graphs A looks at interactions between 78 species of MUTYH NTD and 50 species of MutY NTD. Graph B looks at the interactions across 50 species MUTYH NTD and 50 species MutY NTD. Random interactions (Rand, purple) match or surpass the value of Information interactions (Info, cyan) in both graphs, indicating that all detected interactions between the two domains are by chance and not statistically significant. This important result validates the use of the Random interaction distribution as a test for statistical significance, demonstrating that it works for both large and small numbers of species.
Choosing Between UniProt and NCBI Databases
UniProt, a freely accessible database of protein sequences, was initially used to obtain fasta sequence files of MUTYH and MutY proteins from 50-100 species . In attempting to increase the number of species included, I was faced with limitations on the UniProt database where selecting more than 200 species became difficult. I aimed to look at co-changing patterns between proteins across 500 and 5000 species to increase the confidence interval of the MI scores. Furthermore, my ability to clean the sequences obtained from UniProt relied on the TCSH Command Line tool, which further limited performance and reduced time efficiency in conducting the experiments. To speed up the process time as well as gain access to larger samples of sequences and species, I explored a new sequence database, the National Center for Biotechnology Information (NCBI), which is part of the United States National Library of Medicine (K. Smith 2013). Different from UniProt, with NCBI I could apply the Basic Local Alignment Search Tool for Proteins (BLASTP) to quickly retrieve hundreds and thousands of sequences using a single fasta or accession ID of the desired protein as an input (K. Smith 2013).
While NCBI provides easier, more efficient access to a large number of sequences, it includes isoform sequences, reducing the quality of data compared to that sourced fromUniProt, which does a better job of filtering isoforms and focusing on unique species. This dilemma of choosing between quantity versus quality for NCBI and UniProt, respectively, was resolved by comparing MI results from three separate experiments as seen in Figure 6. Protein sequences for these three experiments were obtained using the two databases, NCBI in panel A, and UniProt in panel B. The three experiments compared results of mutual interaction between MUTYH versus OGG1 at 50 species, MutY NTD versus CTD at 500 species, and MUTYH NTD versus CTD at 500 species level. At both 50 and 500 species UniProt returned better results by producing graphs with more distinguishable differences between MI scores (Info) and the control scores (Rand) obtained after randomizing the order of the species for Protein A and Protein B. The degree to which the MI score distribution (Info) extends past the control scores (Rand) gives us greater confidence that the very highest MI scores are statistically significant and report important functional interactions, and this was the case for the sequences sourced from UniProt. Notably, NCBI performed almost identically to UniProt for 500 species in the MUTYH NTD versus MUTYH CTD experiment, but performed poorly in the MutY NTD versus CTD experiment with 500 species and also poorly in the OGG1 versus MUTYH experiment with 50 species. This comparison analysis concluded that NCBI should be reserved for experiments involving more than 500 species, and UniProt can provide an initial source of the sequences needed for Bioinformatics and performs better than NCBI if analyzing 500 or fewer sequences.
In retrospect these results were perhaps expected as UniProt uses a Knowledge Base tool known as UniProtKB. UniProtKB finds high quality sequences extracted from the literature and curator-evaluated computational analysis, where novel function, structural and biochemical data have been assigned priority (UniProt Consortium 2007). NCBI, on the other hand, uses the Basic Alignment Search Tool (BLAST) with little or no human intervention. BLAST uses UniProtKB_RefSeq mapping provided by the UniProt Consortium to retrieve sequences that are 100% identical to the RefSeq protein and are either from the same organism or use the same protein accession numbers. NCBI also computes related sequences which can include UniProtKB sequences to be displayed in a separate section in the results page of the BLAST Tool (Wheeler and Bhagwat 2007). NCBI also uses the algorithm of returning sequences which are almost identical to the parent protein, in small numbers of sequences, which can greatly reduce our chances of getting any diversity in our pick of species and therefore will reduce the
number of functional interactions that can be calculated by MI Calculator. This is harmful to my downstream application because diversity in sequences helps MI with calculation of covariation, however if diversity is reduced by NCBI’s algorithm, MI will not produce good and accurate results in experiments involving a small number of species. With these considerations in mind and with the goal of obtaining better data, sequences for 500 or fewer species were obtained using UniProt, whereas NCBI provided sequences for the larger experiments with more than 500 species.
Mutual Information Depends on the Number of Species
In the initial steps of my experiment using the two domains of N-terminal and C-terminal domains as my two proteins in the MI calculator, I included a small number of species to quickly detect functional interactions. I wondered if these patterns would be strengthened by including more species to capture a larger cross-section of evolutionary history. To test how Mutual Information behaved as a function of the number of species included I repeated a few experiments with different numbers of species ranging from 100 to 5000 species.
The two proteins were tested across three different numbers of species, 50 (100 for MUTHY), 500, and 5000. To highlight differences in the MI score distributions as a function of the number of species, I estimated a Z-score, the number of standard deviations that is below or above a reference point such as the mean value of measurement. The Z-score for an MI distribution was calculated by taking the difference in maximum MI score observed for the Information distribution and the Random distribution, and dividing that difference in maximum scores by the MI cutoff value defined by the maximum score in the Random distribution. The point at which Random distribution stops in the MI distribution graph is referred to as MI Cutoff in Table 1. Since Z-score is an estimation of the confidence interval in statistics, as Z-score increases, my confidence in MI scores for the Information distribution increases.
As is seen in Figure 7 and Figure 8, both MUTYH and MutY showed an increase in the number of functional interactions detected between the NTD and CTD domains as the number of species increased, increasing the confidence of data as indicated by Z-score. It is of note that the value of MI cutoff decreased almost linearly as the number of species increased. This behavior showed that as the number of species increases, the number of functional interactions will also increase which in turn will increase the confidence interval in MI score as shown by Z-score.
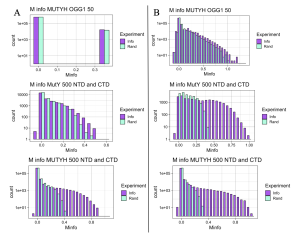
Figure 6. Comparing NCBI and UniProt. A: Left-hand panel of the figure shows outcomes for sequences extracted by NCBI. B: Right-hand panel shows outcomes for sequences extracted by UniProtKB. See text for further interpretation.
Table 1: Summary of Results
|
Proteins analyzed |
Target number of species |
Database |
Number of statistically sig. MI Score |
MI Cut off |
Z- score |
Interacti on |
|
MUTYH NTD vs CTD |
100 |
UniPort |
83 |
0.8 |
1.3 |
YES |
|
500 |
UniPort |
308 |
0.4 |
2.4 |
YES |
|
|
5000 |
NCBI |
2565 |
0.15 |
4.3 |
YES |
|
|
MutY NTD vs CTD |
50 |
UniPort |
49 |
1.0 |
0.9 |
YES |
|
500 |
UniPort |
384 |
0.5 |
1.5 |
YES |
|
|
5000 |
NCBI |
2546 |
0.15 |
2.0 |
YES |
|
|
MUTYH vs OGG1 |
50 |
UniPort |
13 |
1.0 |
0.2 |
NO |
|
100 |
UniPort |
20 |
1.1 |
0.1 |
NO |
|
|
250 |
UniPort |
34 |
0.7 |
0.2 |
ERHAPS |
|
|
MUTYH vs APEX1 |
50 |
UniPort |
13 |
0.78 |
0.1 |
YES |
|
100 |
UniPort |
30 |
0.6 |
0.6 |
YES |
|
|
250 |
UniPort |
12 |
0.5 |
0.6 |
YES |
|
|
MutY vs XthA |
50 |
UniPort |
3 |
ND |
ND |
NO |
|
100 |
UniPort |
16 |
ND |
ND |
NO |
|
|
250 |
UniPort |
29 |
ND |
ND |
NO |
|
|
MutY vs Nfo |
50 |
UniPort |
3 |
ND |
ND |
NO |
|
100 |
UniPort |
11 |
1.63 |
0.1 |
YES |
|
|
250 |
UniPort |
25 |
1.25 |
0.3 |
YES |
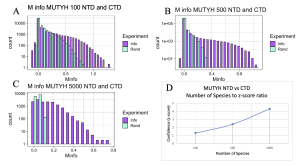
Figure 7. MI Distribution graphs between the NTD and CTD of MUTYH. Graphs A to C: Looking at mutual interactions between the two domains across 100 to 5000 species. Graph D: Linear and positively correlated relationship between number of species and Z-score. As the number of species increases, confidence in MI also increases.
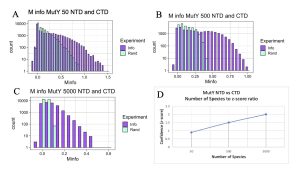
Figure 8. MI Distribution graphs between the NTD and CTD of MutY. Graphs A to C: Looking at mutual interactions between the two domains across 50 to 5000 species. Graph D: Linear and positively correlated relationship between number of species and ZZ-score. As the number of species increases, confidence in MI also increases.
Partner Protein Interactions for MutY and MUTYH
Having established that N-terminal and C-terminal domains within MutY and within MUTYH are coevolving, I next applied the MI calculator looking for functional interaction between DNA repair proteins in the GO Repair Pathway. Specifically, I looked for evidence that MUTYH is functionally interacting with OGG1 and, separately, if MUTYH is interacting with APEX1. As MUTYH and OGG1 have to work in sync with each other to recognize OG:A mispairs and remove the Adenine, and at a later stage the OG, I predicted that the two proteins would have functional interactions with each other as detected in covariation reported by the MI Calculator. As seen in Figure 9, evidence for interactions between MUTYH and OGG1 may exist, however it is very weak, as inferred from low Z-scores regardless of the number of species analyzed. The low Z-score between OGG1 and MUTYH might indicate that proteins are not functionally interacting with each other, or an issue existed with the sequence alignments. The problem with the sequence alignment could be explained by OGG1 being a newly discovered homolog protein of MUTYH. Because not many sequences are available for OGG1 on UniProt and NCBI yet, sequence alignments may not be complete for MI calculations.
The APEX1 versus MUTYH experiment showed a positive linear relationship between z-score and number of species, much similar to what was observed in the experiment comparing two domains of MUTYH and MutY (Figure 10). But differences in the level of confidence between interactions of APEX1 and MUTYH and two domains of either MUTYH or MutY exist. This difference is explained by the two domains of MutY and MUTYH being guaranteed to have the same species, coming from the same protein. However, APEX1 is not part of the MUTYH protein therefore the confidence interval of functional interactions between the two proteins can start at a lower point. The main takeaway with this experiment was that positive relationships between the functional interactions of the two proteins, MUTYH and APEX1, exist. Much different from results observed between functional interactions of OGG1 and MUTYH which were inconsistent and had very low overall z-score.
It is of note that no functional interactions between APEX1 and MUTYH were observed at the 50 species. Meaning that in order to correctly make assumptions about whether interactions exist between two proteins, it is essential to test them at different numbers of species. However, it is difficult to find more examples of MUTYH and its partner proteins APEX1 and OGG1 which limited the analysis of functional interaction dependency on the number of species. In contrast to mammalian DNA repair proteins such as MUTYH and its partner proteins, databases contain vast numbers of bacterial and archaea sequences. Therefore, I hoped that the MI analysis would lead to more confident results for MutY and its partner proteins, XthA and Nfo.
Initially I hypothesized that interactions between MutY and its partner proteins would be similar to interactions of MUTYH and its partner proteins. To check the hypothesis, functional interaction between MutY and its two partner proteins, XthA and Nfo were checked across 50- 250 species. MutY and XthA showed to have no functional interactions that could be detected by MI. Lack of functional interactions between the two proteins is accurate because the results were consistent across different numbers of species, Figure 11. Next, interactions between MutY and Nfo, another one of its partner proteins, were tested. Functional interactions between the two proteins were slightly seen at 100 level species but were more clearly observed at 250 level species as shown in Figure 12. The existence or lack of functional interactions between MutY and its partner proteins, XthA and Nfo rejected the hypothesis that MutY and its partner proteins interact the same way as MUTYH interacts with its partner proteins, although both are homologous proteins of each other. However, having more bacterial sequences available in the databases can give us more assurance of the resulting MI distributions.
Conservation of Functionally Important Regions Across Species through Evolution
The Mutual Information Calculator relies on variation in amino acid identity to detect covariation. Absolutely conserved positions in the sequence alignment are guaranteed an MI score of zero as are positions with a high degree of variation that does not correlate to variation in a second position in the other protein. The “winning” MI scores that are significantly higher than the MI cutoff are interesting because these suggest functionally important interactions that are partially, not absolutely conserved across evolution.More the DNA repair proteins I studied, we have outside information about functionally important regions and can view these in the experimentally determined protein structure. To observe whether functionally important regions in a protein structure correspond with functional interactions detected by the Mutual Information calculator, I examined winning positions in the structures of MUTYH and MutY.
Four amino acids are known to interact with iron-sulfur clusters in both MUTYH and MutY proteins. Cys261, Cys 268, Cys 271, and Cys 277 interact with an iron-sulfur cluster in MUTYH and Cys198, Cys 205, Cys208, and Cys 214 interact with the iron-sulfur cluster in MutY. These critical Cys amino acids were cross-referenced with the winning positions identified by high MI scores when analyzing the NTD and CTD for MUTYH and MutY. I found that all cysteine residues were amazingly well conserved and retained across 500 and 5000 species, explaining why the Cys positions were not flagged by high MI scores. Interestingly, the amino acids located right before and after the cystines occupied winning positions as indicated by high MI scores consistent with the functional importance of the iron-sulfur cluster illustrated in Figure 13. It is of note that interactions between the iron-sulfur structure and the CTD were observed in the MI distributions obtained with a larger number of species; with a smaller sample of species, 50 for MutY and 100 for MUTYH, these interesting interactions were not detectable. Furthermore, amino acids around the cysteines which were recognized from experiments with 500 and 5000 species, which are located in the NTD of both MutY and MUTYH showed interactions with the CTD which is very far away in the structures of these proteins.
A zinc ion located in the interdomain connecter region (IDC) of MUTYH, is functionally important for the proper engagement and position of the two functional domains (Nuñez et al. 2018). In order to see whether the previous observations from SF4 structure stand true for all amino acids interacting with functionally important groups in a given protein, I compared the MI “winner” data that was obtained from the MI calculator to His 56 and Cys 300, which are the two amino acids that directly interact with the zinc ion in the reference structure of MUTYH (PDB ID 7EF9). As expected, His 56 retained absolute conservation across species, explaining why it is not found in the winner positions flagged by the MI calculator. However, a modest degree of variation for Cys 300 across 500 and 5000 species allowed for inclusion of this cysteine in the winner positions. As seen in Figure 14, Cys 300 in the reference sequence CALNT in the 7EF9 structure, was analyzed to not only have a direct interaction with the zinc ion, but it also was involved in presumably functional interactions with several residues in the CTD as suggested by high MI scores calculated across 500 and 5000 species in MUTYH. Personally, it was really cool to see how MI scores correlated with functionally important regions of protein structure!
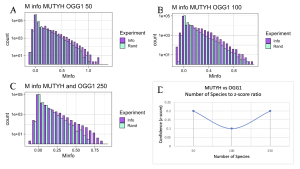
Figure 9. MI Distribution graphs between the MUTYH and OGG1. Graphs A to C: Looking at mutual interactions across 50 to 250 species. Graph D: Linear relationship between Number of Species and Z-score. As the number of Species increases, confidence in MI also increases
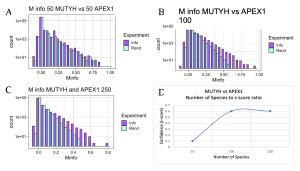
Figure 10. MI Distribution graphs between the MUTYH and APEX1. Graphs A to C: Looking at mutual interactions across 50 to 250 species. Graph D: Linear relationship between Number of Species and Z-score. As the number of Species increases, confidence in MI also increases
M info MUTYH vs APEX1 100
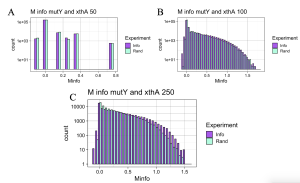
Figure 11. MI Distribution graphs between the MutY and XthA. Graphs A to C: Looking at mutual interactions across 50 to 250 species.
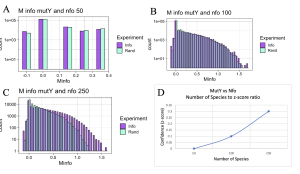 Figure 12. MI Distribution graphs between the MutY and Nfo. Graphs A to C: Looking at mutual interactions across 50 to 250 species. A: Random information (RAND) bars match with that of mutual information bars (INFO) showing that no functional interactions exist between the two proteins. B,C: Functional interactions are becoming visible as more species are used. Graph D: Linear relationship between Number of Species and Z-score. As the number of Species increases, confidence in MI also increases
MUTYH and its GO Pathway Partner Proteins
Next, I wanted to see whether 3D structures of MUTYH and itss partner proteins showed functionally important elements that were linked by MI scores. At both 100 and 250 species, two amino acids in APEX1 showed functional interactions with CTD of MUTYH protein Figure 15. Other amino acids were also recognized by MI to be interacting with MUTYH, however they could not be visualized in ChimeraX because they did not code for secondary structures. Interestingly, OGG1 behaved similarly to APEX1 in that the residues linked by MI had functional interactions with the CTD region of MUTYH. Figure 16. C- terminal Domain of MUTYH is essential in the function of folding over the DNA to recognize lesions (Russelburg et al. 2019). These structural interactions can show that MUTYH partner proteins specifically interact with the region of MUTYH that is essential in the GO DNA Repair Pathway.
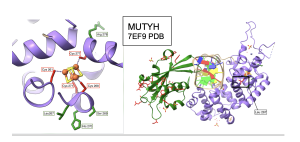
Figure 13. Residue interactions around Fe-S Cluster in MUTYH. Left: Close up view of the residues surrounding the Fe-S cluster, Cysteines are color coded in red, while residues indicated by winning MI scores are highlighted in green. Right: Zoomed out view. For simplicity, showing interactions between Leu 267 and residues in the C terminal domain both color coded in red. CTD in green and NTD in medium purple. Figure prepared with coordinates from PDB 7EF9.
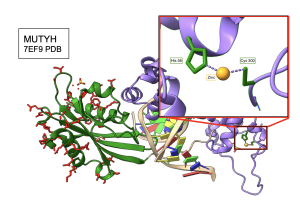
Figure 14. Cys 300 of MUTYH interacts directly with Zinc ion and the CTD. Cys 300 was flagged as a high scoring “winner” in the MI distribution when paired with several residues found in the CTD. The crystal structure shows a direct connection to the zinc ion. Structure links MI scores to functionally important elements like metal ion binding sites.
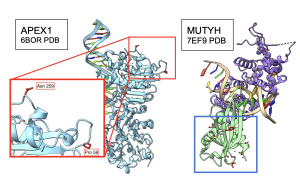
Figure 15. Interactions between APEX1 and MUTYH. Pro59 and Asn 259 in the 6BOR structure of APEX1, the red box, interact with the CTD region of MUTYH 7EF9 structure in the blue box. Functional amino acids colored in red. CTD of MUTYH in light green.
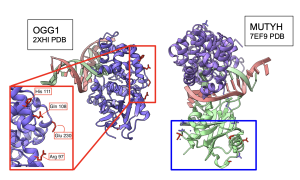
Figure 16. Interactions between MUTYH and OGG1. residues in the 2XHI structure of OGG1 that code for secondary structures and have high MI scores (shown in red box) interact with the CTD region of the 7EF9 structure of MUTYH (shown in blue box).
Discussion
The role of Deoxyribonucleic Acid (DNA) has been discovered and researched for many years now. In 1944, Oswald Avery, Colin MacLeod, and MacLyn McCarty showed the uptake of a pure DNA in mice from a virulent bacterial strain (Avery, Macleod, and McCarty 1944). This indicated that this strain could confer virulence to a nonvirulent strain, meaning DNA influences cell properties and their outcomes. Later, in 1952 Alfred Hershey and MarthaChase proved that genes are made of DNA by radiolabeling bacteriophage protein coats and DNA core separately, finding that it is DNA that is used in a bacteriophage infection (Hershey and Chase 1952). This added another piece to the puzzle, demonstrating that DNA is the source of hereditary information. In 1953 Rosalind Franklin would experimentally produce X-Ray crystallography images of what appeared to be a double-helical structure of DNA. Following these findings, it was James Watson and Francis Crick who, using Franklin’s images, would develop what has become the modern Watson-Crick double-helical model of DNA (Watson and Crick 1953). These scientists and their experiments were the beginning of the understanding of our own genome and cell biology as they would explain DNA as genetic material and create its secondary structure.
It was not until over 25 years after these discoveries that advanced technologies and sequencing methods enabled the study of the DNA structure and its function at a molecular level (Gauthier et al. 2019). The National Center for Biotechnical Information (NCBI) famous search tool, the Basic Local Alignment Search Tool (BLAST) was only discovered in the 1990s and the first genome shotgun sequences were not included in the GenBank tool until 2002 (K. Smith 2013).
It has only been approximately 20 years since access to a large database with many sequences has become available to researchers all over the world. As the world is progressing towards more technological advances in the field of research and medicine, the access to a large number of datasets has allowed researchers to make many new assumptions about the behaviors of proteins, enzymes, and nucleotides, and has given them the tools necessary to analyze, visualize, and answer these questions. This explosion in the advances of bioinformatics research has and will continue to have an evolutionary impact on the medical and pharmaceutical world targeting specific amino acids in a sequence and observing distinctive cellular behaviors at the molecular level have become increasingly essential for the improvement of our own understanding of cell biology and science as well as the development of modern medicines to battle fatal diseases such as cancer.
MI Score as an Indicator of Coevolution
Mutual Information (MI) Calculator computes mutual codependency between two variables, two proteins for example, meaning as the measure of the strength of association between two proteins increases, codependency between the two proteins increases also. The MI Score is the strength of association between these given proteins and since the experiments focus on the behavior of protein domains and partner proteins, the MI Score can be interpreted as coevolution and codependency between the two proteins (Little and Chen 2009; Kinney and Atwal 2014).
Using bioinformatics and analyzing the sequences from thousands of species, many interesting conclusions have been made from MutY, one of the DNA repair proteins. Bacterial MutY and its eukaryotic ortholog, MUTYH specifically recognize OG:A mispairs, where as a result of mutation an oxygenated-guanine is in place of adenine, in DNA as shown in the results section.
To emphasize some key points of my research it is understood that as the number of species analyzed increases, the difference between Random and Information MI scores also increases to increase the confidence interval of the results. Meaning as the difference between the two scores increases, covariation and codependency between the two values also increases. Secondly, it was concluded that MutY and MUTYH do not behave identically with their partner proteins despite being homologous proteins. And finally, it is important to note that while functional interactions were observed in the form of MI scores, the visualization of the proteins in the modeling software, ChimeraX revealed interesting behaviors between the amino acids that have evolved together through time.
Coevolution for DNA Repair Partner Proteins
MutY’s and its eukaryotic ortholog structure MUTYH have the ability to recognize and prevent mutations caused by the 8OGuanine:adenine (8OG:Aa) mispair on the double-stranded DNA structure. As OGG1 recognized and repairs OG:C lesion, MUTYH recognized and repairs OG:A lesions in the GO DNA Repair Pathway. This complex pathway is then continued by APEX1 which excises the generated AP site opposite of the 8OG strand to initiate repair (Tominaga et al. 2004; Russelburg et al. 2019).
The GO DNA repair pathway is complex and it is essential for MUTYH to work closely with its partner proteins to allow this repair mechanism to work smoothly. This tight interaction between MUTYH and OGG1 as well as MUTYH and APEX1 was visualized by modeling the interesting amino acids as indicated by MI score calculations in ChimeraX. As mentioned in the results section, most residues indicated by the MI score in both APEX 1 and OGG1 experiments, did not code for secondary structures. However, the few that were visible showed selective interaction with the C-terminal domain (CTD) of MUTYH. As it was published in a research article, the presence of the MUTYH CTD prevents OGG1 and APEX1 from inappropriately processing its substrate and product. If MUTYH did not have the ability to prevent OGG1 from acting on its product, then improper excision of 8OG opposite of the AP site could cause loss of information bases located on both strands of DNA (Tominaga et al. 2004). Meaning that through many years of evolution, certain amino acids in APEX1 and OGG1 have coevolved mostly with the CTD of MUTYH through billions of years to perfect this collaborative mechanism of DNA base repair that can help save millions of people from lung, rectal, and colon cancers if studied more deeply.
Furthermore, after running three experiments involving 100, 500, and 5000 species of MUTYH sequences to study MI Score and codependency between the two domains of the protein, N-terminal domain (NTD) and CTD, it was revealed that a specific residue in the CTD loop sits in an anti-conformation to the NTD and is positioned in an area with the most interactions with the NTD. This interaction was not previously expected as the residue sits farther away from the linker region between the CTD and NTD region, meaning that intramolecular interactions were possibly not the results of this interaction. Visualization of this residue, however, led to the discovery of the intramolecular interaction between the two domains. In other words, although these regions are far from each other, they are possibly interacting intramolecularly on separate MUTYH proteins as displayed in Figure 17.
Understanding the coevolution of proteins for medical application
This knowledge was observed using a newly advanced bioinformatics approach and 3D visualization enabled by ChimeraX and has opened many doors into not only understanding why certain regions of partner proteins or domains might interact with each other, but also allow us to target specific amino acids in a given protein and conduct more focused research to understand the reasoning behind 8OG:A base repair mechanism and create more promising assumptions for pharmaceutical conduct in medicine. For instance, in 2017, Banda and colleagues showed that the lack of MUTYH and OGG1 enzymes cause spontaneous tumor formation when compared to mice that retained the OGG1 enzyme. Furthermore, it was revealed that increased oxidative stress and 8OG formation had become hallmark characteristics of neurodegenerative disorders such as Alzheimer’s, Huntington’s, and Parkinson’s diseases (Banda et al. 2017). However, specific mechanisms of how and why MutY and MUTYH might be related to such different types of diseases are still unknown. Using bioinformatics as a tool of modern research, it is now possible to observe and explain the interactions and behaviors of repair proteins and unlock many doors to designing molecular mechanisms and forming significant predictions. Bioinformatics will also play a key role in targeting more effective substrates in modern medicine using an evolutionary perspective.
MutY and its GO Pathway Partner Proteins
Interestingly, out of all the experiments conducted to check functional interactions between MutY and its partner proteins, only the Nfo protein at the 250 species level accurately returned a positive indicator of coevolution between the two proteins via the mutual information score results (Table 1). Functional interactions between Nfo and MutY could not be clearly distinguished at the 100 level species as mutual information score was not consistent between two separate experiments which were run for this relationship. Furthermore, neither of the 250 species or 100 species level experiments between the two proteins could be visualized in ChimeraX as reference structures could not be recognized by MI calculator to aid with visualization. However, MI calculator was inspected and it was concluded that although debugging the final steps of MI calculator might become necessary to avoid such issues in the future, they do not disturb the accuracy and data when producing the MI distribution graphs. Therefore, using the graphs it is clear that coevolution does exist between the two proteins, Nfo and MutY, at the 100 and 250 level species, however they cannot be visualized at this time.
Prospectus
Looking forward, further improvements to the MI calculator performance in identifying reference structures must be done to increase the chances of visualizing the interesting residue behaviors in a 3D environment such as ChimeraX. Future research analyzing the Functional properties of amino acids as indicated by a MI score will be necessary to draw more precise conclusions about other molecular interactions as was observed in these experiments. More experiments must be conducted to check these functional interactions between MUTYH and MutY and their respective partner proteins. This research should include a large scale of species, more than I was able to analyze due to time constraints.
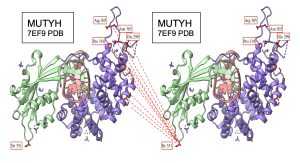
Figure 17. Intermolecular interactions between NTD and CTD of MUTYH on PDB 7EF9 structure. CTD shown in light green and NTD shown in medium purple. I 351 located in the loop of CTD seems to be the residue interacting the most with the NTD region. Interacting residues on both NTD and CTD colored in red for visibility. Few residues on NTD labeled for reference. Dashed lines indicate interaction between the residues.
Methods
Obtaining Sequences from Databases
FASTA sequence files for experiments that required 250 or less species of MUTYH, MutY, APEX1, OGG1, XthA, and Nfo, were obtained from UniProt. Initially the older version of Uniprot offered little filtering options and was therefore less user friendly but later updates allowed me to obtain better results. In order to obtain sequences for MUTYH and MutY proteins from UniProt I searched for the name of the protein in the search bar, selected for all of the sequences using the “select all” option on the top left side of the results pages, and visually identified and unselected sequences that seemed to not have been derived from the desired protein or if the sequence lengths seemed to be outside of the normal range. The sequences were then added to the “basket”, a data holder tool on UniProt. The “basket” tool allowed me to download the sequences in the desired format, which was FASTA so that I could further edit the sequences as needed. The older version of UniProt did not allow me to select more than 200 sequences at once which was one of its main limitations.
A newer version of UniProt became available about midway through my work, and allowed for better sequence retrievals for the second round of experiments looking at partner protein interactions. Using the Advanced Search of the UniProtKB Database on the UniProt official website, UniProt.org, the desired protein’s name was inserted, MUTYH, MutY, APEX1, OGG1, XthA, or Nfo, in the field titled “Gene Name [GN]”. Name of the protein that I explicitly did not want to be mixed in was inserted in the field titled “Gene Name [GN]” categorized as [NOT], which was only explicitly reserved to eliminate MutY sequences from our MUTYH search, and the target sequence length was inserted in the “sequence length” field categorized as [AND]. Sequence length of 400-600 amino acids was applied for MUTYH, 300-500 amino acids for the MutY experiments, 300-450 amino acids length was applied for OGG1, 300-400 amino acids length was applied for APEX1, and 200-300 amino acids length was applied for XthA and Nfo proteins. Figure 18 shows an example of the search bar with options and filters applied to find MUTYH sequences.
FASTA sequences for thousands of species. It was obtained from NCBI’s BLASTP tool which I had reserved for retrieval of large datasets. The browser for the search tool was quickly accessed using the following url: https://blast.ncbi.nlm.nih.gov/Blast.cgi?PROGRAM=BLASTP&PAGE_TYPE=BlastSearch&LI NK_LOC=blasthome
The link was obtained by combining the base url, https://blast.ncbi.nlm.nih.gov , with Blast.cgi, which is the general blast tool, and using BLASTP, as the main program for looking at proteins. The url was closed by referring to the home page of the search tool using the page type description PAGE_TYPE=BlastSearch&LINK_LOC=blasthome (Sayers 2021; Kans 2022; “EDirect_EUtils_API_Cookbook” [2016] 2022).
In order to get a large number of sequences for MutY and MUTYH, accession IDs of the proteins needed to be inserted inside the BLASTP search box. Accession IDs were obtained by initially searching the desired protein from the desired organism, e.g MUTYH of Mus musculus (mouse) in the protein database of NCBI, and clicking on the result that is representative of the desired protein from the desired organism. After inputting the accession ID into the search tool, the algorithm parameters were adjusted such that max target sequence was set to 500 or to 5000, except threshold was kept at 0.05, and low complexity regions were filtered out. To gain access to sequences with more taxonomic depth, Clustered nr was selected as the database for BLASTP. As explained in the results section, only accession IDs of MUTYH, MutY and OGG1 were needed for the experiments which are shown in Table 2. Examples of how the search was performed can be found in Figure 19.
Alignment
PROMALS3D, an online alignment tool, was used to align the various sequences. PROMALS3D uses an advanced technique to create Multiple Sequence Alignments (MSA) by combining information gained from BLAST and PSI-BLAST searches to identify homologous sequences, predicted secondary structures, and retrieve 3D structures to increase the quality of the alignments (Pei and Grishin 2014). PROMALS3D outputs different types of alignments, and includes the option to view the alignments as a single line or in brackets of certain lengths. Examples of the color-coded alignment and the alignment in the form of a FASTA file is shown in Figure 20. I visualized these alignments using the input format of the FASTA file option which allowed me to copy and paste the alignments into a text editing software, Sublime Text. From here I was able to further edit these sequences to an appropriate and efficient form before running them in the MI calculator.
Preparing and Cleaning Data
Separate approaches needed to be taken to clean the FASTA sequences that were retrieved either using UniProt or NCBI as the database. In both cases, the ultimate goal is to obtain two necessary files with correct formatting that can be easily read in the preprogrammed MI calculator. The first file must contain a list of taxonomic identifiers, or taxon IDs of all the species in the experiment. FASTA headers extracted from the UniProt include protein names, scientific names of the organisms, gene names, taxon IDs, and database identifications. Taxon IDs are introduced with the acronym, OX=, in the header. Therefore this information can be used to create a list of all the OX values and use it as the species list. The next file must contain the aligned sequences without the headers as will be further explained below.
UniProt: Preparation of the Species List
Tsh Command Line Tool and the “grep” function allowed me to create a list of taxon IDs which will often be referred to as the list of species throughout the thesis. The “grep” command is a Command Line tool which searches for regular or repetitive expressions in the headers of the FASTA files and sends them into a separate temporary file. This temporary file was then visualized and coded to remove all matched white spaces or gaps, using the code“ :g/\s\+/s//\r/g ” where “g” is a global search flag marker that uses RegExp search to look for a pattern throughout a single string, “\s” matches all white spaces, “\s+” counts for one or more spaces, and “r/g” replaces all occurrences. This code was then closed using the write and quit “:wq” function. This sequence of codes creates a list of all the header information, each presented at a single new line. Next, all the taxon IDs were extracted by using the grep function and looking for the character pattern “OX=”. Since the pattern “OX=” occupies three character positions, the grep “OX=” command was piped, and the “cut” command further extracted and maintained all characters at positions 4 to 20 by “cut -c 4-20 file.name”. This only retained all the following integer values specified by “OX=” in the list while also omitting the “OX=” pattern. The end result is a simple file that shows the list of gathered taxon IDs and no other data.
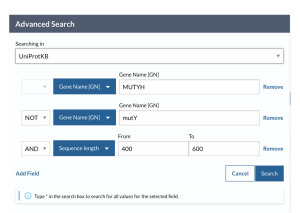
Figure 18. UniProt Advanced Search tool
The alignment that is produced from PROMALS3D includes the structure sequence, which increases the total number of the species by one. Since the MI calculator uses a pattern matching algorithm to match the number of species to the number of input sequences, the species list needed to be further adjusted by adding the alignments reference structure taxon ID to the list, matching the total number of species to the total number of sequences. This list was then titled “species” in order for it to be recognized by the MI script in R Studio.
UniProt: Preparation of the NTD and CTD Sequences
Two files needed to be created by cutting the aligned sequences obtained from PROMALS3D into two separate files for the N-Terminal Domain (NTD) and the C-Terminal Domain (CTD), respectively. To locate the sequence regions from which the two domains needed to be cut, it was necessary to visualize the reference structures of the MUTYH and MutY proteins in ChimeraX, an extensible program for interactive visualization and analysis of molecular structures (Pettersen et al. 2021). From here I located the amino acids at the two ends of the linker region which separates the two domains which surround the DNA double-helix. The resulting residue sequences were recorded to be the beginning and ending of the NTD and CTD domains. For MUTYH, the NTD was determined to be from glutamine with the sequence:QASVS, to phenylalanine with:GVANF. The CTD was determined to be from arginine of REEYS to glutamine of YEDHRQ in MUTYH mouse reference structure, 7EF9. For MutY, NTD was determined to be from proline of PAREF to leucine of VAEEL and CTD was determined to be from lysine of KQVPL to alanine of YKEWA in the reference structure, 6U7T, from Geobacillus stearothermophilus. After downloading a new alignment that was obtained from PROMALS3D into a text editor, the position of the beginning and ending sequences of the two domains were obtained in the reference structure’s alignment which is often the last sequence in the alignment. Each alignment contains a different number of gaps therefore the process of obtaining the position of the beginning and end of the domains had to be repeated after every alignment. After obtaining the position values, “cut” command in tsh Command Line Tool removed the headers from the alignments and cut the two domains based on the positioning in the reference structure.
Table 2. Reference protein structures
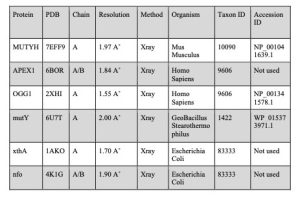
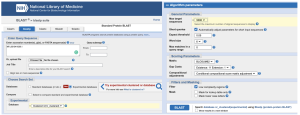
Figure 19. NCBI BLASTP search tool. Left: inputting the desired protein accession ID as indicated in Table 2 into the search tool and choosing Experimental Database as the search database. Right: Adjusting the Algorithm Parameters to increase the value of Max target sequences and adding a filter to remove regions with Low Complexity.
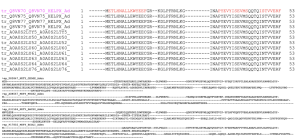
Figure 20. PROMALS3D alignment of MutY sequences across 100 species. Top: Color coded alignment – Representative sequence is color coded as magenta with all other sequences following the magenta being aligned according to the positioning of the representative sequence. Red color code represents alpha-helix secondary structures as shown and blue represents beta- strand, not shown. Bottom – Alignment visualized as the input FASTA format.
NCBI: Preparing the Species List, NTD, and CTD Files
During the conduction of the experiments, I had to find a quicker way to clean and prepare data lists for the MI calculator, therefore I wrote two sets of cleaning codes with the help of Dr. Martin Horvath that could clean and filter input files and alignments obtained using both UniProt and NCBI as databases. The codes were written using R studio and a summary and description of the codes can be seen in Appendices.
In order for the script to function properly, it is essential to download the correct files from the BLASTP results page. To create the species list, the “Cluster Table (csv)” file needs to be downloaded and the “Clusters (FASTA)” file needs to be obtained for input into PROMALS3D, as previously explained.
The script for creating the species list as well as the files prepared using the alignments use a mixture of commands provided by the packages: ggplot2, dplyr, readr, stringr, tidyverse, tidyr, and tibble. The base function of R Studio and its “readr” packages allowed the creation of the list of taxon ids from the “Clusters Table (csv)” file that was obtained from the BLASTP tool. The script is coded to first read the file into R using read.csv, and following by capturing the specific rows that obtain the taxon IDs conveniently located in the column titled “Taxid ” and sending them into a new data frame. The data frame is then renamed to “species”, to be recognized and read in the MI Calculator script. Additionally, the organism ID of the reference structure is added at the end of the species list using a base function of R Studio to match the total number of species to the total number of aligned sequences (See Appendix 1 and Appendix 2).
To run large numbers of aligned species in the MI calculator in a timely manner, it is necessary to reduce the number of gaps present between each sequence, as the MI calculation relies on the string-wise comparison of the two files provided. Part two of the script found in Appendix 3 shows the loop which was written to calculate the number of gaps in each substring position, as counted in a columnar fashion. This only retained substrings where only 20% of gaps were present. This was done by using the str_sub command available in the “stringr” package, which specifically analyzed and counted the occurrence of gaps as shown with the character “-” in the data displayed as a vector of characters.
Furthermore, str_locate and str_sub ,from the “stringr” package in R Studio, located and cut the beginning and ending positions of the NTD and CTD. The beginning and ending sequences of the two domains were found as previously explained in the UniProt Data preparation section (see Appendix 4).
Running the MI Calculator
Mutual information (MI) calculator that allowed these experiments was previously coded by Dr. Martin Horvath to calculate the rate of interaction by detecting patterns of change that co- exist in the two given variables, two proteins or two domains of protein. Given this algorithm to compare and match, MI returns an MI score for mutual interaction with patterns. Higher MI Score indicates that statistically significant interactions between the two variables exist.
The MI score is calculated by conducting two separate experiments for each data set, one of paired species which returns mutual interactions MI score, and one of unpaired or scrambled species. This results in the control experiment’s MI score. The graphs produced from these two experiments will be combined into a single histogram, the MI distribution graph, and the difference thereof will be the statistically significant and interesting mutual interactions between the two proteins that are not by random chance (Appendix 5). The point at which the scrambled
species MI score stops on the MI distribution graph is referred to as the MI cutoff. The MI cutoff has been used to observe where mutual interactions start and how the confidence interval, calculated as a Z-score, changes across different numbers of species. The plots have been made using the “ggplot2” package available in R, and calculations were conducted using a mixture of “tibble”, “readr”, “tidyr” and “tidyverse” packages. The R program encoding the MI Calculator is available upon request to martin.horvath@utah.edu.
Acknowledgements
I would like to acknowledge and thank my supervisor Dr. Martin P. Horvath for his continuous support and guidance throughout my Honors Thesis journey and for allowing this work to become possible. I would also like to thank Dr. Horvath for his patient encouragement as I learned the code writing process.
I am very appreciative of all the supervisors and professors who have guided me through the ups and downs of completing the Honors degree, especially Dr. Naina Phadnis and Dr. Virginia Solomon for their continuous patience and advice throughout my journey, and to Dr. Thomas Richmond and Dr. Holly Sebahar for opening endless doors of opportunities to help me continue with research despite difficulties.
I am also grateful to all Horvath Lab members for helping me understand the different aspects of MutY and MUTYH DNA repair mechanisms based on their respective knowledge and expertise. And I would especially like to thank Nicky Loyola for his awesome help with proofreading the thesis, and Harin Srinivasan for referring me to this amazing lab.
And last but not least, I would like to thank my family, my parents and my sister, who made great sacrifices to allow me to continue education and research in the University that I had only dreamt about for years. I would like to thank my family for their endless support and encouragement through my undergraduate years, for helping me take long steps towards my goal, and for staying awake with me the nights that I had to stay awake to study.
This work was supported by the National Science Foundation Award 1905249.
Bibliography
Avery, O. T., C. M. Macleod, and M. McCarty. 1994. “Studies on the Chemical Nature of the Substance Inducing Transformation of Pneumococcal Types : Induction of Transformation by a Desoxyribonucleic Acid Fraction Isolated From Pneumococcus Type III.” The Journal of Experimental Medicine 79 (2): 137-58. https://doi.org/10.1084/jem.79.2.137.
Banda, Douglas M., Nicole N. Nuñez, Michael A. Burnside, Katie M. Bradshaw, and Sheila S. David. 2017. “Repair of 8-OxoG:A Mismatches by the MUTYH Glycosylase: Mechanism, Metals and Medicine.” Free Radical Biology and Medicine 107 (June): 202– 15. https://doi.org/10.1016/j.freeradbiomed.2017.01.008.
Bhardwaj, Amit, Sadhu Leelavathi, Sudeshna Mazumdar-Leighton, Amit Ghosh, Suryanarayanarao Ramakumar, and Vanga S. Reddy. 2010. “The Critical Role of N- and C-Terminal Contact in Protein Stability and Folding of a Family 10 Xylanase under Extreme Conditions.” PLoS ONE 5 (6): e11347. https://doi.org/10.1371/journal.pone.0011347.
“EDirect_EUtils_API_Cookbook.” (2016) 2022. NCBI-Hackathons (Archive). https://github.com/NCBI-Hackathons/EDirectCookbook.
Gauthier, Jeff, Antony T. Vincent, Steve J. Charette, and Nicolas Derome. 2019. “A Brief History of Bioinformatics.” Briefings in Bioinformatics 20 (6): 1981–96. https://doi.org/10.1093/bib/bby063.
Hershey, A. D., and Martha Chase. 1952. “Independent Functions of Viral Protein and Nucleic Acid in Growth of Bacteriophage.” The Journal of General Physiology 36 (1): 39-56.
Kans, Jonathan. 2022. Entrez Direct: E-Utilities on the Unix Command Line. Entrez Programming Utilities Help [Internet]. National Center for Biotechnology Information (US). https://www.ncbi.nlm.nih.gov/books/NBK179288/.
Kinney, Justin B., and Gurinder S. Atwal. 2014. “Equitability, Mutual Information, and the Maximal Information Coefficient.” Proceedings of the National Academy of Sciences of the United States of America 111 (9): 3354–59. https://doi.org/10.1073/pnas.1309933111.
Little, Daniel Y., and Lu Chen. 2009. “Identification of Coevolving Residues and Coevolution Potentials Emphasizing Structure, Bond Formation and Catalytic Coordination in Protein Evolution.” PloS One 4 (3): e4762. https://doi.org/10.1371/journal.pone.0004762.
Maxam, A. M., and W. Gilbert. 1977. “A New Method for Sequencing DNA.” Proceedings of the National Academy of Sciences of the United States of America 74 (2): 560–64. https://doi.org/10.1073/pnas.74.2.560.
Nuñez, Nicole N., Cindy Khuu, C. Satheesan Babu, Steve J. Bertolani, Anisha N. Rajavel, Jensen E. Spear, Jeremy A. Armas, et al. 2018. “The Zinc Linchpin Motif in the DNA Repair Glycosylase MUTYH: Identifying the Zn2+ Ligands and Roles in Damage Recognition and Repair.” Journal of the American Chemical Society 140 (41): 13260–71. https://doi.org/10.1021/jacs.8b06923.
Pei, Jimin, and Nick V. Grishin. 2014. “PROMALS3D: Multiple Protein Sequence Alignment Enhanced with Evolutionary and 3-Dimensional Structural Information.” Methods in Molecular Biology (Clifton, N.J.) 1079: 263–71. https://doi.org/10.1007/978-1-62703- 646-7_17.
Pettersen, Eric F., Thomas D. Goddard, Conrad C. Huang, Elaine C. Meng, Gregory S. Couch, Tristan I. Croll, John H. Morris, and Thomas E. Ferrin. 2021. “UCSF ChimeraX: Structure Visualization for Researchers, Educators, and Developers.” Protein Science: A
Publication of the Protein Society 30 (1): 70–82. https://doi.org/10.1002/pro.3943. Russelburg, L. Peyton, Valerie L. O’Shea Murray, Merve Demir, Kyle R. Knutsen, Sonia L.
Sehgal, Sheng Cao, Sheila S. David, and Martin P. Horvath. 2019. “Structural Basis for Finding OG Lesions and Avoiding Undamaged G by the DNA Glycosylase MutY.” ACS Chemical Biology, December. https://doi.org/10.1021/acschembio.9b00639.
Sanger, F., S. Nicklen, and A. R. Coulson. 1977. “DNA Sequencing with Chain-Terminating Inhibitors.” Proceedings of the National Academy of Sciences of the United States of America 74 (12): 5463–67. https://doi.org/10.1073/pnas.74.12.5463.
Sayers, Eric. 2021. The E-Utilities In-Depth: Parameters, Syntax and More. Entrez Programming Utilities Help [Internet]. National Center for Biotechnology Information (US). https://www.ncbi.nlm.nih.gov/books/NBK25499/.
Smith, Kent. 2013. A Brief History of NCBI’s Formation and Growth. The NCBI Handbook [Internet]. 2nd Edition. National Center for Biotechnology Information (US). https://www.ncbi.nlm.nih.gov/books/NBK148949/.
Smith, Kent A. 2008. “Laws, Leaders, and Legends of the Modern National Library of Medicine.” Journal of the Medical Library Association: JMLA 96 (2): 121–33. https://doi.org/10.3163/1536-5050.96.2.121.
Tominaga, Yohei, Yasuhiro Ushijima, Daisuke Tsuchimoto, Masaki Mishima, Masahiro Shirakawa, Seiki Hirano, Kunihiko Sakumi, and Yusaku Nakabeppu. 2004. “MUTYH Prevents OGG1 or APEX1 from Inappropriately Processing Its Substrate or Reaction Product with Its C-Terminal Domain.” Nucleic Acids Research 32 (10): 3198–3211. https://doi.org/10.1093/nar/gkh642.
Trasviña-Arenas, C. H., Merve Demir, Wen-Jen Lin, and Sheila S. David. 2021. “Structure, Function and Evolution of the Helix-Hairpin-Helix DNA Glycosylase Superfamily: Piecing Together the Evolutionary Puzzle of DNA Base Damage Repair Mechanisms.” DNA Repair 108 (December): 103231. https://doi.org/10.1016/j.dnarep.2021.103231.
UniProt Consortium. 2007. “The Universal Protein Resource (UniProt).” Nucleic Acids Research 35 (Database issue): D193-197. https://doi.org/10.1093/nar/gkl929.
Watson, J. D., and F. H. C. Crick. 1953. “Molecular Structure of Nucleic Acids: A Structure for Deoxyribose Nucleic Acid.” Nature 171 (4356): 737–38. https://doi.org/10.1038/171737a0.
Wheeler, David, and Medha Bhagwat. 2007. BLAST QuickStart. Comparative Genomics: Volumes 1 and 2. Humana Press. https://www.ncbi.nlm.nih.gov/books/NBK1734/.
Woods, Ryan D., Valerie L. O’Shea, Aurea Chu, Sheng Cao, Jody L. Richards, Martin P. Horvath, and Sheila S. David. 2016. “Structure and Stereochemistry of the Base Excision Repair Glycosylase MutY Reveal a Mechanism Similar to Retaining Glycosidases.” Nucleic Acids Research 44 (2): 801–10. https://doi.org/10.1093/nar/gkv1469.
Yeang, Chen-Hsiang, and David Haussler. 2007. “Detecting Coevolution in and among Protein Domains.” PLOS Computational Biology 3 (11): e211. https://doi.org/10.1371/journal.pcbi.0030211.
APPENDIX
1: UniProt: Creating the species list and removing gaps
#Read the input file that was downloaded from UniProt into R
x <- read.delim("MutY_251_input.fasta", header = FALSE,
stringsAsFactors = FALSE)
#Turning the data frame into a vector value
x.new <- x$V1
#To grab just the headers, indicated by character ">"
x.new <- x.new[grepl(pattern = ">", x = x.new , fixed = TRUE)]
#locate and extract all words (or continuous string of
characters) that contain OX
B <- data.frame(str_extract_all(x.new, "(?<=\\b)OX[^\\s]+"))
#Switch Rows and Columns and rename column
OX <- data.frame(data.frame(t(B)))
colnames(OX) <- "X1"
#Turning data frame into vector
Taxid <- OX$X1
#grab only the numbers from the OX value list, rename column,
and write out.
Species <- data.frame(parse_number(Taxid))
colnames(Species) <- "species"
Species[(nrow(Species)+1), "species"] <- 1422 # Where 9606 is
homo sapien taxon id. Change as needed
#Write out the species list.
write.table(Species, file = "MutY_251_OX.species", row.names =
FALSE, col.names = TRUE, quote = FALSE)
#Read the alignment file obtained from Promals3D into R and
remove headers.
promals3D_alignment <-
read.delim("protein_promals3D_alignment.fasta", header =FALSE,
stringsAsFactors = FALSE)
Alignment <- data.frame("alignment" = character())
indexT <- as.integer(2)
while (indexT <= nrow(promals3D_alignment)) {
Alignment[indexT/2, "alignment"] <- promals3D_alignment[indexT,
"V1"] # such that headers are located on every other line so to
remove headers every other line needs to be removed.
 indexT <- 2 + indexT
} #Removing header and building aligned sequences.
#Write out the new file of alignment without the headers
colnames(Alignment) <- "proteinA" # adding Column headers as
readable in R
write.table(Alignment, file = "MutY_251.promals3D", row.names =
FALSE, col.names = true, quote = FALSE)
2: NCBI: Creating the Species List
#Extract rows 1-250 (for 250 species) where species' taxon id
information is located in a column with heading taxid. Example
shown for MUTYH protein.
#Replace the column heading from "taxid" to "species".
x <- read.csv("MUTYH_250_info.csv")
species.A <- data.frame(x[1:250, "Taxid"])
colnames(species.A)
colnames(species.A) <- "species"
#check that the column heading has been changed successfully.
colnames(species.A)
#Add the reference structure’s taxon ID at the end of the
species list.
species.A[(nrow(species.A)+1), "species"] <- 10090 # Where 10090
is mus musculus taxon id
#Write the file out.
write.table(species.A, file = "proteinA_OX.species", row.names =
FALSE, col.names = TRUE, quote = FALSE)
3: Removing Gap Rich Columns from the Alignment Files
## Recognize gaps in the data, remove columns where more than
80% is gap
indexA <- as.integer(1)
NewDashCount <- data.frame("DashCount"= numeric(), "keep"=
logical(), "position" = as.integer())
while (indexA <= str_length(Alignment[1,"alignment"])) {
 temp <- str_sub(Alignment[, "alignment"], indexA, indexA )
 NewDashCount[indexA, "DashCount"] <- sum(str_count(temp, "-"))
 if(NewDashCount[indexA, "DashCount"] < 50){ #where 50 is 20% of
250. Change as needed
  NewDashCount[indexA, "keep"] <- TRUE
} # counting dashes and removing brackets more than 80% dash
 if(NewDashCount[indexA, "DashCount"] >= 50){ #where 50 is 20%
of 250. Change as needed
  NewDashCount[indexA, "keep"] <- FALSE
 } # counting dashes and removing brackets more than 80% dash
(or retaining regions with only 20% gap)
 NewDashCount[indexA, "position"] <- indexA
 indexA <- 1 + indexA
} #removing gap rich columns
#
#Create a file with the position in the string that columns
should be kept
KeepColumns <- data.frame(NewDashCount[NewDashCount$keep, ])
#Create a loop where the strings in the position above come
together in the new file as a new set of strings.
NewAlignment <- data.frame("alignment" = character())
NewAlignment[1:nrow(Alignment), "alignment"] <- ""
indexB <- as.integer(1)
while (indexB <= nrow(NewDashCount)){
 if(NewDashCount[indexB, "keep"]) {
  NewAlignment[ ,"alignment"] <-
str_c(NewAlignment[ ,"alignment"],
str_sub(Alignment[ ,"alignment"], indexB, indexB))
 } #if we are keeping this column indexed by indexB because it
was flagged with "keep" <- TRUE
 indexB <- 1 + indexB
}
### Save the file
colnames(NewAlignment) <- "proteinA" #use proteinA or B as
needed
write.table(NewAlignment, file = "MutY_251.promals3D", row.names
= F, col.names = T, quote = F) #change title.
4: Example of cutting the NTD of MUTYH
#Observe the new alignment with the gaps removed and verify the
presence of the starting and ending residues of the domain
TempAlignment <- NewAlignment[ ,"alignment"]
#Write out the New Alignment file and make sure that the last
sequence is the structure sequence
write.table(NewAlignment[, "alignment"], file =
"MUTYH_250.promals3D", row.names = FALSE, quote = FALSE,
col.names = FALSE)
#Extract the last line of the alignment into a new file. The
last line is the structure sequence.
LastLine <- tail(TempAlignment, n=1)
#Find the sub_string position of QASVS and GVANF
str_locate(LastLine, "QASVS") #Replace QASVS with starting
sequence of domain A
str_locate(LastLine, "GVANF") #Replace GVANF with ending
sequence of domain A
#Cut the NTD from the beginning of the string to the L of VAEEL
position.
MUTYH_NTD <- data.frame(str_sub(TempAlignment, 1 , 214)) #Change
1 and 214 as indicated values from steps above
colnames(MUTYH_NTD) <- "proteinA"
# Write out the NTD domain sequences into a new file.
write.table(MUTYH_NTD, file = "MUTYH_250_NTD.promals3D",
row.names = FALSE, quote = FALSE)
5: MI Calculator
Codes for the MI Calculator in the R program are available upon
request to martin.horvath@utah.edu.
