College of Engineering
15 Development of a Utah Optrode Array for Large Scale Optogenetics in Non-Human Primate Cortex: Analysis of Spatial Excitation Pattern Using C-FOS Expression
Alexander Ingold (University of Utah); Alessandra Angelucci (School of Biological Sciences, University of Utah); Andrew Clark (University of Utah); Justin Balsor (University of Utah); Frederick Federer (University of Utah); Christopher F. Reiche (University of Utah); and Steve Blair (University of Utah)
Faculty Mentor: Alessandra Angelucci (Biomedical Engineering, University of Utah)
Abstract
A central goal in neuroscience is to understand how neural circuits generate the computations that underlie neuronal responses, sensory perception, and behavior. This requires manipulating their activity and determining the results of these manipulations. Optogenetics is a versatile laboratory technique that uses light to manipulate the activity of genetically modified neurons to express exogenous light-sensitive opsin proteins. Optogenetics allows control of neurons on a millisecond time scale and targets specific types of neurons. An optrode, or optical electrode, is a device capable of delivering light to the deep layers of the cerebral cortex that cannot be reached by surface illumination alone. The Utah Optrode Array (UOA) is a waveguide array intended to conduct light to deep cortical layers over a large volume of cortical tissue. Developed by the Blair/Angelucci team at the University of Utah, the UOA is a 4 x 4 mm square array, with one hundred, spike-shaped, glass shanks that pierce below the cortical surface. Here, we have tested UOAs in non-human primate (NHP) cortex to determine the efficiency of the UOA in delivering optical signals to deep tissue, and the spatial distribution of the neural excitation obtained via optical stimulation through the array. To this purpose, we have used C-fos expression. C-fos is a marker protein that provides an indirect measure of the spatial pattern of neural activation in the brain after immunohistochemical processing. This thesis presents the c-fos related portion of a larger paper incorporating electrophysiological testing data [1]. Our aim in this thesis was to use this protein marker to determine the excitation of neurons induced after using the UOA in macaque monkeys. We found broad- ranging c-fos expression across the visual cortex after UOA stimulation. A Glutamate Block, which prevents synaptic transmission, reduced c-fos expression to the neurons directly underneath the UOA. Our results indicate the UOA is an effective tool for optogenetically stimulating a large area of neurons across all cortical layers.
Introduction
Optogenetics is a powerful experimental technique that can be used to answer questions about anatomy, physiology, and behavior of neural circuits. It has potential to treat a broad range of diseases such as spinal cord injury [2], multiple sclerosis [3], Alzheimer’s disease [4], Parkinson’s disease [5], epilepsy [6], and retinitis pigmentosa [7]. Optogenetic techniques are based on the use of light to control the activity of neurons that are genetically modified to express exogenous light-sensitive opsin proteins. The expression of these opsins (light-gated ion channels) in the cells is induced through a viral vector or other gene insertion method. Experimentally manipulating neurons expressing opsins provides many advantages over traditional techniques used in neuroscience. Conventional techniques such as electrical or pharmacological neural manipulation lack cell-type specificity and time precision (acting on a time scale of minutes or hours, while neurons act on a time scale of milliseconds). Optogenetics can be used to excite or inhibit neurons on a millisecond time scale, and it can target specific types of neurons by taking advantage of genetic engineering techniques like viral vector-delivered transgenes [8].
Transgenic mice are easy to generate, but it is more difficult to source transgenic non-human primates (NHPs). Extending optogenetics to non-genetically tractable model species such as NHPs is crucial due to their similarities to human laminar and columnar cortical geometry. NHP studies bring optogenetic technology closer to therapeutic use in humans.
One limitation of optogenetic manipulation of neurons is the inability to target the deep layers of the cortex (about 1.5-2 mm from the surface), because light shone on the cortical surface cannot penetrate deep in brain tissue. However, there is a scientific need
for researchers to be able to manipulate neural circuits involving cells that do not reside in the light-accessible upper layers of the cortex. One solution to this is the use of an optrode. An optrode or optical electrode is a device capable of delivering light to the deep layers of the cortex [9]. Optogenetic experiments in NHP mainly use surface illumination or a penetrating probe consisting of a single optical fiber [2]. A single optrode can only photo activate a small subcortical volume; however, an array of many small diameter fibers could activate a larger subcortical volume. Activation of larger volumes is necessary in NHPs due to their large brain size; relatively large brain volumes must be optogenetically activated to observe measurable behavioral effects.
The Utah Optrode Array (UOA) [9] is a novel waveguide optrode array modeled after the Utah Electrode Array which has been an industry standard used for large scale electrical recording and stimulation of cortical tissue for over three decades [10]. The UOA is a 4×4 mm array with one hundred spike-shaped optrodes arranged in a 10×10 configuration with customizable length (up to 2.5 mm) and shank width (80-120 μm). This can be inserted directly into the cortex, thereby providing light via each of the 100 shanks to the deeper layers of the brain [11]. Here we have tested UOAs in cortical brain tissue of macaque monkeys to determine the efficacy of the UOA in delivering light to deep tissue, and the spatial distribution of the neural excitation obtained via array photo-stimulation.
A critical parameter is the spatial extent of the resulting stimulation, i.e., the width and depth of neuronal tissue that can be photoactivated via the UOA. This can be measured both in areas of the brain transfected with light gated ion channels and, in those without opsins as controls. One way to measure such photoactivation is using c-fos
immunohistochemical staining as a tool for determining the extent of neural activation. C- 2
fos is a growth factor protein that is rapidly produced in neurons when they are stressed or activated [12]. Due to the increase in expression levels of c-fos after neural activation, c- fos expression can be used as an indirect measure of the spatial pattern of neural activation in the brain post-mortem. Here we used immunohistochemical staining for the c-fos marker protein of neural excitation to determine the spatial excitation pattern induced by the UOA.
Background
A. Electrophysiology
In 1790 Galvani demonstrated electrical control of nerves. In his public demonstrations, he used electricity to make cadavers sit upright [13]. This inspired fictional works such as “Frankenstein” by Mary Shelley. Electricity causes an action potential by delivering electrical charge to the extracellular space around neurons. This opens the ion channels gated by electric potential which are key in the propagation of the action potential.
Electrical stimulation was applied to the field of visual neuroscience in 1929 by Otfrid Foerster. He found that electrical stimulation of the visual cortex can produce visible points of light in the visual field called phosphenes. Scientists hypothesized that many precisely placed electrodes could be used to create a visual prosthesis [14].
In 2021, Richard Normann from the University of Utah, and Eduardo Fernández from Miguel Hernandez University operated on Berna Gómez a former science teacher who has been blind for 16 years. A 10×10 Utah Electrode Array (UOA) was inserted in her visual cortex for six months providing the ability to see the outlines of objects and doorways. Berna Gómez could even read brail visually. The effectiveness of this visual prosthetic was limited by the number of electrodes and the algorithms controlling the stimulation pattern of the electrodes [15]. The development of algorithms is difficult because it requires the patient to communicate the visual results of each trial to the researcher. A system of many electrodes simultaneously stimulating and recording may be able to avoid the need for the patient to describe the phosphenes they are seeing [15].
Electrode array technology is progressing rapidly with advances in microelectronics. Modern electrode arrays provide large amounts of data through many probes to act as a brain computer interface. The Neuropixel® 2.0 is a commonly used probe with up to 6,000 recording sites on one side of a long thin spike. This updated Neuropixel® is a significant advancement over the Neuropixel® 1.0 which was released in 2016 and is used in over 400 labs [16]. Neuralink® is another advanced brain computer interface in development. This interface consists of at least 32 tiny linear arrays with 32 electrodes each robotically placed to avoid blood vessles [17]. Neuralink® reduces damage to the brain and reduces the brain’s foreign body response. There is a huge amount of innovation in the field of brain computer interfaces, but there are also many problems that still need to be solved before they can be clinically viable.
The foreign body response is a major challenge for long term implanted devices, especially for implants in the central nervous system. The foreign body response is a series of reactions that protect the body from macroscopic exogenous objects such as brain probes. After implantation, antibodies and other proteins adsorb to the surface of the foreign body. Next, macrophages are attracted to the site to break down or encapsulate the foreign body. The macrophages fuse to form a mass of multinucleated giant cells and fibroblasts produce a fibrous encapsulation of the foreign body. The foreign body response is rapid in the central nervous system [18]. It degrades the performance of electrodes by displacing the neurons near the device increasing the current required for stimulation and increasing the noise in recordings [18].
B. Optogenetics History
The history of optogenetics begins in the early 1800’s when scientists noticed that a single-celled green algae called Chlamydomonas quickly responds to flashes of light [19]. These algae contain proteins that perform cellular functions when exposed to light. Bacteriorhodopsin was one of the first opsin proteins to be isolated. It was isolated in 1970 from the cell membrane of halobacterium. Bacteriorhodopsin is a light activated proton pump which is not useful for manipulating neurons [19].
In 2003 Channelrhodopsin-2 (ChR2) was discovered [20] following the discovery of the proton pump Channelrhodopsin-1 [21]. ChR2 is a light-gated ion channel which can be used to manipulate neurons in animals. Unlike bacteriorhodopsin, this pump transmits cations which can be used to trigger action potentials in neurons. ChR2 is a commonly used protein in optogenetics [20], [22]–[23]. It is the opsin used in the experiments presented in this thesis [1].
Halorhodopsin is a light-sensitive chloride pump discovered in 2007 [24]. It inhibits neurons by allowing the influx of chloride ions into the neurons. Neurons are hyperpolarizing when yellow light is shone on the cells. This discovery dramatically increased the capability of optogenetics. This allows for inhibitory and excitatory control of neurons using different colors of light [25].
Optogenetics is a very versatile method of stimulation. The method allows for high temporal precision with frequencies on the order of 100Hz [26]. It is possible to stimulate large areas of cortex by delivering light through a craniotomy or thinned skull. It is also possible to achieve single cell resolution of stimulation using a 2-photon microscope. Cells could be individually stimulated at a depth of 50 microns [27].
The first use of optogenetics to control the behavior of an animal was in 2005. Photo stimulation of the giant fiber system and dopaminergic neurons caused changes in behavior such as wing beating in drosophila (fruit flies) [28]. In 2014 mice were conditioned to avoid hiding in a dark den by using optogenetic techniques to silence dopaminergic neurons. Targeting dopaminergic neurons directly affects the reward systems in the brain. Behavior changes were observed within the first 5 minutes, and mice remained conditioned to stay in the bright portion of the cage for days after the stimulation [29].
C. Optogenetic Methods
Optogenetics requires genetic modification of cells. The two common methods of modification are the use of viral vectors or the generation of transgenic organisms (genetically modified before birth) [30]. This study uses viral vectors carrying genes for opsin protein expression; these are injected into the nervous tissue of interest and allowed to replicate and express their genes until transfection is complete. The type of virus injected determines the pattern of transfected cells. Anterograde vectors infect neurons in the same direction as the action potential (infecting the dendrites or cell body first), while retrograde vectors travel in the opposite direction (infecting the terminal axons first). Trans-synaptic vectors can cross synapses and move between cells.
The expression of optogenetic proteins is usually targeted to specific cell types using one of two methods. The first method is the use of a tissue or cell specific promoter preceding the gene that expresses the opsin protein [31]. The promoter will only initiate the viral gene transcription in the proper cellular environment. For example, CamKII is a promoter that is specific to excitatory neurons in the neocortex and hippocampus [31]. The gene encoding an optogenetic protein is expressed in the cells that recognize the promoter. Another method for targeting a specific cell type is the use of a transgenic organism with Cre recombinase. Cre is an enzyme that can excise or flip the direction of a sequence of DNA between two lox-P sequences [32]. This mechanism can be used to activate a gene encoding an optogenetic protein. A transgenic organism with Cre expressed only in the cells of interest allows targeting optogenetic protein expression to the cells of interest [32].
D. Clinical Applications
Optogenetics has been challenging to apply clinically because it is invasive. For example, some viral vectors can be toxic to the brain causing necrosis of transfected cells. The process of injection can also cause cell death. Optogenetics also requires a method for light delivery which may require a transcranial implant such as an optical fiber or a full implanted light-delivery device.
Optogenetics has been used to treat spinal cord injury. Stimulation of the spinal cord can restore function by bridging over the injured area. It has additional benefits of triggering cellular regeneration mechanisms, increasing neuroplasticity, and promoting myelination of axons [3]. Optogenetics was used to restore respiratory function in rats following a cervical spinal injury. The phrenic nerve was stimulated restoring respiration and EMG signals on the lesioned side to a level that matched the control side [2].
Optogenetics could be used to treat Multiple Sclerosis (MS), an inflammatory demyelination disease leading to muscle weakness and coordination problems. It is possible to treat MS with neural stimulation which leads to an increase in myelination [3]. This can be done with electrical or optogenetic stimulation. Electrical stimulation may cause more side effects than optogenetic stimulation because it lacks the cell-type specificity allowed by optogenetics. Stimulation of the premotor cortex with ChR2 in mice resulted in increased myelination and neural activity [3]. This proof-of-concept study shows promise for treating MS with optogenetics.
Optogenetics could be used to treat Alzheimer’s disease (AD). AD results in cognitive decline and is characterized by the build-up of beta-amyloid plaques and neurofibrillary tangles in the brain. It is uncertain whether amnesia caused by AD is linked to the decline of memory storage or memory retrieval. A transgenic mouse model of early AD has been generated, in which mice overexpressed presinillin-1 and an amyloid precursor protein. Optogenetic stimulation of hippocampal memory engram cells in this mouse model resulted in increased memory recall over the control cases. Stimulation caused mice to elicit a previously conditioned response of freezing in response to a blue light. Mice without stimulation did not freeze due to their memory impairment. Additionally, stimulation restored dendritic spine density in the dentate gyrus to control levels [4].
Optogenetics could be used to treat Parkinson’s disease (PD). PD is characterized by the degeneration of dopaminergic neurons and results in tremors, loss of coordination, and a shuffling gait. PD can be treated pharmacologically or with deep brain stimulation for cases where pharmacological treatment is ineffective. Deep brain stimulation is an invasive surgery that involves inserting electrodes into deep brain nuclei. Researchers used optogenetics, electrophysiology, and computer modeling to determine that deep brain stimulation causes increased activation of cortical somatostatin neurons, the inhibition of parvalbumin neurons, and the reduction of hyperactivity in pyramidal cells in mice. It is hypothesized that the targeted optogenetic activation of cortical somatostatin neurons may be a less invasive alternative to deep brain stimulation [5].
Optogenetics could be used to treat epilepsy. Epilepsy is characterized by seizures caused by neuron hyperexcitability. It can be treated pharmacologically or with electrical stimulation. Pharmacological approaches often have side effects because the medications are designed to suppress neurological activity. This can lead to brain fog, drowsiness, and nausea. Some patients do not respond to medication at all, leading physicians to try electrical stimulation. The responsive neurostimulation system for epilepsy (RNS® System) is a device in clinical use. It monitors neurons to predict epileptic seizures using an implanted electrode array. It then delivers electrical stimulation to prevent the seizure. The average decrease in seizures was 67% after 1 year, 75% at 2 years, and up to 82% after 3 or more years of using RNS in human [33]. Optogenetic stimulation could be a more effective way of preventing seizures because an inhibitory opsin protein can be used. The use of the inhibitory opsin protein halorhodopsin at the epileptic focus was shown to suppress seizures and reduce the likelihood of future seizures in mouse [8].
Optogenetics could be used to treat retinal diseases. There is a large amount of research in expressing optogenetic proteins in retinal ganglion cells to restore light sensitivity in the retina. In 2021 a case of retinitis pigmentosa was treated using an intraocular injection of a virus encoding ChrimsonR, an excitatory opsin protein. Goggles detect local changes in light intensity and project real time light pulses onto the retina. This is the first case of partial recovery after optogenetic therapy [7].
A limitation with the current generation of optogenetic proteins preventing clinical use is a lack of light sensitivity. Most experiments require high powered lasers to generate threshold level stimulation. It would be ideal if future opsin proteins are sensitive enough to restore retinal function using natural light rather than goggles. Red-shifted variants of opsin proteins can be more sensitive because they require lower energy light [34]. Another goal for future optogenetic protein variants is a faster firing rate. The ChETA light gated ion channel developed in 2010 can depolarize at up to 200Hz [35].
E. C-fos Overview
C-fos is a proto-oncogene that encodes the protein for a nuclear phosphoprotein. It is a growth factor that is produced after a cell undergoes a variety of stresses. Neurons express c-fos when they have an increased rate of action potentials or if they are physically or chemically stressed [36]. Quantifying c-fos expression using immunohistochemistry can be used to indirectly measure the spatial pattern of neural activation in the brain post- mortem. This is due to the increase in expression levels of c-fos after neural activation. The neural activation can come from a wide range of stimuli such as electrical manipulation, optical manipulation, physical perturbation of the brain, water stress, fear, odors, injected seizure-inducing agents, or even vocalizations of the same species [36]–[40]
Neurons under the optrode array will be directly optogenetically stimulated or indirectly stimulated via synaptic transmission from optogenetically activated neurons. Glutamate is the most common excitatory neural transmitter in the central nervous system. To differentiate direct from indirect activation, in our study we used a Glutamate Block drug to block neural transmission and indirect neural activation. The drug, NBQX, is a selective competitive agonist for the AMPA glutamate receptor. Blocking the AMPA receptor can significantly reduce the transmission of signals between neurons. This reduces secondary neural excitation or the excitation of secondary neurons by primary neurons that are directly stimulated [41].
A key consideration for designing an experiment using c-fos is that it has a definite refractory period or delayed peak expression. The temporal expression pattern of c-fos after a stimulus has a peak of 1.5 hours after the initial stimulation and has an expression tail that lasts around 12 hours [36]. For this reason, it is important to sacrifice the animal 1.5 hours after stimulation. Since we are working in the visual and supplementary motor (SMA) cortex, it is also important to close the eyes and avoid touching the subject for 12 hours before sacrificing the animal. This minimizes unintended stimulation not caused by the optrode insertion or light stimulation.
The distribution of c-fos expression is visualized post-mortem with immunohistochemical (IHC) staining of the thinly sectioned brain with an antibody against the c-fos protein. The IHC stain (c-fos+ cells) is analyzed by manually counting the cell bodies and empirically determining the distribution pattern of the cells with respect to the stimulation site.
A. General Overview
Methods
A virus containing genetic instructions encoding for the channelrhodopsin protein was injected into the cortex (Fig. 1). Two weeks later the Utah Optrode Array (UOA) was inserted. A laser was aimed at the back of the array to stimulate the cortex. After the c-fos refractory period of 90 minutes, the animal was sacrificed and perfused. The brain was sectioned, immunostained for c-fos, counterstained for Nissl (to reveal cortical layers), and imaged. The distribution of c-fos was analyzed with manual cell counting.
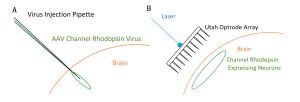
Fig. 1 (A) Diagram of channelrhodopsin injection. In 3 cases, channelrhodopsin was injected into the cortex through a craniotomy, and left for 2 weeks to allow for suitable expression. (B) Diagram of optrode insertion. A Utah Optrode Array was inserted through the craniotomy into the cortex over the area containing the channelrhodopsin-expressing neurons.
13
B. Design
Optrodes were tested in four experimental conditions in three macaques (Macaca Fascicularis) (see Table 1). All procedures involving animals were approved by the Institutional Animal Care and Use Committee of the University of Utah and conformed to the guidelines set forth by the USDA and NIH. One animal had one of two different experimental conditions performed separately in each brain hemisphere. Case 1 was a UOA with channelrhodopsin transfection, UOA insertion, and laser stimulation in visual cortex. In Case 2, a Glutamate Block of NBQX was applied before UOA insertion over channelrhodopsin transfected SMA cortex and followed by laser stimulation. In case 3, a UOA was inserted into SMA cortex (not expressing any opsins) as a control, to determine whether UOA Insertion-only (with no light stimulation) causes c-fos expression. Case 4 was another control case which received Light-only stimulation of the SMA cortex (not expressing opsins) with no UOA inserted in cortex.
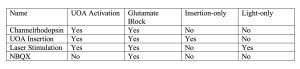
Table 1: Organization of the four experimental cases.
C. First Surgery for viral injections
Surgery for the transfection of channelrhodopsin was performed in the UOA Activation and Glutamate Block cases. Animals were pre-anesthetized with ketamine (10 mg/kg, intramuscular). An intravenous (i.v.) catheter was inserted, and the animals were intubated with an endotracheal tube, placed in a stereotaxic apparatus, and artificially ventilated. Anesthesia was maintained with isoflurane (1–2.5%) in 100% oxygen, and end- tidal CO2, blood oxygenation level, electrocardiogram, and body temperature were monitored continuously. I.V. fluids were delivered at a rate of 5 ml/kg-hr. The scalp was incised, a large craniotomy and durotomy was made to expose the lunate sulcus, area V2 and parts of V1, or a similar sized craniotomy over SMA cortex. On completion of the craniotomy, isoflurane was turned off and anesthesia was maintained with sufentanil citrate (5–10 μg/kg/h, i.v.).
We injected a 1:1 viral mixture of AAV9.CamKII.4.Cre.SV40 and AAV9.CAG.Flex.ChR2.tdTomato (Addgene Catalog #s:657 105558, and 18917, respectively). This is an anterograde vector which leads to nearly no retrograde expression [42]. Injections were performed using a picospritzer (World Precision Instruments, FL., USA) and glass pipettes with 35-45 μm tip diameter slowly at around 15 nL/min. The mixture was pressure injected; 250-350 nL at 2-3 cortical depths between 0.5 and 1.5 mm from the surface. Two boluses were delivered at 1.1 mm deep and two were delivered at 0.6 mm deep. The pipette was left in the brain after injection 5-10 min to prevent backflow while retracting. Five to six injections of viral mixture made 1.5-2 mm apart each with 500- 750 nL in each injection.
On completion of the injections in the appropriate brain area, a synthetic silicone- based film serving as an artificial dura was placed on the cortex. The native dura was sutured over the artificial dura. The craniotomy was filled with surgical gelfoam and sealed with a piece of sterilized parafilm and dental acrylic. The skin was sutured, and the animal was recovered from anesthesia.
D. Terminal Surgery for optogenetic stimulation
About 5-10 weeks post-injection, the animal was prepared for a second surgical procedure and anesthetized with isoflurane as described above. First, the eyes of the animals were closed for 12-14 hours to ensure baseline c-fos levels. In two of the three animals, craniotomies and durotomies were made over the SMA cortex. The scalp was re- incised at the same site as the prior incision, and the artificial dura was removed. Gelfoam was used to protect the cortex and keep it moist. In one case, a Glutamate Block drug (NBQX, 5mM) (Tocris BioSciences, Minneapolis, NM) was applied by soaking a piece of gelfoam with 1mL of NBQX and adding around 0.2 mL every 15 min to ensure saturation. The NBQX soaked gelfoam was applied to the site expressing ChR2 for 90 min. UOAs were inserted into the brain using a pneumatic hammer (Blackrock Microsystems, Salt Lake City, UT, USA) at 20-30 psi with a 1 mm-long inserter. This resulted in partial insertion, so the UOA was gently pushed down to complete insertion. A hole slightly smaller than the optrode was cut in blackened artificial dura. The black artificial dura was positioned with the hole over the UOA to prevent laser light spillover and limit all stimulation to light coming out the tips of optrode shanks.
A 473 nm benchtop laser (400 μm multimode optic fiber, ThorLabs Newton, NJ; laser: Laserwave, Beijing, China) was used to stimulate the optrodes with a measured 38 mW output with 15-19 mW/mm2. A collimating lens (ThorLabs, Newton, NJ) restricted the spot size to about 1.5 mm in diameter. The estimated threshold of ChR2 is 1 mW/mm2. The optrodes were stimulated in two places on the optrode twice for 2.5 min at 50Hz and twice 2.5 min at 20Hz with a 2.5 min break between stimulations. The laser was moved between stimulation to alternate between the two positions on the optrode. The laser pulse duration was 10 ms with 10 ms or 40 ms between pulses. The optrode was stimulated for a total of 10 mins. The light-only control was stimulated for the full 10 min in one location. After stimulation, the craniotomies were again covered with sterilized parafilm and dental acrylic. The animal was sacrificed 90 min. after the end of stimulation using Beuthanasia (0.22 ml/kg, i.v.) and perfused transcardially with saline for 2–3 min to clear the brain of blood, followed by 4% paraformaldehyde (PFA) in 0.1M phosphate buffer for 20 min to fix the brain.
E. Histology
The brain was postfixed overnight in 4% PFA. It was stored in cryoprotectant at – 20° C until ready for sectioning. The brain was cut into a block to isolate the visual cortex or SMA cortex. The blocks were immersed in 30% sucrose for cryoprotection until they became saturated and sunk, then sectioned in the sagittal direction on a freezing microtome at 40 microns thick. All cases were cut sagitally (the plane separating the left and right sides of the body).
Sections were rinsed then put in a blocking buffer of 2% normal donkey antiserum (AB_2337258; Jackson ImmunoResearch, PA, USA), 2% gelatin from cold water fish skin (Millipore Sigma, MA, USA), 1% Triton x-100 (Sigma Aldrich, MA, USA), phosphate buffer solution for two hours. The sections were moved to primary antibody overnight at room temperature (1:500 rabbit anti-c-fos ab190289; Abcam, MA, USA). Sections were then rinsed and put in near-infrared fluorescent protein linked to a secondary antibody for 2 hours (1:200 donkey anti-rabbit IgG-AF647; Jackson ImmunoResearch, PA, USA). Sections were rinsed and wet mounted on glass microscope slides.
Sections were stained for Nissl (1:100 Blue Fluorescent Nissl N21479; Thermo Fisher Scientific, MA, USA) to reveal the cortical layers by dripping the solution directly onto the tissue sections on the microscope slides. They were rinsed, blocked for 10 min, stained for Nissl for 20 min adding more dye every 5 min, blocked again for 10 min, rinsed, cover slipped, and double sealed with CoverGripTM coverslip sealant (Biodium, CA, USA).
F . Imaging
Imaging was performed on a Zeiss Axio Imager.Z2 fluorescent microscope using a 10X objective and an Axiocam 506 mono camera (Zeiss GmbH, Germany) with a Zeiss X-cite 120 LED Boost light source. Image files were created and analyzed using Zen 2.6 Blue Software (Zeiss, Germany). The light intensity was set to 100%, and the exposure time for each channel was kept the same between images. Images were collected in three channels simultaneously. One channel observed tdTomato fluorophore attached to the channelrhodopsin protein, and the second channel observed the Alexa Fluor 647 histologically attached to c-fos protein. The third channel observed the Nissl blue 435/455 stain of all neurons to reveal layers.
G. Analysis
Cells were counted manually in Neurolucida (MicroBrightField Bioscience, VT, USA) and analyzed in Neurolucida Explorer 2006. Regions of interest (ROIs) were drawn at 3 distances from the insertion site, each 200 microns wide and the full depth of the cortex. The first ROI was as close as possible to the center of the stimulation site and/or UOA insertion while avoiding damage caused by the UOA or injection pipette. The other two regions were 4,000 microns and 8,000 microns from the stimulation site. Five sections from each case were quantified for a total of 15 ROIs per case (5 sections x 3 ROI). The laminar distribution of c-fos was analyzed by tracing the layers visible in Nissl stain and calculating the number of cells within each layer using Neurolucida Explorer. Cell counts were plotted with error bars of 1 standard deviation using Excel (Microsoft) (Fig. 5) and the laminar distribution was displayed using a percentage stacked bar graph (Fig. 6). Other qualitative analysis is made through observation of images. Statistical analysis utilized a one-way ANOVA with post-hoc comparisons and Bonferroni correction to compare experimental and control cases as well as across distances.
II. Results
We analyzed patterns of c-fos expression using IHC in two control and two experimental hemispheres from 3 animals. In each case we counted the number of c-fos + cells in 3 ROIs located at the site of UOA insertion and/or light activation, and 4 and 8 mm away from it, respectively (see Methods).
Optogenetic activation of ChR2-expressing the primary visual area (V1) via the UOA (Fig. 2 A-D) in the experimental case revealed local and long-range c-fos expression extending far beyond the site of UOA insertion in V1, visible across all layers of V1 and extending to other areas including the secondary visual area (V2) and extra striate cortical areas known to receive inputs from V1 (Fig. 3). V1 shows a bright band of c-fos expression in layer 4C that terminates at the V1/V2 border, revealing this border. The injection leads to the expression of ChR2 light-gated ion channels and tdTomato fluorophore (the latter allows us to visualize the spread of the ChR2 expression at the injected site). The emission color of the tdTomato fluorophore, which is normally red, is displayed in green for purpose of illustration. This extensive pattern of c-fos+ cells in this case suggested c-fos expression was induced by both direct neural activation by light as well as indirect activation via synaptic activity.
To test this hypothesis and to determine the extent of neural activation directly induced by UOA photostimulation, we blocked glutamate transmission by applying the AMPA receptor antagonist NBQX to the cortex expressing ChR2, prior to UOA insertion and photostimulation (Fig. 2E-H). This blocks indirect neural activation, thus revealing the neurons directly stimulated by the UOA. The Glutamate Block reveals neural excitation and c-fos expression localized to the volume of cortex underneath the UOA. In this case, we found reduced c-fos expression by 5-fold in the area of UOA stimulation, and by 200- fold at distances of 4,000 and 8,000 microns (Fig. 2E-H, 4).
The control with UOA Insertion-Only (Fig. 2I, 4) showed localized c-fos expression at the site of insertion and tissue damage from the optrode array spikes. This case did not receive ChR2 injection or photo stimulation. The animal was sacrificed 4 hours after UOA insertion in SMA cortex. The image shows the c-fos stain alone, to best demonstrate the optrode spike damage. The UOA in this case was fully inserted with spikes extending to layer 5. UOA insertion-only and the Glutamate Block had similar levels of c- fos expression, but the insertion-only case had greater long-range expression suggesting that mechanical stimulation may cause trans-synaptic secondary neural activation.
The Light-Only control (Fig. 2K-L, 5), in which the fiber-coupled laser with a collimating lens was directed at non-opsin expressing SMA cortex, showed low levels of c-fos expression localized mostly to layer 1 within 1 mm of the stimulation site.
The blue Nissl stain labels the rough endoplasmic reticulum of every cell and is used to identify the cortical layers, allowing for determination of c-fos cell counts in each layer (Fig. 2A, 2E, 5). The laminar distribution of c-fos expression reveals a strong bias towards topical layer 1 cells in the Light-only case.
Statistical analysis (one-way ANOVA with pairwise comparisons and Bonferroni correction for multiple comparisons) revealed a significant difference in the number of c- fos+ cells at each distance between the UOA Activation experimental case and the Glutamate Block case (Glutamate Block; p<0.001, at all distances) as well as between UOA Activation experimental case and each of the control cases (Insertion-Only: p<0.001, at all distances; Light-Only: p<0.001, at all distances). There was no significant difference between the Glutamate Block and UOA-Insertion-only cases at any distance (p=1 at 0 mm, p=0.23 at 4 mm, and p=0.44 at 8 mm distance), but both cases differed significantly from the light-only case at 0mm distance (p<0.05 for all comparisons). Finally, the number of c-fos+ cells decreased significantly with distance for cases UOA Activation (p<0.001), Glutamate Block (p=0.001), and Insertion-only (p=0.003), but not for case Light-Only (p=0.079) (Fig. 4).
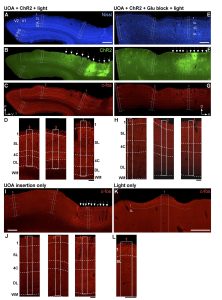
Fig 2. (A-C) Experimental Case.
The same sagittal section encompassing parts of V1 and V2 is shown under 3 different fluorescent illuminations, to reveal Nissl stain (A), tdT/Chr2 expression (B; the red tdT fluorescence was converted to green for purpose of illustration), and c-fos IHC (C). White solid contour: V1/V2 border; dashed contours: layer boundaries (layers are indicated); white boxes: ROIs (numbered 1-3 in panel C) where c-fos+ cells were counted. Asterisks in (B) mark the core of the viral injections, and sites of highest tdT/ChR2 expression. P: posterior; V: ventral. C-fos expression in this case is observed throughout all layers (local) and across cortical areas (long-range). Scale bar in (A): 1mm (valid for A-C). (B,F) White arrows indicate the visible damage caused by each UOA needle, while the gray arrow points to the likely location of one of the UOA needles which did not cause visible damage in this section. (D) Higher magnification of c-fos IHC in and around each ROI. Scale bar: 0.2mm. (E-H) Glutamate Block. Same as in (A-D) but for the Glutamate Block case in which an AMPA receptor antagonist was injected into the SMA prior to UOA insertion and photostimulation. The sagittal section is from the SMA. D: dorsal; A: anterior. Scale bars: 1mm (E and valid for E-G); 0.2 mmm (H). Blocking AMPA receptors demonstrates that initial optogenetic activation is limited to the stimulated layers in the region of UOA insertion. (I-J) Insertion Only. C-fos IHC in a sagittal section of SMA cortex (I) and at higher magnification in and around each ROI used for cell counts (J), in a case which only received UOA insertion. Scale bars: 1mm (I), 0.2mm (J). (K-L) Light Only. Same as in (I-J), but for a control case in which SMA cortex only received surface photostimulation via an optical fiber-coupled laser. Here only one ROI is shown at higher magnification to reveal the few labeled cells in L1. Scale bars: 0.5mm (K), 0.2mm (L).
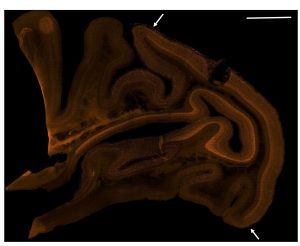
Fig. 3 Large tiled sagittal image showing long range expression of c-fos protein in orange. Arrows indicate the border between V1 and V2. Scale bar: 4mm top right. The weakened tissue near the optrode insertion site was damaged while sectioning the tissue.
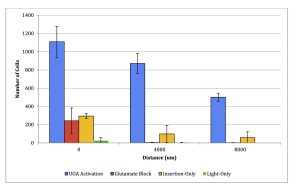
Fig. 4. Average c-fos cell count at varying distances from stimulation site (mean +/- stdev, n=5).
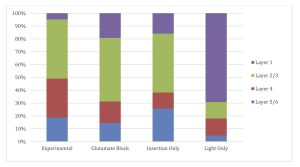
Fig. 5. Laminar distribution of c-fos counts reveals the depth of c-fos expression. The experimental case contains the least expression in layer 1. Glutamate Block and Insertion- only contain more topical expression, while Light-only contains primarily topical expression.
Discussion
We tested the Utah Optrode Arrays (UOAs) in macaques to determine the efficiency of the UOA in delivering light to deep tissue and the extent of the spatial distribution of neural excitation obtained via optrode array photostimulation. C-fos staining of stimulated tissue revealed long-range excitation across the entire visual cortex in the experimental condition (Fig. 2 A-D & Fig. 4). This long-range excitation is interesting because the UOA was designed to deliver light to the deep layers directly below the insertion point [9]. Our results indicate that the UOA may be useful to investigate inter- areal network interactions in the brain.
Glutamate Block significantly reduced long range excitation, likely due to reduced synaptic transmission between neurons. There was a 4.5-fold reduction of c-fos expression at the optrode insertion site and a 200-fold reduction 4000nm and 8000nm from the UOA insertion site (Fig. 2E-H & Fig 4). The NBQX Glutamate Block performed as predicted and established that the stimulation directly from the UOA was localized to the cortex underneath the UOA. Electrophysiological recordings in ChR2-expressing V1 cortex photostimulated via a UOA demonstrated that spiking was not observed beyond about 3mm from the stimulated site [1]. Therefore, c-fos expression observed far from the stimulation site reveals subthreshold neural activity. Subthreshold c-fos activity is consistent with other work such as the use of c-fos for metabolic mapping of the brain [43].
An important control was to determine whether c-fos expression underneath the UOA could result only from light stimulation or mechanical stimulation from the insertion of the UOA. The Insertion-only case represents one such control case in which the UOA was inserted into the cortex which did not receive channelrhodopsin injections or light stimulation. While there was some c-fos expression underneath the optrode array in the Insertion-only control, there were five times more activated cells in the experimental case. In comparing the controls with each other and the experimental case, there was slightly more c-fos expression from the Insertion-only case compared to the Glutamate Block case (Fig. 4). This did not negate any of the findings, instead it demonstrated the significant reduction in secondary excitation compared with the experimental case that include UOA activation with channelrhodopsin injection. The control using Light-only stimulation of non-virally transfected cortex revealed low levels of localized expression confined primarily to layer one, the most superficial layer (Fig. 4, 5). This reveals a very low baseline of c-fos expression even when the cortex has been exposed to light.
One potential limitation to this paper is the fact that the experimental case was performed in the visual cortex, while the control trials and Glutamate Block were performed in the SMA cortex. This somewhat limits our knowledge of how c-fos expression in visual cortex compares to its expression in SMA cortex. It would be beneficial to perform another experimental trial in the SMA cortex. This would also provide valuable information comparing the excitability of c-fos in SMA and visual cortices. However, for ethical considerations and to keep the number of animals small, these experiments have all been done in animals that already served important research purposes in other additional studies.
A common method of optical stimulation is aiming a laser directly at the cortex rather than aiming it at the back of an optrode array [4]. It would be informative to perform a control case with direct light stimulation to cortex that is expressing channelrhodopsin protein. This would allow for comparison between traditional methods and the optrode array on c-fos expression. Such a control was performed in the submitted paper [1] using electrophysiological recordings in response to surface and UOA photostimulation. It was found that surface stimulation leads to superficial layer activation, while activation via the UOA leads to deep layer neuronal activation. Another control experiment should be performed in the future applying Glutamate Block drug to blank cortex before inserting the UOA. This would determine how much of the c-fos expression in the Glutamate Block case comes from optogenetic light stimulation and how much comes from the UOA Insertion-only.
The UOA has new variants such as the Active Array which has a μLED array bonded to the backplane of the UOA. It is capable of delivering light directly to the individual UOA shanks without using a separate laser for stimulation [11]. This allows the researcher to stimulate any combination of small regions below each optrode shank. Further research could investigate stimulation patterns of this new UOA type.
Many labs are developing devices that combine optical stimulation with electrical stimulation and recording. This is very convenient because researchers can skip the step of inserting a separate recording array to measure the electrical response to optogenetic stimulation. The UOA used in this experiment does not have electrical recording capabilities, but the lab that is developing the UOA is also working on a device with optrode shanks as well as recording electrodes [46]. Various production methods have been used to create devices for optogenetic stimulation and electrical recording such as a high- density CMOS surface array, a coaxial style optical/electrical probe, a 4×4 optical array with 5 recording channels, and a 1024-channel penetrating electrode array with two optical fibers [47]–[50]. These devices are useful for characterizing the electrical response to optogenetic stimulation, so many labs are developing this type of array.
There are interesting concepts for optogenetic stimulation-only devices. Each concept has an ideal application. A high-density liquid crystal surface stimulation device has the potential to scale up to millions of channels [51]. This is good for stimulating large areas of the surface of the brain, but the precision implied by the pixel density may be deceiving. The problem with using high spatial density of optrodes such as the liquid crystal array or the UOA is that light tends to diffuse in the brain and stimulate more volume than what is intended. Laser light may diffuse several millimeters in all directions [52]. This makes the adjacent optrodes redundant. There is a limit to the precision of optrodes. Fortunately, single cell resolution in optogenetic stimulation has been achieved using a 2-photon microscope [27]. A 2-photon microscope is challenging to use, bulky, and expensive, but it is much more precise than an optrode. The advantage of the UOA is not its precision. As shown in this paper, advantage is in its ability to stimulate a large subsurface volume. The UOA is the only device with such a large array of surface penetrating optrodes. This is perfect for activating large volumes of subsurface neurons. This is supported by the c-fos distribution observed in this paper (Fig. 3-4).
This thesis characterizes the c-fos response from stimulation with the UOA. There are no other pulibcations that characterize the c-fos response of an optrode array. The results from the UOA align with results in other papers in that optogenetic activation leads to c-fos expression [37]–[39], [41], [44], [45], [53]. This paper differs because UOA delivers light to a relatively large cortical volume compared with surface stimulation or single fiber stimulation. This has resulted in c-fos expression at distances far from the stimulation site that exceed distances observed in other papers [43], [44].
The long-range effects of optogenetic stimulation observed using the methods discussed in this paper are a significant discovery. This provides a method to influence many neurons in a safe and effective way. The number of neurons affected by electrical stimulation is dependent on voltage, so stimulating large numbers of neurons would require a high voltage or many electrodes spread across a large area. Optogenetic stimulation using an array of optrodes could be used for treating epilepsy, Parkinson’s disease, and other neurological diseases that may respond to the therapeutic manipulation of large numbers of cortical neurons.
The mapping of the stimulation pattern under the UOA is an important step in the development of this device. Optogenetics has a huge potential because it can inhibit and excite neurons and target specific cell types. Its ability to stimulate cells with greater temporal precision than electrical stimulation [8] may be extremely useful for improving brain machine interfaces and developing prosthetic vision. The future is bright for optogenetics.
Acknowledgements
Support from the National Institutes of Health is acknowledged. Dr. Alessandra Angelucci is the lab principal investigator who supervised the thesis. Dr. Andrew Clark oversees electrophysiological and optogenetic aspects of the thesis and the corresponding preprint paper. Frederick Federer oversees surgical aspects of these experiments. Dr. Justin Balsor is a post-doctoral researcher who acts as a mentor in histology, microscopy, and data analysis. Dr. Steve Blair Lab designs and manufactures the Utah Optrode Array.
Author Affiliations
John Moran Eye Center
University of Utah Department of Biomedical Engineering
University of Utah Department of Electrical and Computer Engineering University of Utah Hospital Department of Neuroscience
Utah Undergraduate Research Opportunities Program
References
[1] A. M. Clark, et al. (2022, Feb.). An Optrode Array for Spatiotemporally Precise Large-Scale Optogenetic Stimulation of Deep Cortical Layers in Non-human Primates. bioRxiv. [Online]. Preprint.
Available: http://doi.org/10.1101/2022.02.09.479779
[2] W. J. Alilain, et al. (2008, Aug.). Light-Induced Rescue of Breathing after Spinal Cord Injury. Journal of Neuroscience. [Online]. 28(46), pp. 11862–11870. Available: Available: https://doi.org/10.1523/jneurosci.3378-08.2008
[3] E. M. Gibson, et al. (2014, Apr.). Neuronal Activity Promotes Oligodendrogenesis and Adaptive Myelination in the Mammalian Brain. Science. [Online]. 344(6183). Available: https://doi.org/10.1126/science.1252304
[4] Dheeraj S. Roy, et al. (2016, Mar.). Memory Retrieval by Activating Engram Cells in Mouse Models of Early Alzheimer’s Disease. Nature. [Online]. 531(7595), pp. 508–512. Available: https://doi.org/10.1038/nature17172
[5] Sébastien, et al. (2020, May). Deep Brain Stimulation-Guided Optogenetic Rescue of Parkinsonian Symptoms. Nature. [Online].11(1).
Available: https://doi.org/10.1038/s41467-020-16046-6
[6] Dimitri M. Kullmann, et al. (2012, Sep.). Plasticity of Inhibition. Neuron. [Online]. 75(6), pp. 951–962.
Available: https://doi.org/10.1016/j.neuron.2012.07.030
[7] José-Alain Sahel, et al. (2021, May). Partial Recovery of Visual Function in a Blind Patient after Optogenetic Therapy. Nature Medicine. [Online]. 27(7), pp. 1223–1229.
Available: https://doi.org/10.1038/s41591-021-01351-4 33
[8] Abigail Kalmbach, et al. (2012, Jan.). Selective Optogenetic Stimulation of Cholinergic Axons in Neocortex. Journal of Neurophysiology. [Online]. 107(7), pp. 2008–2019.
Available: https://doi.org/10.1152/jn.00870.2011
[9] T. Abaya, et al. (2012, Nov) A 3D Glass Optrode Array for Optical Neural Stimulation. Biomedical Optics Express. [Online]. 3(12), p. 3087.
Available: https://doi.org/10.1364/BOE.3.003087
[10] Richard Norman, et al, “Three-Dimensional Electrode Device,” U.S. Patent 5 215 088 A, Jun. 1, 1993.
[11] Robert Scharf, et al. (2018, Feb.). A Compact Integrated Device for Spatially- Selective Optogenetic Neural Stimulation Based on the Utah Optrode Array. Optogenetics and Optical Manipulation. [Online]. 104820M.
Available: https://doi.org/10.1117/12.2299296
[12] Elaine Jarvik, et al. “The Bionics Man.” Continuum, Summer 2018. Available: https://continuum.utah.edu/web-exclusives/the-bionics-man [13] Bern Dibner. “Luigi Galvani.” Encyclopædia Britannica. www.britannica.com/biography/Luigi-Galvani (July 26, 2022).
[14] Natalia Piotrowska, Peter A Winkler. (2007, Sep.). Otfrid Foerster, the great neurologist and neurosurgeon from Breslau (Wrocław): His influence on early neurosurgeons and legacy to present-day neurosurgery. Journal of Neurosurgery. [Online]. 107(2) pp. 451-6.
Available: https://doi.org/10.3171/JNS-07/08/0451 34
[15] Eduardo Fernández, et al. (2021, Oct.). Visual Percepts Evoked with an Intracortical 96-Channel Microelectrode Array Inserted in Human Occipital Cortex. Journal of Clinical Investigation. [Online]. 131(23).
Available: https://doi.org/10.1172/jci151331.
[16] N. . Steinmetz, et al. (2021, Apr.). Neuropixels 2.0: A miniaturized high-density probe for stable, long-term brain recordings. Science. [Online]. 372(6539). Available: https://www.science.org/doi/10.1126/science.abf4588
[17] Elon Musk and Neuralink. (2019, Aug.). An Integrated Brain-Machine Interface Platform with Thousands of Channels. Preprint. [Online].
Available: https://doi.org/10.1101/703801
[18] G.D. Reddy and A.M. Lozano. (2017, Aug.). Postmortem studies of deep brain stimulation for Parkinson’s disease: A systematic review of the literature. Cell Tissue Res. [Online]. 373 pp. 287–295.
Available: http://doi.org/10.1007/s00441-017-2672-2
[19] Mathias Grote, Maureen A O’Malley. (2011, Nov.). Enlightening the life sciences: the history of halobacterial and microbial rhodopsin research. FEMS Microbiol Rev. [Online]. 35(6) pp. 1082-99.
Available: https://doi.org/10.1111/j.1574-6976.2011.00281.x
[20] Georg Nagel, et al. {2003, Nov.). Channelrhodopsin-2, a Directly Light-Gated Cation-Selective Membrane Channel. Proceedings of the National Academy of Sciences. [Online]. 100(24), pp. 13940–13945.
Available: https://doi.org/10.1073/pnas.1936192100
35
[21] G. Nagel, et al. (2002, Jun.). Channelrhodopsin-1: A Light-Gated Proton Channel in Green Algae. Science. [Online]. 296(5577) pp. 2395–2398.
Available: http://doi.org/10.1126/science.1072068
[22] Peter Hegemann and Georg Nagel. (2013, Jan.). From channelrhodopsins to optogenetics. EMBO Mol Med. [Online]. 5(2) pp. 173–176.
Available: http://doi.org/10.1002/emmm.201202387
[23] Roberto De Luca, Et al. (2022, Jul.). Orexin neurons inhibit sleep to promote arousal. Nature Communications. [Online]. 4163.
Available: https://doi.org/10.1038/s41467-022-31591-y
[24] P. Hedgemann, et al. (1982). Isolation and characterization of the retinal-binding component of halorhodopsin. EMBO Journal. [Online]. 10, pp. 1177-1183.
Available: https://doi.org/10.1002/j.1460-2075.1982.tb00010.x
[25] Xue Han, and Edward S. Boyden. (2007, Mar.). Multiple-Color Optical Activation, Silencing, and Desynchronization of Neural Activity, with Single-Spike Temporal Resolution. PLoS ONE. [Online]. 2(3).
Available: https://doi.org/10.1371/journal.pone.0000299
[26] Jyotsna Joshi, et al. (2020, Jan.). Optogenetics: Background, Methodological Advances and Potential Applications for Cardiovascular Research and Medicine. Front. Bioeng. Biotechnol. [Online]. 7, pp. 466.
Available: https://doi.org/10.3389/fbioe.2019.00466
[27] A. Shemesh, et al. (2017, Nov.). Temporally precise single-cell-resolution optogenetics. Nature neuroscience. [Online]. 20(12), pp. 1796-1806.
Available: http://doi.org/10.1038/s41593-017-0018-8 36
[28] Susana Q. Lima, and Gero Miesenböck. (2005, Apr.). Remote Control of Behavior through Genetically Targeted Photostimulation of Neurons. Cell. [Online]. 121(1), pp. 141–152.
Available: https://doi.org/10.1016/j.cell.2005.02.004.
[29] Teruko Danjo, et al. (2014, Mar.). Aversive Behavior Induced by Optogenetic Inactivation of Ventral Tegmental Area Dopamine Neurons Is Mediated by Dopamine D2 Receptors in the Nucleus Accumbens. Proceedings of the National Academy of Sciences. [Online]. 111(17), pp. 6455–6460.
Available: https://doi.org/10.1073/pnas.1404323111
[30] Leslie Pray. (2008). Recombinant DNA Technology and Transgenic Animals. Nature Education. [Online]. 1(1), pp. 51.
[31] Xinjun Wang, et al. (2013, Apr.). Distribution of CaMKIIα expression in the brain in vivo, studied by CaMKIIα-GFP mice. Brain research. [Online]. 1518. pp. 9-25. Available: https://doi.org/10.1016/j.brainres.2013.04.042
[32] Hyeonhui Kim, et al. (2018, Dec.). Mouse Cre-LoxP system: general principles to determine tissue-specific roles of target genes. Anim Res. [Online]. 34(4), pp. 147–159. Available: https://doi.org/10.5625/lar.2018.34.4.147
[33] Babak Razavi, et al. (2020, Jul.). Real‐World Experience with Direct Brain‐ Responsive Neurostimulation for Focal Onset Seizures. Epilepsia. [Online]. 61(8), pp. 1749–1757.
Available: https://doi.org/10.1111/epi.16593
37
[34] John Y. Lin, et al. (2013, Sep.). REACHR: A Red-Shifted Variant of Channelrhodopsin Enables Deep Transcranial Optogenetic Excitation. Nature Neuroscience. [Online]. 16(10), pp. 1499–1508.
Available: https://doi.org/10.1038/nn.3502
[35] Lisa A. Gunaydin, et al. (2010, Jan.). Ultrafast Optogenetic Control. Nature Neuroscience. [Online]. 13(3), pp. 387–392.
Available: https://doi.org/10.1038/nn.2495
[36] Vanessa N. Barros, et al. (2015, Mar.). The Pattern of c-Fos Expression and Its Refractory Period in the Brain of Rats and Monkeys. Frontiers in Cellular Neuroscience. [Online]. 9.
Available: https://doi.org/10.3389/fncel.2015.00072
[37] M. Dragunow, and H.A. Robertson. (2003. Mar.). Generalized Seizures Induce c- Fos Protein(s) in Mammalian Neurons. Neuroscience Letters. [Online]. 19.
Available: https://doi.org/10.1016/0304-3940(87)90121-2
[38] Simone Simler, et al. (1994, Jul.). C-Fos Expression after Single and Kindled Audiogenic Seizures in Wistar Rats. Neuroscience Letters. [Online]. 175(1-2), pp. 58–62. Available: https://doi.org/ 10.1016/0304-3940(94)91077-4
[39] Takashi Kawashima, et al. (2014, Apr.). A New Era for Functional Labeling of Neurons: Activity-Dependent Promoters Have Come of Age. Frontiers in Neural Circuits. [Online]. 8(37).
Available: https://doi.org/10.3389/fncir.2014.00037
[40] Cory T. Miller, et al. (2010, Dec.). Vocalization Induced CFos Expression in
Marmoset Cortex. Frontiers in Integrative Neuroscience. [Online]. 4(128). 38
Available: https://doi.org/10.3389/fnint.2010.00128
[41] Jane E. Libbey, et al. (2016, Jun.). NBQX, a Highly Selective Competitive Antagonist of AMPA and KA Ionotropic Glutamate Receptors, Increases Seizures and Mortality Following Picornavirus Infection. Experimental Neurology. [Online]. 280, pp. 89–96.
Available: https://doi.org/10.1016/j.expneurol.2016.04.010
[42] Dan Wang, et al. (2019, Feb.). Adeno-associated virus vector as a platform for gene therapy delivery. Nature Reviews Drug Discovery. [Online. 18, pp. 358–378.
Available: https://doi.org/10.1038/s41573-019-0012-9
[43] S. M. Sagar, et al. (1988, Jun.). Expression of c-fos protein in brain: metabolic mapping at the cellular level. Science. [Online]. 240(4857), pp. 1328-31.
Available: https://doi.org/10.1126/science.3131879
[44] Ada C. Felix-Ortiz and Kay M. Tye. (2014, Jan.). Amygdala Inputs to the Ventral Hippocampus Bidirectionally Modulate Social Behavior. Journal of Neuroscience. [Online]. 34(2). pp. 586-595.
Available: https://doi.org/10.1523/JNEUROSCI.4257-13.2014
[45] Emiel Geeraerts, et al. (2019, Mar.). Optogenetic Stimulation of the Superior Colliculus Confers Retinal Neuroprotection in a Mouse Glaucoma Model. Journal of Neuroscience. [Online]. 39(12), pp. 2313–2325.
Available: https://doi.org/10.1523/jneurosci.0872-18.2018
[46] M. Hansan, et al., “Development on Utah optrode array for efficient neural stimulation and recording device,” presented at SPIE BiOS, San Francisco, California, United States, 2020.
39
Available: https://doi.org/10.1117/12.2551938
[47] Marleen Welkenhuysen, et al. (2016, Feb.). An integrated multi-electrode-optrode array for in vitro optogenetics. Scientific Reports. [Online]. 20353.
Available: https://doi.org/10.1038/srep20353
[48] Jeffrey R. Naughton, et al. (2016, Jun.). Shielded Coaxial Optrode Arrays for Neurophysiology. Frontiers in Neuroscience. [Online]. 10(252).
Available: https://doi.org/10.3389/fnins.2016.00252
[49] Saeyeong Jeon, et al. (2021, Jun.). Implantable Optrode Array for Optogenetic Modulation and Electrical Neural Recording. Micromachines. [Online]. 12(725). Available: https://doi.org/10.3390/mi12060725
[50] Longchun Wang, et al. (2021, Nov.). Dense Packed Drivable Optrode Array for Precise Optical Stimulation and Neural Recording in Multiple-Brain Regions. ACS Sens. 6(11). pp 4126–4135
Available: https://doi.org/10.1021/acssensors.1c01650
[51] François Ladouceur, et al. “Liquid crystal optrode arrays: a novel approach to neural interfaces,” Presented at 11th International Meeting on Substrate Integrated Microelectrode Arrays, online, 2018.
Available: https://doi.org/10.3389/conf.fncel.2018.38.00110
[52] Joseph M. Stujenske, et at. (2015, Jul.). Modeling the spatiotemporal dynamics of light and heat propagation for in vivo optogenetics. Cell Rep. [Online]. 12(3), pp. 525– 534.
Available: https://doi.org/10.1016/j.celrep.2015.06.036
40
[53] Yi Lu, et al. (2016, Mar.). Optogenetic dissection of ictal propagation in the hippocampal–entorhinal cortex structures. Nature Communications. 10962. Available: https://doi.org/10.1038/ncomms10962
41
