CHAPTER 7: EXPONENTIAL AND LOGARITHMIC GROWTH
7-3: Exponential Equations and Graphs
From Discrete to Continuous
Exponential patterns of the form  assume that
  is a whole number. This leads to a graph that is a pattern of points on the coordinate plane. But most often the independent variable is continuous, so we can join the points from an exponential pattern to get a smooth curve. That curve can be represented by an exponential equation of the form
  , where
  is a real number.
 Exponential Equations and Graphs
Explore 1
A Youtube video goes viral. The number of views triples each minute starting with 5 people. The growth of the views is illustrated in the table.
- Complete the table.
-
| Time (mins) | Views | Exponential Expression |
| 0 | 5 | |
| 1 | 15 |  |
| 2 | 45 |  |
| 3 | 135 |  |
| 4 |  |
|
| … | … | … |
| 20 |  |
|
| … | ||
|
 |
|
| … | … | … |
Solution
| Time (mins) | Views | Exponential Expression |
| 0 | 5 |  |
| 1 | 15 | |
| 2 | 45 | |
| 3 | 135 | |
| 4 | 405 | |
| … | … | … |
| 20 | 17,433,922,005 | |
| … | ||
|
|
|
| … | … | … |
- What is the initial value?
Solution
The initial value occurs at time 0 minutes. The initial value is 5 views.
- What is the constant ratio?
Solution
Every hour the number of views gets multiplied by 3, so the constant ratio is 3.
- Use reasoning to determine the number of views after 12 minutes.
Solution
Following the pattern in the table, where minutes is the exponent on the 3, the number of views is  .
.
- Write an expression that represents the number of views after minutes.
Solution
The pattern shows that the number of views = .
- If = the number of minutes and
 = the number of views, write an equation that represents the number of views at any time.
Solution

- Use the equation to determine the number of views after 90 minutes.
Solution
We substitute  into the equation:
  . So, after 90 minutes there had been about
  views.
- Plot the data points from the table on a graph, then draw a smooth curve between them to represent the equation. What do you notice about the graph?
Solution
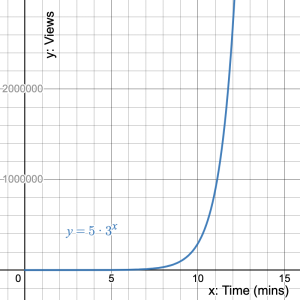 The curve of the exponential graph is continually increasing.
- Use the graph to determine when the number of views reached 1 million.
Solution
Dropping a vertical line from the graph at the -value of 1,000,000, it meets the -axis at around 11 minutes. (minutes)
Example
A small city has completed a census every ten years for the last 50 years. Their data is in the table.
| Year | 1960 | 1970 | 1980 | 1990 | 2000 | 2010 | 2020 |
| Population | 3000 | 3450 | 3968 | 4563 | 5247 | 6034 | 6939 |
a) Does the data show a linear pattern? Explain your reasoning.
b) Does the data show an exponential pattern? Explain your reasoning.
c) Suppose = the number of 10-years since 1960 and = the population, complete the table of values:
|
|
| 0 | 3000 |
| 1 | 3450 |
| 2 | |
| 3 | |
| 4 | |
| 5 | |
| 6 |
d) Graph the data in the table.
e) What is the initial value and where does it lie on the graph?
f) Use the graph to determine when the population will reach 10,000.
g) Write an equation that represents the data.
h) Use the equation to determine the population in 2030 and 2050.
Show/Hide Answer
a) To be linear the pattern must add a constant to the population over time. 3450 – 3000 = 450; 3968 – 3450 = 518 since the difference is not constant, the pattern is not linear.
b) To be exponential the pattern must multiply a constant to the population over time. 3450/3000 = 1.15; 3968/3450 = 1.15; 4563/3968 = 1.15; 5247/4563 = 1.15 etc. Since there is a constant ratio, the pattern is exponential.
c)
|
|
| 0 | 3000 |
| 1 | 3450 |
| 2 | 3968 |
| 3 | 4563 |
| 4 | 5247 |
| 5 | 6034 |
| 6 | 6939 |
d) 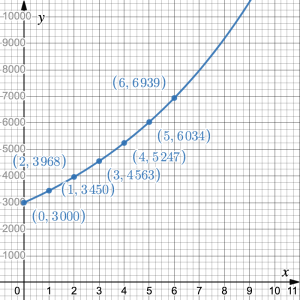
e) The initial value occurs at  so, the initial value = 3000. On the graph this is shown at the -intercept (0, 3000)
f)  : 86 years after 1960 = 2046
g) 
h) 7980; 10,554
Exponential Equations
The standard form of an exponential equation is
where  is the initial value and
  is the constant ratio with

- What does initial value mean in an exponential growth pattern and in the equation
 ?
?
Show/Hide Answer
The initial value in an exponential growth pattern is the starting value that is multiplied by a constant repeatedly. In the equation, it is the number that is multiplied by the constant ratio repeatedly times.
- What does constant ratio mean in an exponential growth pattern and in the equation ?
Show/Hide Answer
The constant ratio in an exponential growth pattern is the ratio of consecutive values of the dependent variable. It is the factor that each dependent value is multiplied by to get to the next dependent value. The constant ratio in an exponential growth pattern is the constant value that is repeatedly multiplied onto the initial value .
Practice Exercises
- A pond contains a single lily pad. The number of lily pads double each day until the pond is completely covered on day 40. On what day was the pond half-covered?
- Adriel deposits $5000 into his bank account. The account balance increases to 1.025 times the balance every year. a) What is the initial value? b) What is the common factor? c) Define variables and write an equation that represents the amount of money he has in his account. d) How much money will he have the account after 10 years
- Zebra mussels have seen a rise in population in Lake Powell over the last few years. Zebra mussels are an invasive species and once established their numbers grow by a constant ratio of around 2.7 per year. In 2016, experts estimated that there were 4,500 mussels in Lake Powell. a) Define variables and write an equation that represents the Zebra mussel population over time. b) If left untreated, how many mussels are expected to be in the lake in 2025? c) If left untreated, how many mussels will be in Lake Powell by 2035?Show/Hide Answer
Show/Hide Answer
- Day 39
- a) $5000 b) 1.025 c) Let = the time in years and = the amount in the bank account, then
 . d) $6400.42
 - a) Let = time in years since 2016 and = the Zebra mussel population , then
 b) 34,315,189 c) 706,519,304,587
 In this section, we will take what we have learned and apply the concepts to new situations.
Perspectives
- Hugh is trying to determine how long it will take a pizza right out of the oven to cool to the room temperature of 70°F. He collects the data in the table:
| Time (mins) | 0 | 1 | 2 | 3 | 4 |
| Temperature (°F) | 450 | 427.5 | 406.1 | 385.8 | 366.5 |
a) Does the data show an exponential pattern? Explain your reasoning. b) What is the initial value and what does it represent? c) Use reasoning to determine the temperature after 10 minutes. d) Write an expression that represents the temperature of the pizza after minutes. e) Will the temperature of the pizza drop below room temperature?
- The table shows an investment that gains interest over time.
| Time (years) | 0 | 1 | 2 | 3 | 4 |
| Amount ($) | 5000 | 5400 | 5832 | 6298.56 | 6802.44 |
a) Does the data show an exponential pattern? Explain your reasoning. b) What is the initial value and what does it represent? c) Define variables then write an equation that represents the amount in the account over time. d) How much will be in the account after 5 years? e) How much will be in the account after 30 years?
- If the annual average inflation rate of the US economy is 1.7% or 0.017, which means a cost of $100 one year will cost $100 + $100 x 1.7%, or $100(1+1.7%) or $100x(1.017) the next year. a) What is the constant ratio? b) If a new car cost $18,000 in 2010, how much did it cost in 2012? c) Define variables and write an equation that represents the cost of a new car over time based on inflation. d) What was the cost of a new car in 2020? e) If the pattern continues, what will be the price of a new car in 2050?
- Leaving food unrefrigerated in a warm environment gives bacteria a chance to grow and causes food to spoil. After making a sandwich, Ethan left the ham on the counter and forgets about it. Assume an initial bacteria population of 200,000 that doubles every hour. a) What is the constant ratio and initial value? b) Define variables then write an equation that represents the number of bacteria over time. c) How much bacteria was there after 7 hours? d) How much bacteria was there after 2 days? e) Draw a graph to represent the population of bacteria over time. f) Describe what happens on the graph
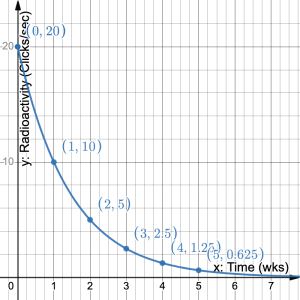
- A radioactive substance has a half-life of one week. In other words, at the end of every week the level of radioactivity is half of its value at the beginning of the week. The initial level of radioactivity is 20 counts per second. a) Construct a table of values and draw the graph. What do you notice about the graph? b) What is the initial value? c) What is the constant ratio? d) Write an equation that represents the amount of radioactivity in the substance at any time. e) How much radioactivity is left in the substance after 10 weeks?
Show/Hide Answer
- a) Yes.
 . Each descending temperature value is 0.95 times the previous value. b) 450°F The temperature when the pizza comes out of the oven. c) Multiply 348.2 by 0.95 another 5 times: 269.4°F d)
  e) No.
- a) Yes: 5400/5000 = 5832/5400 etc = 1.08 b) $5000. The starting investment amount. c) Let = time in years and = amount in the account in dollars, then
 d) $7346.64 e) $50,313.28
- a) 1.017 b) $18,617 c) Let = time in years since 2010 and = cost in dollars, then
 d) $21,305 e) $35,327
- a) constant ratio = 2; initial value = 200,000 b) Let = time in hours and = population of bacteria, then
 or Let = time in hours and = population of bacteria in 100,000s, then
  , which simplifies to
  c) 25,600,000 d) 3,355,443,200,000 e)
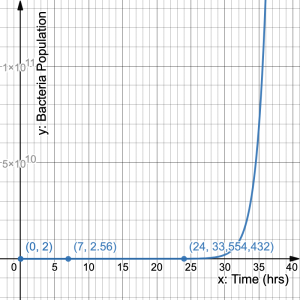 f) The bacteria population starts off slowly increasing then flies after 30 hours.
- a)
Time (weeks) 0 1 2 3 4 Clicks per second 20 10 5 2.5 1.25 The graph is continuously decreasing. It starts decreasing quickly then levels out slowly. It never reaches a radioactivity level of zero. b) 20 counts per second c) 0.5 d)
 e) 0.01953125 counts per second
b) The initial value is 20 clicks per second c) The constant ratio is 0.5 d) Let = time in weeks and = radioactivity in clicks per second, then e) 0.01953125
 In this section, we will use what we have learned so far to practice skill problems.
Skill Exercises
Evaluate:
-
- 2000(1.35)4
- 4000(1.04)8
- 2400(1.65)10
- 50,000(1.15)12
- 35,000(0.8)5
- 20,000(0.35)7
- 750,000(1.075)30
Show/Hide Answer
-
- 6643.0125
- 5474.2762
- 358,963.8247
- 267,512.5053
- 11,468.8
- 12.8679
- 6,566,216.3917
formed by repeatedly multiplying an initial value by a constant ratio
data that has an infinite number of possible values that can be selected within certain limits
