CHAPTER 4: DATA MEASUREMENT
4-1: Averages
Data
We hear about data being collected through the sites we visit on the Internet, the U.S. Census, etc. We hear about data breaches when the data we have provided, either on purpose or inadvertently, has been stolen for nefarious purposes. But what exactly is data? Data is discrete pieces of information that describe basic units of meaning. Every single piece of data is called a data point. Data could be personal such as names, addresses, phone numbers, social security numbers, etc. It could be scientific as in the results from experiments. It could be survey responses or field observations. Data is collected using techniques such as measurement, observation, query, or analysis, and is typically represented as numbers or characters which may be further processed, usually by computer. A data set is a collection of data. A data set is typically stored in tables collected together as a database. A sorted data set is a data set that has been sorted (e.g., lowest to highest, in alphabetical order, etc.) in at least one column of a table.
To describe an object, we measure its attributes such as size, weight, capacity etc., but how do we describe or measure data? What are the attributes of a data set? Two common attributes researchers are interested in are the center of a set of data, called the average, and the distance data points are away from each other. Averages are measures of central tendency.
Averages
What does it mean to be average? A dictionary may give a definition that says average is typical or normal. For example, you may have an average day at work. It was neither good nor bad but just normal; typical of any other work day. In other words, it was representative of most work days. When we talk about a set of data points, average is a number that is representative of all the data points. It is an attribute that describes where the center of the data points lies. In statistics, there are many definitions of average. Our focus will be on the mean, the median, and the mode.
 The Mode
If we are trying to describe an average workday, we would think about what typically happens in a workday. We would look for days that are basically the same. The type of day that happens most often. That is the definition of mode.
The mode of a set of data is the data point that occurs most often. We say such a data point has the highest frequency.
The Mode of a Set of Data
The mode of a set of data is the data point that occurs with the highest frequency.
Explore 1 – Determining the mode
Alena is trying to determine the best restaurant to go to for a special occasion. An online restaurant review site asked people to vote for their favorite restaurant coded A, B, or C. The votes for favorite restaurant are {A, C, A, A, B, C, B, B, B, A, C, B, B}. What is the mode of this data set? Which restaurant is considered the best restaurant?
Solution
The mode of a set of data is the data point that occurs with the highest frequency, so we need to count how many votes each restaurant received: A got 4 votes, B got 6 votes, and C got 3 votes. The highest frequency is 6. Therefore, the mode is the data point B. Consequently, the restaurant coded B is considered the best restaurant by more people than restaurants A or C.
Not all sets of data will have a clear winner for mode. Suppose in Explore 1 there is a fourth restaurant D that also gets 6 votes. Now we have both restaurant B and restaurant D with the same highest frequency of 6. This means there are two modes: B and D. In this case, we say the data is bimodal. Both restaurants B and D are considered the best restaurants.
Explore 2 – Determining the mode
In a survey, people are asked to identify their ages. There are five age brackets coded as: Bracket 1 = less than 18; Bracket 2 = 18-35; Bracket 3 = 36-45; Bracket 4 = 46-55; Bracket 5 = 56 or above. The collected data set is {4, 1, 5, 3, 3, 4, 2, 2, 4, 2, 2, 1, 2, 3, 5, 4, 4, 4, 2}. Find the mode of the set of data, then explain what it means.
Solution
To determine the mode we must count the numbers in each bracket: Bracket 1 has 2 people; Bracket 2 has 6 people; Bracket 3 has 3 people; Bracket 4 has 6 people; Bracket 5 has two people. The highest frequency is 6, which occurs in Brackets 2 and 4. Consequently, there are two modes, which are the two data points 2 and 4. Therefore, the modes are Bracket 2 and Bracket 4 which represent the age groups 18-35 and 46-55. This means that the age groups of 18-35 and 46-55 contain more people than any other age group.
Explore 3 – Determining the mode
Ten people were chosen at random and asked how long it takes them to drive to work, in minutes. The results were: 8, 25, 42, 30, 10, 15, 25, 11, 13, 25. Find the mode.
Solution
The data point 25 has the highest frequency of 3, while the other data points have the same frequency of 1. The mode is the data point 25. Consequently, the mode is 25 minutes. This means that, out of the ten people surveyed,
A data set has no mode if all of the data points of the data set have the same frequency. This is because there is no data point that has the highest frequency. For example, the date set {1, 2, 3, 4, 5, 6, 7, 8, 9} has no mode since each data point appears exactly one time.
Mode is usually used for measuring the center of a non-numerical data set. Non-numerical data means the data are not numbers. For example, {Yes, No} in voting, {strongly disagree, disagree, neutral, agree, strongly agree} in a questionnaire, {brown, green, blue, hazel, grey, black} to denote eye color in a survey, or any other name or category.

- A student claims that a mode can happen in any place in a sorted data set. It does not have to be in or around the middle of a sorted data set. Do you agree? Explain your reasoning.
Show/Hide Answer
Yes. The highest frequency could happen at any data point in a sorted data set.
- Explain what mode may be used for.
Show/Hide Answer
Mode is a measure of the data point that occurs most often so it could be used to determine the most popular choice of something. For example, the most popular choice of dessert; the most popular candidate in a political race; the album that gets sold most often; the most common shoe size; etc.
Practice Exercises
- A market research survey asks the question, “How often do you shop at BigBox?” Survey respondents had the choice of answering A: more than once per week; B: once per week; C: once every 2 weeks; D: once per month; E: less than once per month. The data gathered from this question was {A, D, E, E, D, B, B, E, A, E, E, D, D, B, C, C, A, C, E, D}. Determine the mode.
- Real estate agents calculate the mode of the number of bedrooms per house so they can inform their clients on how many bedrooms they can expect to have in houses in a particular area. Anne and Brett collected this data from a sample of houses in a popular housing area: {2, 2, 3, 4, 2, 4, 1, 3, 4, 5, 2, 4, 3, 4, 4, 3, 3, 2, 3, 2, 1, 3, 3, 2, 1, 4, 2, 3, 3, 3, 3, 1, 2}. Determine the mode.
- A retailer has two stores in different areas of the city and wants to know the mode of clothing sizes purchased at each store to help them set stocking levels. The following data was gathered over a one week period:
Store A: 23 XS; 45 S; 76 M; 85 L; 88 XL; 74 XXL
Store B: 12 XS; 37 S; 88 M; 95 L; 74 XL; 62 XXL
Calculate the mode for each store then explain what this means.
Show/Hide Answer
- E: less than once per month
- 3: 3 bedrooms is the most common in the area
- Store A: XL Store B: L Store A should stock more XL while store B should stock more L.
Mode as a measure of average, has two very important properties:
1) the data does not need to be numerical to determine the mode. The data can be categorical (e.g., XS, S, M, L, XL, XXL).
2) The mode is insensitive to outliers (except in extremely small sample sizes).
An outlier is a data point that really doesn’t fit with the other data points because it is extremely high or extremely low. For example, if we have the data set {1, 2, 1, 4, 3, 2, 1, 3, 2, 1, 3, 4, 2, 4, 1, 2, 4, 3, 3, 1, 1, 3, 4, 200}, it is pretty obvious that the data point 200 doesn’t fit well with the other data points of 1, 2, 3, 4. It is extremely high, so 200 is considered an outlier. However, a mode can occur anywhere in a sorted data set, so while it measures the most frequent data point (i.e., the most popular choice), it may not measure the most central data point. For this, we go to the median.
The Median
The median of a dataset is the value separating the higher half from the lower half of an ordered data set (e.g., numerical values from smallest to largest or vice versa; dates in chronological order; etc.). As such, it can be considered the middle value. To determine the median of a set of data, the data must be numerical. We first have to sort the data from smallest to largest (or vice versa), then we determine through counting the middle place of the sorted data. The value of the middle place will be the median.
Explore 4 – Determining the median
Your screen time last week is recorded below in hours. Find the median. {4, 6, 4, 5, 8, 10, 5}
Solution
The sorted data set is {4, 4, 5, 5, 6, 8. 10}. Since there are 7 data points, the middle value will be the fourth data point because there are three data points below and three data points above the fourth data point: {4, 4, 5, 5, 6, 8, 10}. Therefore, the median is 5; the value of the fourth data point.
This tells us that you averaged 5 hours of screen time last week.
Explore 4 shows that if the middle place of a sorted data set happens to be a data point, the data point will be the median. This will happen any time there is an odd number of data points.
If there is an even number of data points, the middle place lies between two data points. To calculate the median in this case, we find the value that is exactly halfway between the two data points. For example, for the ordered data set {1, 5, 8, 10, 13, 25}, the middle place is between the two data points 8 and 10 because there are three data points below (i.e., 1, 5, 8) and 3 data points above (i.e., 10, 13, 25) the middle place. It should be fairly obvious that 9 is exactly halfway between 8 and 10. If it’s not so obvious, we determine the halfway point by adding the two data points together then dividing by 2: (8+10)/2 = 9. Therefore, the median of the data set is 9. The value 9 is right at the center of the data values.
Explore 5 – Determining the median
One indicator of global warming is the increase in the number of days per year with extreme heat, such as temperatures exceeding 90 degrees Fahrenheit. According to historical weather data from the National Weather Service (2022), the number of days at or above 90 degrees Fahrenheit for a 10-year period in Phoenix, Arizona is as follows:
Year 1: 15 days
Year 2: 18 days
Year 3: 12 days
Year 4: 20 days
Year 5: 16 days
Year 6: 22 days
Year 7: 19 days
Year 8: 17 days
Year 9: 14 days
Year 10: 21 days
a) Determine the median number of days at or above 90 degrees Fahrenheit for this 10-year period.
b) Explain what this median tells us.
Solution
a) The sorted data set is {12, 14, 15, 16, 17, 18, 19, 20, 21, 22}. The middle place is between the fifth and sixth data points so that there are five data points below and above the middle place. The middle place is halfway between the fifth and sixth data points. Therefore, the median is (17 + 18) ÷ 2 = 35 ÷ 2 = 17.5.
This tells us that, over the 10-year period, the midpoint of the number of days at or above 90°F is 17.5 days per year.
Explore 6 – Determining the median
Saartie wants to find out the median height in his group of friends. He collects the height of everyone including himself: {5’10”, 5’8”, 4’11”, 4’10”, 5’5”, 5’2”, and 4’ 7”, 4’8”}. What is the median height of this group? If Saartie measures 5’2″ in height, is his height above or below the median?
Solution
First we order the data set from shortest to tallest: {4’7″, 4’8″, 4’10”, 4’11”, 5’2″, 5’5″, 5’8″, 5’10”}. Since there are eight data points, an even number, the middle place is halfway between the fourth and fifth data points. There are four data points below and four data points above the middle place. The value of the middle place is halfway between 4’11” and 5’2″. Since we have mixed measurements of feet and inches, we may convert the two measurements to inches:


Therefore, the median is (59″ + 62″) ÷ 2 = 121″ ÷ 2 = 60.5″ = 5′ 1/2″ since 60 inches = 5 feet.
Since Saartie’s height of 5’2″ is greater than the median of 5′ 1/2″, his height is above the median.
- A student claims that you do not need any computation to determine the median of any set of data because the median is the midpoint of a set of data. It is just there, the midpoint in a sorted data set. Do you agree? Explain your reasoning.
Show/Hide Answer
The claim is not 100% correct. It is true when the number of data points is odd. However, you need to calculate the median when the number of data points is even. You will need to calculate the halfway point of the middle two data points when the number of data points is even.
- A student claims that when there is an even number of data points, (the number of data points) ÷ 2 tells us where the midpoint lies. Do you agree? Explain your reasoning.
Show/Hide Answer
The claim is not quite correct. With an even number of data points the median will be between two data points. The number of data points ÷ 2 tells us the smaller of the two data points used to find the midpoint. The other data point is the next one in line. The middle value actually lies at the (number of data points + 1) ÷ 2 place. For example if there are 48 data points, the middle value is at (48+1) ÷ 2 = 24.5th place. In other words, halfway between the 24th and 25th sorted data points. The 24th and 25th data points will be used to determine the midpoint of the sorted data set, and hence the median.
Practice Exercises
- Real estate agents calculate the median price of houses to gain a better idea of the “typical” home price in a certain area, since the median is less influenced by outliers (like multi-million dollar homes). Alexander collects data from recently sold homes in the area: {$765k, $487k, $1,273k, $496k, $525k, $602k, $899k, $623k, $497k, $599k, $599k}. Determine the median home price in the area. Explain what the median tells us.
- Michael owns a small business with 6 employees. He pays his employes the following salaries: {$74k, $46, $48k, $62k, $51k, $49k}. Calculate the median salary and explain what this tells us.
- At MidTown Hospital there is some concern about the high turnover of nurses in the Ambulatory Care Unit. A survey was done to determine how long (in months) nurses had been in their current positions. The responses (in months) of 20 nurses were {23, 25, 14, 25, 36, 27, 42, 12, 8, 7, 2, 32, 9, 2, 62, 8, 11, 20, 3, 18}. a) Calculate the median, then explain what that tells us. b) If the nurses across all other hospital units had a median time at their current jobs of 28 months, would you be concerned about the the high turnover of nurses in the Ambulatory Care Unit? Explain your reasoning.
- Amy wants to buy an 8-seater SUV. She collects the prices of the basic trim models from eight auto car brands:
Toyota Highlander = $40,220; Jeep Wagoneer = $58,995: Ford Expedition = $55,125, Chevrolet Traverse = $34,520; Hyundai Palisade = $35,550; Honda Pilot = $37,295; Subaru Ascent = $35,605 and Volkswagen Atlas = $35,150.
a) What is the median of the SUV prices from the data Amy collected? b) If Amy decides to buy the SUV at this median price, what SUV should she buy?
Show/Hide Answer
- $599k. Recent house sales indicate that the mid-price in the area is $599,000.
- $50k. The mid salary of his employees is $50,000. 3 employees make less than $50k and 3 employees make more than $50k.
- a) 16 months. The midpoint of the time nurses have spent in their current positions in the Ambulatory Care Unit is 16 months. b) A median of 16 months is quite a bit less than a median of 28 months so I would be concerned.
- a) Median = $36,450. b) Since there is no SUV at this median price, Amy should buy one of the two SUVs used to calculate the midpoint: the Subaru Ascent at $35,605 or the Honda Pilot at $37,295.
 Because the median is the center point of a set of data, it is not bothered too much by outliers. Consequently, median is often used as an average anytime there are outliers in the data set.
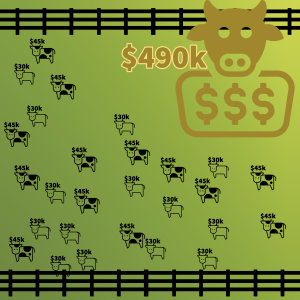
For example, if a dataset of income values in a small village has 200 values between $30,000 and $45,000 per year and one value of $490,000 per year, determining the middle value will not be influenced much by the one data point at $490,000 that is at least ten times as large as any other income. The median will still represent the middle income somewhere between $30,000 and $45,000.
The Mean
Before the 20th century, the median was the most popular average to use since it was easy to compute by hand. Since the 20th century, the most popular average has become the arithmetic mean; the mean is much more easily calculated by computers than the median. The mean uses every data point in the dataset, so it is extremely sensitive to outliers. Consequently, the mean should be used only when there are no outliers in the dataset.
The mean of a set of data is the sum of the data points divided by the number of data points. For example, the mean of the set of data {1, 8, 9, 4, 7} is the sum of the five data points 1 + 8 + 9 + 4 + 7 = 29 divided by the number of data points 5, which is equal to 5.8.
Colloquially people usually use the word average to refer to the mean of a set of data. However, in statistics, the word average may also refer to other measures, such as the median or the mode of a set of data.
Explore 7 – Calculating the mean
1. Wren has received the following scores out of 100 on four exams: 75, 68, 83 and 79. What is Wren’s mean score?
Solution
To calculate the mean we add up the data points then divide by the number of data points: (75 + 68 + 83 + 79) ÷ 4 = 305 ÷ 4 = 76.25
Wren’s mean score was a 76.25.
Explore 8 – Calculating the mean
Abena is keeping track of her grocery bills. Over the past six months she has spent $342, $415, $512, $877, $295, and $312 on groceries. What is the mean of her grocery bills?
Solution
To calculate the mean we add up the data points then divide by the number of data points:
($342 + $415 + $512 + $877 + $295 + $312) ÷ 6 = $2753 ÷ 6 = $458.833…
Since we are working with money, we’ll round this to the nearest cent. Abena’s grocery bills averaged $458.83.
Explore 9 – Calculating the mean
The snowpack at Utah ski resorts in April 2023 is listed:
Alta 147″, Beaver 79″, Brian Head 80″, Brighton 93″, Canyons 93″, Cherry Peak 122″, Deer Valley 93″, Park City 93″, Powder Mountain 47″, Snowbasin 90″, Snowbird 147″, Solitude 111″, Sundance 102″
Calculate the mean snowpack.
Solution
To calculate the mean we add up the data points then divide by the number of data points:
(147″ + 79″ + 80″ + 93″ + 93″ + 122″ + 93″ + 93″ + 47″ + 90″ + 147″ + 111″ + 102″) ÷ 13 = 99.8″
- A student claims that the mean of a set of data is the value in the middle place of the set of data. Do you agree? Explain your reasoning.
Show/Hide Answer
The claim is incorrect. The mean of a set of data is strongly influenced by extremely large or low data values. It will lean to the larger data points if there are some extremely large data points. It will lean to the smaller data points if there are some extremely small data points. To illustrate, for the second question in explore 1, there is an extremely large data point 877, which drags the mean toward the larger data points. As a result, the mean 458.83 is nowhere near the middle place of the set of data. There are four data points below the mean and two data points above the mean. The place of the mean is on the side of the larger data points.
- Consider a data set of 15 distinct measurements with mean A and median B. If the highest number were increased, what would be the effect on the median and mean? Explain.
Show/Hide Answer
The median would not change as it is the middle data point and is uninfluenced by the highest data point. The mean would increase since it takes all data points into consideration. If the highest number is increased the sum of the numbers would increase, increasing the mean.
Practice Exercises
- Fifteen students took a math test and earned the following percentage scores: {10, 45, 68, 72, 72, 74, 78, 84, 88, 90, 94, 94, 94, 97, 100} a) Calculate the mean score and explain what it means. b) Calculate the median score and explain what it means. c) Calculate the mode and explain what it means. d) Explain which average should be used and why.
- The average temperatures of the contiguous US for January over the last ten years are {35.15°F, 31.17°F, 34.59°F, 35.55°F, 32.56°F, 32.16°F, 33.57°F, 32.22°F, 33.08°F, 30.56°F} Calculate the mean.
- James is considering joining a basketball team but at 5’10” he is a little intimidated by the heights of the other players. The dataset gives the players heights in inches: {73, 77, 72, 78, 74, 70, 86, 83, 74} Calculate the mean and the median.
Show/Hide Answer
- a) 77.3% This average score takes all scores into account and tells us how the class did as a whole. b) 84% This is the center score. Half the class scored lower than 84% and half the class scored higher than 84% c) 94% This score is earned more than any other score. d) The median should be used since there is an outlier of 10% in the list of scores which skews the mean.
- 33.061°F
- Mean 76.3″ = 6’4″ Median = 77″ = 6’5″
 In this section, we will take what we have learned and apply the concepts to new situations.
Perspectives
- Rochelle measures her mother’s heartbeats 5 times to get an average reading. The five measures are 108, 92, 86, 73, and 85. What is her median heartbeat?
- To get an accurate result, it is recommended not relying on the first measure when measuring blood pressure. It is also recommended to measure several times to get a mean. Toby measures five times and gets 180/100, 150/95, 147/90, 144/88, and 146/90. The top number is the systolic blood pressure and the bottom number is the diastolic pressure. a) What is the mean systolic blood pressure? b) What is the mean diastolic pressure?
- Anaisha believes that the middle answer is the best choice when making decisions concerning groups of people. She is entering a conference center and trying to pick a line that will get her in fastest. There are 7 lines (A to G). The following is the list of numbers of people in the 7 lines: A-25, B-18, C-17, D-22, E-20, F-19, and G-21. Which line should Anaisha pick according to her belief?
- To prepare for a job interview, Bob expects the question, “What is the amount of annual salary you expect from this position?” Bob decides to answer the question by giving the median annual salary from the 6 annual salaries he found about the position. The five annual salaries are $55,000, $52,000, $64,000, $61,000, $58,000, and $53,000. What is the median annual salary?
- Danny uses the number “0” to represent a “No” vote and the number “1” to represent a “Yes” vote when recording the results of an election. There are 15 “No” votes and 8 “Yes” votes. To report the election result, Danny calculates the mean of the set of numbers (8/22 = 0.36) and says the election result is 0.36. What does a mean of 0.36 tell us about the election? Do you think the mean is appropriate for reporting the election result? Explain your reason.
- Yating claims that average ratings may sometimes be biased on Amazon due to very good or very bad data points. Yating claims that mode would be more acceptable than mean for the following star ratings from Amazon: 1, 5, 2, 5, 1, 5, 5. Find the mean and mode. Do you agree with Yating’s claim? Explain your reasoning.
- Yating claims that average ratings may sometimes be biased due to unbalanced distribution. Yating claims that median would be more acceptable than mean for the following restaurant ratings 1, 1, 1, 1, 1, 2, 5, 5. Find the mean and median. Do you agree with Yating’s claim? Explain your reason.
- Fatma calls for a vote of five candidates. Should Fatma use mean, median, or mode to determine the winner? Explain your reasoning.
- A study conducted by the National Park System, recorded ground temperatures near Furnace Creek in Death Valley from May to November: {146°F, 152°F, 168°F, 174°F, 180°F, 178°F, 179°, 180°F, 178°F, 178°F, 168°F, 165°F, 152°F, 144°F}. Calculate the mode, the median, and the mean. Which measure would you use as the average? Explain your reasoning.
- Radon is a gas emitted from the ground that can collect in houses. At certain levels it can cause lung cancer. Radon concentrations are measured in picocuries per liter (pCi/L). A radon level of 4 pCi/L is considered “acceptable.” Radon levels in a house vary from week to week. In one house, a sample of 8 weeks had the following readings for radon level (in pCi/L): {1.3, 2.9, 5.4, 4.8, 1.7, 8.9, 3.2, 7.4}. Calculate the mean, median, and mode. Which measure would you use as the average? Explain your reasoning.
Show/Hide Answer
- 86
- a) 153.4 b) 92.6
- E
- $56,500
- 0.36 is closer to 0 than to 1, so it represents a no vote. The mean is not appropriate. With a yes/no vote mode is most appropriate.
- Mean = 3.43 Mode = 5. Mode only counts the most popular rating of 5. Mean takes all ratings, so mean is more appropriate than mode.
- Mean = 2.125 Mode = 1 Yating’s claim is correct because the ratings are unbalanced and skewed towards lower values. The median would be more acceptable than mean because it is less affected by outliers.
- Mode
- Mean = 167.3°F Median = 171°F Mode = 178°F
- Mean = 4.45pCi/L Median = 4pCi/L Mode = No mode
 In this section, we will use what we have learned so far to practice skill problems.
Skill Exercises
Find the mode, median, and mean of the dataset:
- {34, 76, 87, 45, 34, 76, 45, 34, 76, 36, 34, 80}
- {5, 5, 5, 5, 5, 5, 5, 90}
- {7, 7, 9, 3, 4, 9, 5, 3, 7, 8, 9, 4, 7, 5}
- {54, 56, 87, 54, 78, 23, 75, 56}
- {4, 5, 8, 2, 5, 7, 5, 5, 4, 7, 8, 6, 5, 7, 5, 4, 7}
- {$4.50, $7.50, $4.30, $7.45, $4.60, $7.20}
- {12m, 7m, 6m, 13m, 7m, 8m, 5m, 8m, 7m, 4m, 12m, 6m, 7m}
Show/Hide Answer
- Mode = 34; Median = 45; Mean = 54.75
- Mode = 5; Median = 5; Mean = 15.625
- Mode = 7; Median = 7; Mean = 6.214
- Mode = 54 and 56; Median = 56; Mean = 60.375
- Mode = 5; Median = 5; Mean = 5.529
- Mode = none; Median = $5.90; Mean = $5.93
- Mode = 7m; Median = 7m; Mean = 7.846m
discrete pieces of information that describe basic units of meaning
a single point of data
a collection of data
collected data sets
a data set that has been sorted in some way
a number that is representative of all the data points
the data point that occurs most often in a data set
the number of times a data value has been recorded
having 2 modes
a data point that really doesn't fit with the other data points because it is extremely high or extremely low
the value separating the higher half from the lower half of an ordered data set
expressed using a number or numbers
not divisible by 2
a number that is a multiple of 2
the sum of the data points divided by the number of data points
