CHAPTER 6: LINEAR GROWTH
6-3: Linear Reasoning – Slope and Intercept
Introduction
Linear thinking is a psychological term used to define a systematic and analytical thought process that utilizes a sequential method in solving problems. Linear reasoning views a problem as a process with a set starting point (initial value) that follows a pattern (rate of change), ultimately leading to a solution. We have learned that linear reasoning can be used on a table or with a given rate. Another platform where linear reasoning can be used is the two-dimensional coordinate plane.
The coordinate plane was developed in 1637 and refined by the French mathematician René Descartes. In his honor, the system is sometimes called the Cartesian coordinate system. This system allows us to visualize algebraic relationships, and also helps us create and interpret algebraic concepts.
 The Coordinate Plane
The coordinate plane is composed of two perpendicular number lines that intersect at a point called the origin. A grid is formed by drawing equally spaced lines that run parallel to each of the number lines.
Explore 1 – Streets in a city
The naming of addresses in Utah was originally based on the idea of a coordinate plane. In Orem, there are two major roads that go through and intersect at the center of the city. The street that goes north and south is called Main Street. The street that goes east and west is called Center Street. (In reality, Main Street and Center Street never actually meet in Orem!)
Any address that lies north of Center Street is regarded as being on the north side of the city. Any address that lies south of Center Street is regarded as being on the south side of the city. Any address lying east of Main Street is regarded as being on the east side of the city. Any address that lies west of Main Street is regarded as being on the west side of the city.
An address uses two numbers to show where it lies in the city. Each number is called a coordinate. The first coordinate is the horizontal east/west position and the second coordinate is the vertical north/south position. Identify the following addresses on the map.

-
-
-
- (100 E, 400 N)
- (100 W, 300 N)
- (400 W, 100 S)
- (300 E, 500 S)
-
-
Solution
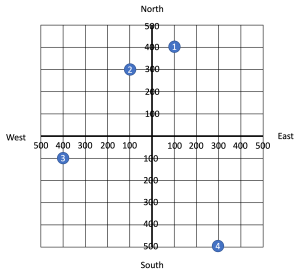 To get to 100 E, we start at the origin (the intersection of Main Street and Center Street) and move east (right) to 100. Then to get to 400 N, we turn north (up) and move to the level of 400. We are now at (100 E, 400 N).
- To get to 100 W, we start at the origin (the intersection of Main Street and Center Street) and move west (left) to 100. Then to get to 300 N, we turn north (up) and move to the level of 300. We are now at (100 W, 300 N).
- To get to 400 W, we start at the origin (the intersection of Main Street and Center Street) and move west (left) to 400. Then to get to 100 S, we turn south (down) and move to the level of 100. We are now at (400 W, 100 S).
- To get to 300 E, we start at the origin (the intersection of Main Street and Center Street) and move east (right) to 300. Then to get to 500 S, we turn south (down) and move to the level of 500. We are now at (300 E, 500 S).
Explore 2 – The coordinate plane
Based on Explore 1, we may change the name “Center Street” to “ -axis”, and the name “Main Street” to “
 -axis”. We may also consider “East” or “North” with “+” (positive) and “West” or “South” with “–” (negative). By doing so, you have (+, +) address coordinates at the east and north of the city (also called the first quadrant), (–, +) address coordinates at the west and north of the city (also called the second quadrant), (–, –) address coordinates at the west and south of the city (also called the third quadrant), and (+, –) address coordinates at the east and south of the city (also called the fourth quadrant). This means that the -axis and -axis are number lines that meet at
  and
and  . Consequently, the origin is the point (0, 0). Show the following addresses on the map.
- (+400, +200)
- (–300, +400)
- (–400, –300)
- (+500, –500)
Solution
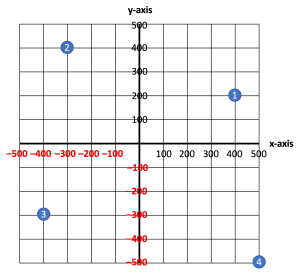
- We start at the origin (0, 0) and move right to +400, then go up to the level of +200. We are now at (+400,+200).
- We start at the origin (0, 0) and move left to –300, then go up to the level of +400. We are now at (–300, +400).
- We start at the origin (0, 0) and move left to –400, then go down to the level of –300. We are now at (–400, –300).
- We start at the origin (0, 0) and move right to +500, then go down to the level of –500. We are now at (+500, –500).
Explore 3 – Identify the coordinates
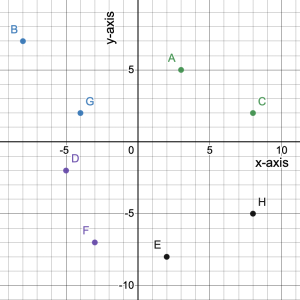
Identify the coordinates of each point on the coordinate plane. Use a pair of parentheses to enclose the -coordinate and the -coordinate. For example, (2, 3) means the location of a point where the point lies on a vertical line that passes through 2 on the -axis and on a horizontal line that passes through 3 on -axis.
Solutions
To determine the -coordinate of each point, we imagine a vertical line that passes through the point and determine where that line crosses the -axis. For point A, a vertical line moves down from the point and hits the -axis at 3.
To determine the -coordinate of each point, we imagine a horizontal line that passes through the point and determine where that line crosses the -axis. For point A, a horizontal line moves left from the point and hits the -axis at 5.
Consequently, point A has coordinates (3, 5).
A = (3, 5); B = (–8, 7); C = (8, 2); D = (–5, –2); E = (2, –8); F = (–3, –7); G = (-4, 2); H = (8, –5)
Explore 4 – Identify the points on the coordinate plane
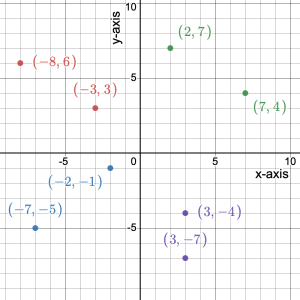
Given a table with two columns where the first column indicates the -coordinate and the second column indicates the -coordinate, transfer each row as a coordinate pair  and identify the coordinate pair on the coordinate plane.
|
|
Coordinates |
|---|---|---|
| 2 | 7 | (2, 7) |
| 3 | –4 | |
| –2 | –1 | |
| –8 | 6 | |
| 3 | –7 | |
| 7 | 4 | |
| –7 | –5 | |
| –3 | 3 |
Solution
|
|
Coordinates |
|---|---|---|
| 2 | 7 | (2, 7) |
| 3 | –4 | (3, –4) |
| –2 | –1 | (–2, –1) |
| –8 | 6 | (–8, 6) |
| 3 | –7 | (3, –7) |
| 7 | 4 | (7, 4) |
| –7 | –5 | (–7, –5) |
| –3 | 3 | (–3, 3) |
Examples
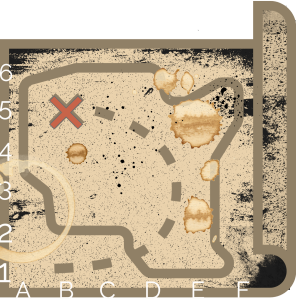
- A treasure map shows the coordinates of the treasure, where X marks the spot. What are the coordinates of the treasure?
- State the coordinates of the points on the coordinate plane.
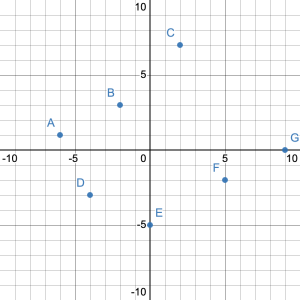
Show/Hide Answer
- (B, 5)
- A (–6, 1); B (–2, 3); C (2, 7); D (–4, –3); E (0, –5); F (5, –2); G (9, 0)

- Explain the meaning of a coordinate pair
 .
.
Show/Hide Answer
A coordinate pair gives the exact location of a point on the coordinate plane. The first element is the value of the -coordinate and the second element is the value of the -coordinate. The -coordinate tells us where the point lies in the horizontal direction relative to the -axis, and the -coordinate tells us where the point lies in the vertical direction relative to the -axis.
Linear Patterns on the Coordinate Plane
Since a linear pattern can be shown in a two-column table (See 6-2), and a two-column table can be written as coordinates and transferred onto the coordinate plane (See Explore 4), we can transfer a linear pattern onto the coordinate plane. This means that the linear reasoning we learned using initial value and rate of change can be transferred onto the coordinate plane!
Explore 5 – Translate a rate and initial value onto the coordinate plane
The corner store has a shelf where everything on it is sold for $2 per item.
- Use this rate to create a two-column table where the first column has values of the independent variable (i.e., the number of items) from 0 to 6 and the second column has values of the dependent variable (i.e., cost).
Solution
| Number of Items | Cost ($) |
| 0 | 0 |
| 1 | 2 |
| 2 | 4 |
| 3 | 6 |
| 4 | 8 |
| 5 | 10 |
| 6 | 12 |
- Suppose represents the number of items (independent variable) and represents the cost (dependent variable). Transfer each coordinate pair on each row of the table to the coordinate plane. Note that we usually place the independent variable on the -axis and the dependent variable on the -axis.
Solution
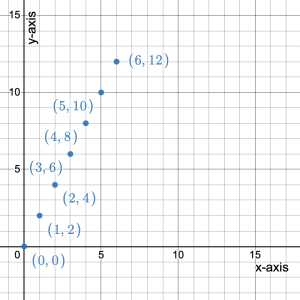
- What does the point (0, 0) represent?
Solution
It shows that when 0 items are bought the cost is $0. This is the initial value of the linear pattern.
- What do you notice about all the points on the coordinate plane?
Solution
They all lie on a line. They all have both – and -coordinates that are positive.
- Explain how we would move from the point (1, 2) to (2, 4).
Solution
We could move 1 unit to the right horizontally, then move 2 units up vertically or we could move 2 units up vertically, then move 1 unit to the right horizontally.
- Explain how we would move from the point (5, 10) to (6, 12).
Solution
We could move 1 unit to the right horizontally, then move 2 units up vertically or we could move 2 units up vertically, then move 1 unit to the right horizontally.
- How do you explain the solutions to questions 4 and 5, and what do they have to do with the unit rate of $2 per item?
Solution.
The answers are the same. Moving 1 unit to the right horizontally results in an increase of 1 item. Moving 2 units up vertically results in a $2 increase in cost. So, the (vertical increase) ÷ (horizontal increase) = the unit rate.
Explore 6 – Linear reasoning on the coordinate plane
We do not need to create a table of values showing a linear pattern and then transfer the results onto the coordinate plane to use linear reasoning. We can actually use linear reasoning on the coordinate plane directly.
Suppose the corner store has another shelf where everything on the shelf sells for $3 per item. This is a unit rate, so we know that the price increases by $3 as the number of items purchased increases by 1. So, if = the number of items (independent variable) and = the cost (dependent variable), we can start with any coordinate pair and use the unit rate to plot all other coordinate pairs.
We know that if we buy 1 item the cost will be $3, so the coordinate pair (1, 3) lies on the coordinate plane.
- Plot the point (1,3).
Solution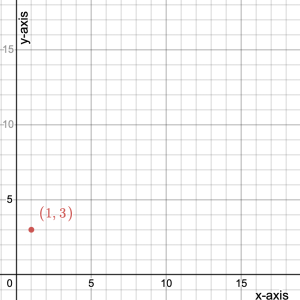
- Use the unit rate of $3 per item to move from the point (1, 3) to another point on the coordinate plane.
Solution
The -value increases by 3 as the -value increases by 1. Therefore, the next point after (1, 3) is (1 + 1, 3 + 3) = (2, 6).
- Use this pattern to continue determining other points on the coordinate plane.
Solution
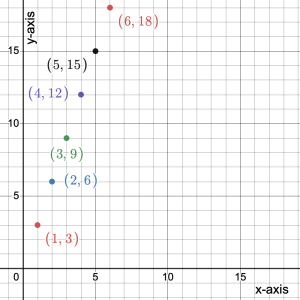
- What pattern is formed using the unit rate and a starting point?
Solution
The unit rate tells us how to get from one point to the next. In this case the unit rate of $3 per item tells us to move horizontally right by 1 unit and 3 units vertically up to get to the next point. It is like climbing a staircase of 1 over 3 up every time. The points all lie on a line.
We call the number of units we move vertically to get from one point to another the rise. The number of units we move horizontally from one point to another is the run.
- If we skip a point and move from (1, 3) to (3, 9) what is the ratio of the vertical rise to the horizontal run?
Solution
We move 2 units to the right, and 6 units up, so the ratio is 6/2 = 3/1.
- If we skip 2 points and move from (1, 3) to (4, 12) what is the ratio of the vertical rise to the horizontal run?
Solution
We move 3 units to the right, and 9 units up, so the ratio is 9/3 = 3/1.
- How do the answers to 6 and 7 relate to the unit rate in a linear pattern?
Solution
They are equal. The unit rate = rise/run.
- How can we move from the point (1, 3) to the initial value of zero represented by the point (0, 0)? How does this relate to the unit rate of the linear pattern?
Solution
We have to go back down the staircase. So we would go down 3 units and left 1 unit. This means that the rise would be –3 since we are going down, not up. Also, the run would be –1, since we are going left, not right. So rise/run = –3/–1 = 3/1 = the unit rate.
We have just used linear reasoning to deduce that the unit rate in a linear pattern is equal to the rise/run on the coordinate plane. We have also seen that the initial value is always represented by a point whose -coordinate is 0.
Explore 7 – Identify a rate and initial value on the coordinate plane
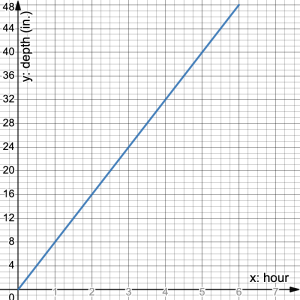
A swimming pool loses 10 inches of water per month to evaporation over the summer. If the original depth of the water is 5 feet, the graph shows the linear pattern of the depth of water in the pool over time.
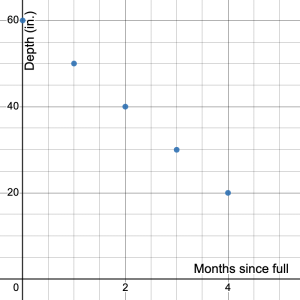
- What is the unit of measurement on the vertical scale? What is the unit of measurement on the horizontal scale?
Solution
The vertical scale is measured in inches, and the horizontal scale is measured in months.
- How do we know the plotted points represent a linear pattern?
Solution
The evaporation rate is constant at 10 inches per month. The points all lie on a line.
- What does the point (0, 60) represent?
Solution
(0, 60) tells us that at the start of the summer the water depth was 60 inches. It is the initial value of the linear pattern.
- What is the rise and run from one point to the next point? Explain your reasoning.
Solution
The rise is –10 and the run is 1 from one point to the next point. For example, from the point (1, 50) to the point (2, 40), the vertical rise from 50 to 40 is 40 – 50 = –10. The horizontal run from 1 to 2 is 2 – 1 = 1.
- What is the rate of change of the linear pattern? Write the rate in fraction form. Explain your reasoning.
Solution
The rate of change is  because the depth decreases by 10 inches every month.
- Do you agree that the rate of change of a linear pattern is equivalent to the fraction of rise over run on the graph? Explain your reasoning.
Solution
Yes, the rate  is exactly the rise of –10 over the run 1 that is
  on the coordinate plane. Only the units of measurement are missing from the fraction rise/run. However, they are implied by the title of the axes.
Both the variables months and depth are continuous. This means that we do not jump from one month to the next, nor does the depth of the pool jump from one depth to another. Rather time flows by without taking a break, and the depth of the pool declines slowly over time. Consequently, the graph of discrete plotted points really should be continuous too. We can achieve this by simply joining the points with a line.
- Turn your graph of plotted points into a continuous graph.
Solution
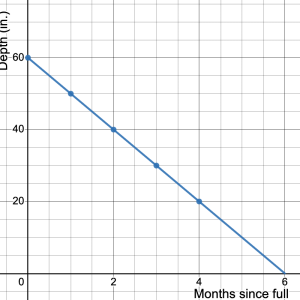
The points join to form a line that travels from (0, 60) to (6, 0). The point (0, 60) represents the initial value of a depth of 60 inches at the start of the summer. This is the point where the line intersects the vertical axis. Consequently, it is called the -intercept.
- State the point that is the -intercept and explain what it means.
Solution
The -intercept is the point where the line intersects the -axis: (6, 0). This point tells us that at 6 months the pool is dry.
We have learned that the concept of rate of change in a linear pattern is equivalent to the fraction rise over the run on the coordinate plane. In mathematics, we use the term slope to refer to the rise over the run on the coordinate plane. In other words, a rate of change in our daily lives is equivalent to the slope of the line that joins two or more points on the coordinate plane. We have also seen in Explore 7 that we can calculate the rise by subtracting the -coordinates of the two points and the run by subtracting the -coordinates of the same two points. In other words, the rise is the change in -values and the run is the change in -values from one point to another point.
Linear Patterns on the Coordinate Plane
| Linear Pattern |  |
Coordinate Plane |
| Initial value | -intercept |
|
| Rate of change | Slope | |
- How does a rate become a slope on the coordinate plane? Explain your reasoning.
Show/Hide Answer
The denominator of a rate is the change in the independent value from one data point to another data point and it is equivalent to the run which is the change in value of the -coordinates from one point to another point in the coordinate plane. The numerator of a rate is the corresponding change in the dependent value and it is equivalent to the rise in the value of the -coordinates between the two points in the coordinate plane.
When the independent variable is continuous, its values are not always integers. For example, if ground beef is priced at $5.99 per pound, we do not have to buy a whole pound. We could buy 1/2 pound or 3/4 pound or 3.1 pounds. So, when a linear pattern like this is transferred to a coordinate plane, the data points do not have to lie on grid lines since the weight can take on any value, in this case, greater than or equal to zero. If we could plot every possible data point, the result would be a line.
Lines on the Coordinate Plane
Explore 8 – Graphing a line
Ground beef is priced at $5.99 per pound at the local grocery store.
- Create a table of values showing the linear pattern for the cost of buying 0 – 5 pounds of ground beef.
- What variable is the independent variable and what are the measurement units?
- What variable is the dependent variable and what are the measurement units?
- What is the unit rate?
- Transfer the data points to a coordinate plane, and draw the line that represents the linear pattern.
- What is the -intercept of the line, and how does it relate to the initial value in the table?
- What is the slope of the line and how does it relate to the rate in the table?
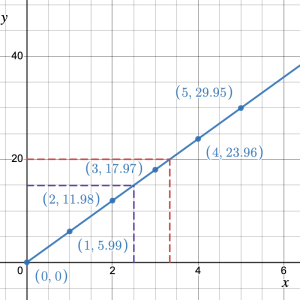
- Use the graph to determine the cost of 2.5 pounds of ground beef?
- Use the graph to determine how much ground beef can be bought for $20.
Solutions
-
Weight (lb) Cost ($) 0 0 1 5.99 2 11.98 3 17.97 4 23.96 5 29.95 - Independent variable is weight measured in pounds.
- Dependent variable is cost measured in dollars.
- Rate = $5.99/1 lb.
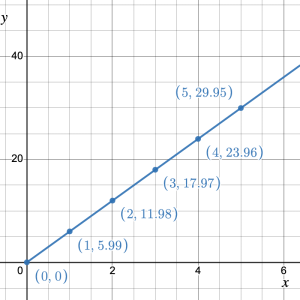
- T
 he -intercept is the point where the line intersects the -axis: (0, 0). The initial value = $0. So the initial value = the -coordinate of the -intercept.
 - To determine the slope, we choose any two points on the line and find the rise and the run. Between (2, 11.98) and (3, 17.97) the rise = 17.97 – 11.98 = 5.99, the run = 3 – 2 = 1. So the slope = rise/run = 5.99/1. The rate is $5.99/1 lb. The slope and the rate are identical.
- At = 2.5,
 15. It is very difficult, if not impossible to read decimal values from a graph (see dotted purple lines). But 2.5 lb of ground beef costs about $15. The exact value is $14.975.
 - When = 20,
 3.4, so we can buy about $3.4 pounds of ground beef for $20 (see dotted red lines). The value is actually 3.339 lb.
Explore 9 – Slope and initial value on the coordinate plane
The graph shows three scenarios. Line 1 represents the cost of wild bird seed  by weight in pounds
  with free shipping. Line 2 represents the sale of wild bird seed with a set shipping charge of $4. Line 3 represents the sale of wild bird seed with a set shipping charge of $10.
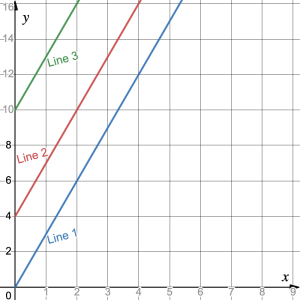
- What are the -intercepts of each line and how do they relate to the shipping charges?
Solution
Line 1 intersects that -axis at (0, 0). The shipping charge is $0. Line 2 intersects that -axis at (0, 4). The shipping charge is $4. Line 3 intersects that -axis at (0, 10). The shipping charge is $10. the -coordinate of the -intercept equals the shipping charge.
- What is the slope of each line and what do the slopes tell us?
Solution
Using points (0, 0) and (2, 6), the slope of line 1 = rise/run = (6 – 0)/(2 – 0) = 3.
Using points (0, 4) and (2, 10), the slope of line 1 = rise/run = (10 – 4)/(2 – 0) = 3.
Using points (0, 10) and (2, 16), the slope of line 1 = rise/run = (16 – 10)/(2 – 0) = 3.
All the slopes = 3. Since slope = rate of change, this tells us that the bird seed sells for $3 per pound.
Since all three lines have the same slope, they all go in the same direction. Such lines are called parallel lines.
Explore 10 – Steepness and slopes
The graph shows two different wages (dollars per hour).
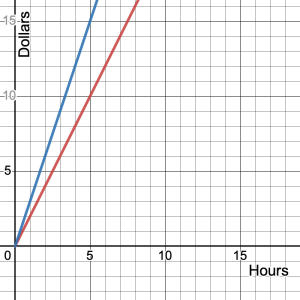
- What are the two wages?
- What are the slopes of the two lines?
- Which one is steeper?
- How is steepness related to slopes?
Solutions
- $2/1 hour, $3/1 hour
- The slope of the blue line is 3/1 or 3, and the slope of the red line is 2/1 or 2.
- The blue line.
- The larger a slope is, the steeper it is.
Explore 11 – Negative Slope
A car’s value decreases each year. The graph shows the value in thousands of dollars of two cars over time .
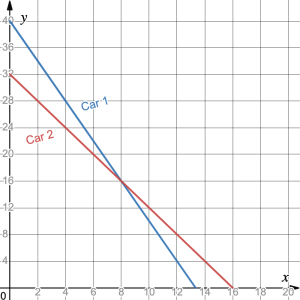
- What are the -intercepts of each line and what do they tell us?
Solution
The line representing the worth of Car 1 intersects the -axis at (0, 40). This tells us that the initial value of Car 1 was $40,000. The line representing the worth of Car 2 intersects the -axis at (0, 32). This tells us that the initial value of Car 2 was $32,000.
- What is the slope of each line and what do they tell us?
Solution
Using points (0, 40) and (4, 28) the slope of the line for Car 1 is rise/run = (28 – 40)/(4 – 0) = –12/4 = –3/1. This tells us that the value of Car 1 is decreasing at a rate of $3000 per year. Using points (0, 32) and (4, 24) the slope of the line for Car 2 is rise/run = (24 – 32)/(4 – 0) = –8/4 = –2/1. This tells us that the value of Car 1 is decreasing at a rate of $2000 per year.
- Where do the two lines intersect? What does this tell us?
Solution
The two lines intersect at the point (10, 16). This tells us that the two cars will have the same value of $16,000 when they are 10 years old.
- Which line is steeper and how is this shown with their slopes?
Solution
The line representing Car 1 is steeper; it falls faster than the line representing Car 2. The slope for Car 1’s line is –3/1. The slope for Car 2’s line is –2/1. The negative slopes tell us that the cars’ values are going down. Since 3 > 2, –3 is more negative than –2, so Car 1’s value is decreasing faster than Car 2’s value.
- Is the initial value of a linear pattern the same as the -intercept on the coordinate plane? Explain your reason.
Show/Hide Answer
Yes. They are the same. The initial value of a linear pattern is where the pattern starts. On the coordinate plane, it is the -intercept where the pattern of points starts.
- What does it mean to have a negative slope on a line?
Show/Hide Answer
A negative slope tells us that the -values are dropping as the -values increase. The line is moving down as we move from left to right. This means that the rate of change is negative.
Practice Exercises
- A mail-order company sells a 3-pack of socks for $15. They have a standard shipping fee of $4.50. a) Create a table of values for 0 to 5 packs of socks then transfer the data points onto a coordinate plane. b) What is the initial value and how does it relate to the plotted points? c) What is the rate of change from the linear pattern and how does it relate to the plotted points? d) What is the independent variable and what is the dependent variable? e) Is the independent variable continuous? Explain your reasoning.
- A cab company has a drop fare of $5 then charges $1.50 per mile. a) Create a table of values for 0 to 20 miles in 4 mile increments then transfer the data points onto a coordinate plane. b) What is the independent variable and what is the dependent variable? c) Can a line be drawn through the data points? Explain your reasoning. d) What is the -intercept and how does it relate to the initial value. e) What is the unit rate of change of the linear pattern? f) What is the slope of the line, and how does it relate to the unit rate of change?
Show/Hide Answers
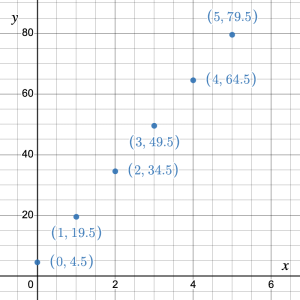
- a)
Number of packs, Cost ($), 0 4.50 1 19.50 2 34.50 3 49.50 4 64.50 5 79.50 b) The initial value of $4.50 (i.e., the shipping cost) corresponds with the point (0, 4.50) on the
-axis. c) Rate of change is $15 per pack and corresponds with the rise/run = 15/1 between two points on the graph. d) Independent = number of packs; dependent = cost e) No. The socks are sold in packs and packs are counted in whole numbers. 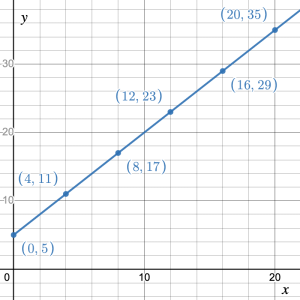 a)
a)
Number of miles, Cost ($), 0 5 4 11 8 17 12 23 16 31 20 39
b) Independent = number of miles, dependent = cost c) Yes, because the variables are continuous. d) -intercept = (0, 5) where $5 is the initial value of a drop fare with no mileage. e) Unit rate of change = $1.50 per mile. f) Slope = 3/2. Since 3/2 = 1.5/1, the slope and the unit rate of change are the same.
 In this section, we will take what we have learned and apply the concepts to new situations.
Perspectives
- The height of a seedling is measured every morning at 9am. The results are shown in the table.
| Day | 0 | 1 | 2 | 3 | 4 | 5 |
| Height (cm) | 1.2 | 1.6 | 2.0 | 2.4 | 2.8 | 3.2 |
a) What is the initial value? b) What is the rate of change? c) Graph the data on a coordinate plane. d) What is the -intercept? e) What is the slope of the line? f) Use the graph to determine the height of the seedling at 9pm on day 3. g) Use your graph or linear reasoning to determine the height of the seedling at 3pm on day 4. h) Will this seedling continue to follow this pattern indefinitely? Explain your reasoning.
- Consider the scenario of a pool being filled with water, where the water level rises by 8 inches each hour. a) What is the initial water level in the pool? b) Determine the rate of change of the water depth? c) Calculate the time it will take to fill the pool to a depth of 4 feet? d) Create a graph depicting the water depth in the pool over time. e) Explain the reason why the graph will deviate from a consistent pattern over time.
- The graph shows the balance of a loan that is paid off at a constant rate.
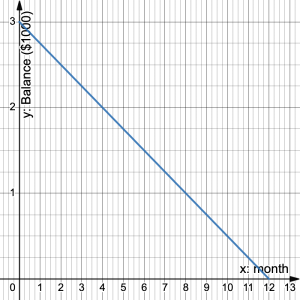
a) What was the original amount of the loan? b) What is the rate of change of the loan balance? c) How much is paid against the loan every month? d) How long will it take to pay off the loan?
- Maya is saving for a trip by putting $150 away every month. She needs to save $3600. a) What is the initial value? b) What is the rate of change on her savings? c) Draw a graph that illustrates this situation. d) How long will it take to save $3600.
Show/Hide Answers
-
- a) 1.2cm b) 0.4cm per day c)
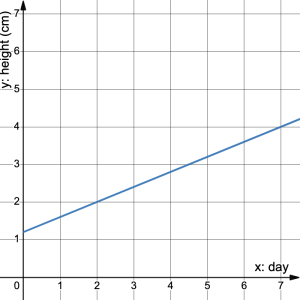 d) (0, 1.2) e) 0.4 or 2/5 f) 2.6cm g) 2.9cm h) No. At some point the seedling will turn into a plant and the growth rate will slow to almost zero
 - a) 0 inches b) 8 inches per 1 hour c) 6 hours d)
 e) The pool will overflow and the water level will stop rising.
 - a) $3000 b) –$250 per month c) $250 d) 1 year
- a) $0 b) $150 per month c)
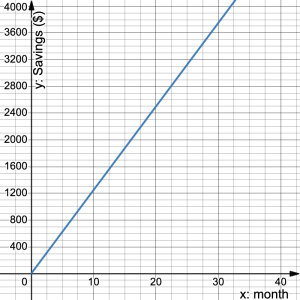 d) 24 months
- a) 1.2cm b) 0.4cm per day c)
 In this section, we will use what we have learned so far to practice skill problems.
Skill Exercises
Determine the initial value and rate of change given the -intercept and slope of the line:
- -intercept = (0, 4); slope = 3
- -intercept = (0, 50); slope = –4
- -intercept = (0, 28); slope = 3/2
- -intercept = (0, 200); slope = –4/5
- -intercept = (0, 0); slope = 5/6
Determine the -intercept and slope of the line given the initial value and rate of change:
- initial value = 20; rate of change = 2/1
- initial value = 9; rate of change = –3/1
- initial value = 4; rate of change = 3/2
- initial value = 2500; rate of change = –5/3
- initial value = 0; rate of change = 4/5
Show/Hide Answers
-
- initial value = 4; rate of change = 3/1
- initial value = 50; rate of change = –4/1
- initial value = 28; rate of change = 3/2
- initial value = 200; rate of change = –4/5
- initial value = 0; rate of change = 5/6
- -intercept = (0, 20); slope = 2
- -intercept = (0, 9); slope = –3
- -intercept = (0, 4); slope = 3/2
- -intercept = (0, 2500); slope = –5/3
- -intercept = (0, 0); slope = 4/5
a systematic and analytical thought process that utilizes a sequential method in solving problems
forming a right (90°) angle
going in the same direction exactly the same distance apart
data that has an infinite number of possible values that can be selected within certain limits
the rise over the run of a graphed line
lines with the same slope
