College of Mines & Earth Sciences
77 Using Automated Seepage Meters to Quantify Surface Water Influence on Hidden Valley Springs
Tyler Yoklavich
Faculty Mentor: Kip Solomon (Geology and Geophysics, University of Utah)
Abstract
Springs in Hidden Valley adjacent to the Jordan River, Bluffdale Utah are used for water supply but their source areas are not known. To quantify possible surface water influence on these springs, novel automatic seepage meters were deployed at regular intervals (15 m) throughout a 400 meter transect of the East Jordan irrigation canal located approximately 45 m to the east of the springs. 256 automatic seepage meter measurements were made in order to estimate a mean groundwater seepage flux (q) in cm/day for the canal. This value, in conjunction with geometric measurements of the canal and previous hydrogeologic evaluations of spring recharge zones, were used to estimate a volumetric seepage rate (Q) from the canal that may be a source of water to the springs. The mean seepage flux (q) for the canal is -0.87 ± 2.14 cm/day. Applying this seepage flux to a 3.4 km reach of the canal that lies within the spring’s presumed recharge zone, and an average canal width of 6.1 ±0.9 m results in a maximum possible volumetric seepage rate of 181.3 ±444.4 m3/day (0.07 ±.18 CFS). The springs have a mean flow of 2,200 m3/day (0.9 CFS), a low flow of 11 m3/day (0.0045 CFS), and a high flow of 8560 m3/day (3.5 CFS). A maximum of 5% of annual spring flow may be accounted for by water loss from the nearby irrigation canal. Traditional differential flow measurements at the site showed no statistically significant seepage from the canal. Thus, the lower resolution traditional measurements are consistent with the higher resolution seepage meter results.
1 – Introduction
Hidden Valley Springs are a collection of developed groundwater springs in the Jordan River Valley near Bluffdale, Utah. They lie approximately 200 m East of the Jordan River, and 45 m West of the East Jordan Irrigation Canal. The canal is approximately 20 m higher in elevation than the springs. The springs are used as a source of drinking water to a nearby Non- Transient Non-Community Water System. The purpose of this study is to investigate the East Jordan Irrigation Canal as a possible water source to Hidden Valley Springs.
The East Jordan Irrigation Canal’s proximity to the springs and location upgradient identifies it as a possible source of spring water. To investigate potential seepage losses, a variety of traditional methods can be employed, the most common of which is differential flow gauging (DFG). DFG entails conducting stream flow measurements at multiple points along the canal’s reach using an ultrasonic flow meter or similar instrument, and comparing measurements to estimate the volume of water being lost or gained due to groundwater interference between measurement points. This is the most commonly used method for measuring stream seepage.
However, these measurements have large associated uncertainties, low spatial resolution, and variations in stream flow that are identified may be related to evapotranspiration or other factors unrelated to direct groundwater interactions. Ultrasonic flow measurements were conducted in line with the southern-most spring, and 1 km downstream, with assistance from Bert Stolp of the United States Geological Survey.
Flow measurements showed a differential of +1.5 CFS, with 55.45 CFS recorded at the upstream location and 56.96 CFS at the downstream location. Propagating the uncertainty reported for each measurement by the Ultrasonic Flow Meter produces an uncertainty of ±2.02 CFS, indicating that the reported difference in streamflow is within the uncertainty of the measurements. The uncertainty is also two times greater than the mean flow of the springs. Error reported by the meter itself is based on calibrations conducted in laboratory conditions during the development of the device. Further uncertainty can be attributed to potential human error during the measurement, relatively few measurements being conducted, and factors aside from direct groundwater influence that are captured by the technique such as evapotranspiration. Hydrologists typically attribute 3-5% error to Ultrasonic Flow measurements, with 3% being the standard for optimal measurement conditions. Conditions for the measurements were not ideal, so attributing 5% error results in an uncertainty of ±2.8 CFS. Both the uncertainty reported by the instrument and that which would be subjectively attributed are much greater than the 0.9 CFS mean discharge of the springs of interest. Therefore, DFG results were considered inconclusive regarding the influence of canal seepage on the springs.
A novel method of quantifying groundwater seepage using automatic meters was developed by Dr. Kip Solomon and colleagues, as described in Solomon et al. (2020). The automatic seepage meters directly measure the vertical specific discharge (q) for soft bottom streams, rivers, and other surface water features. This method has lower associated uncertainties than DFG, since it can record stream stage measurements to a precision of ± .1mm, takes measurements over much larger time-scales, and allows for multiple measurements along a stream transect to be taken simultaneously. Taking a high number of measurements to assess repeatability of results is also feasible with the automatic meters. Since DFG was inconclusive for the East Jordan Irrigation Canal, automatic seepage meters were deployed for greater precision.
2 – Site Description
2.1 – Bedrock and Structural Geology
The Traverse mountains in the vicinity of Hidden Valley Springs consist of Mississippian and Pennsylvanian age bedrock that was intensely fractured and folded by regional compression during the Sevier Orogeny 175 million years ago. The Laramide Orogeny followed, during which bedrock was thrusted eastward and mountains were uplifted in Western Utah. Concurrently, rising sea levels flooded interior North America and created an inland sea, which accumulated sediment eroded from uplifted mountains. The depositional environment transitioned from marine (salt water) to lacustrine (fresh water) to fluvial (river) by early Tertiary time (56 million years ago). Subsequent relaxation of mountain building forces created normal faults and other structural weaknesses in the earth’s crust. The Wasatch Intrusive Belt formed 35- 50 million years ago, with magma rising into subsurface bedrock along structural weaknesses. Basin and Range east to west extension started about 15 million years ago, creating numerous north-south trending normal faults such as the Wasatch Fault. As a result of regional extension, basins formed where sedimentary deposits accumulated, and fault block mountain ranges like the Wasatch and Oquirrh mountains were created. (Biek, 2005a, 2005b)
2.2 – Surficial Geology
The springs are located near the Traverse Mountains, which separates the south part of Salt Lake Valley from the north part of Utah valley. The Jordan Narrows is an incised river valley that bisects the Traverse mountains and contains the Jordan River. The Jordan River flows northward out of Utah lake in Utah Valley, through the Jordan Narrows into the Salt Lake Valley, and terminates at the Great Salt Lake. (Biek, 2005b) The East Jordan irrigation canal is a man- made diversion of the Jordan River that flows in parallel to the river. The canal is generally active from early spring to late fall, and flow is regulated by a series of pumps at the river diversion to maintain consistent levels.
Salt Lake and Utah Valley are composed of Quaternary and Tertiary age valley-fill sediments that were eroded from the surrounding mountains and deposited in the valley. The valley-fill sediments exhibit a wide range of grain sizes, with the coarsest sediments typically found near the mountain front and major drainages, and finer sediments such as clay and silt more prevalent toward the center of the valley. Throughout Quaternary time (the last 2.5 million years), regionally-extensive lakes such as lake Bonneville intermittently filled Salt Lake and Utah Valley. Generally, thick and extensive lacustrine clay and silt deposits accumulated during periods of lake expansion, and coarser deposits accumulated when the lakes contracted. The cycling of lake extent in response to climatic changes over Quaternary time resulted in the current valley stratigraphy of alternating and interfingering layers and lenses of sediment with differing grain sizes. Thus, the valley-fill sediments possess high horizontal and vertical heterogeneity in grain size and hydraulic conductivity. (Loughlin, 2021)
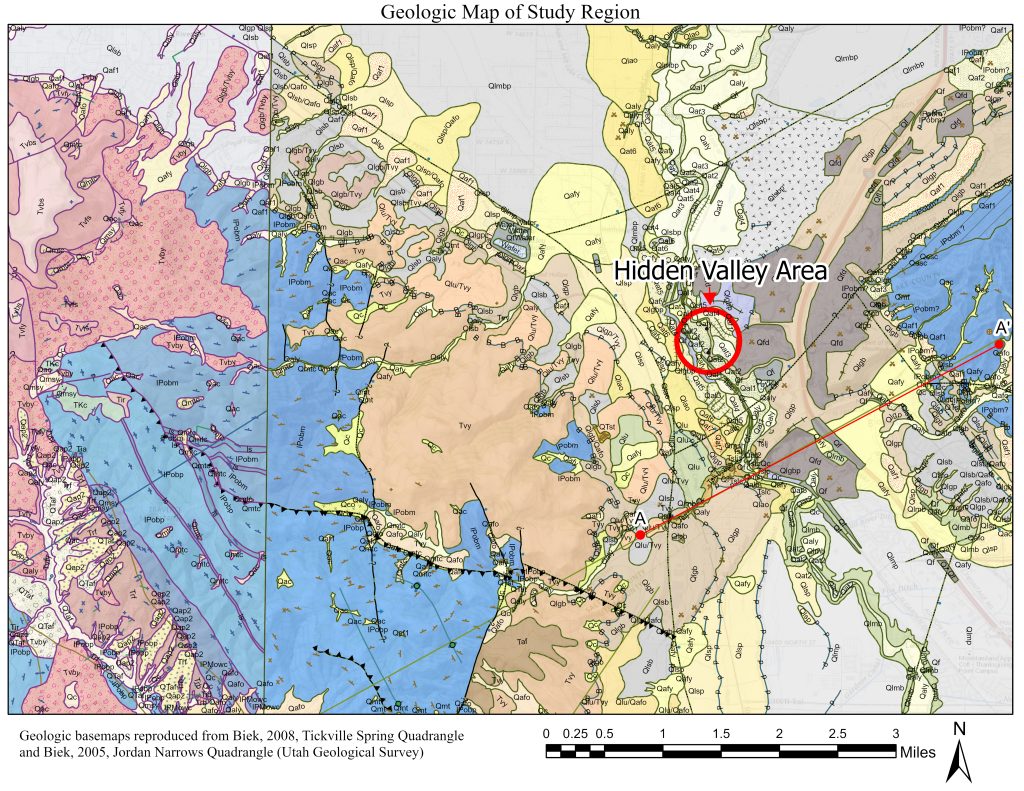 Figure 1. Geologic map of the study region. The springs lie in the Jordan Narrows, Utah 7.5- minute quadrangle. The Jordan Narrows is a river valley that bisects the east and west Traverse Mountains. It is composed of unconsolidated Quaternary deposits of alluvial and lacustrine origin atop Carboniferous bedrock that was folded and fractured by the Sevier Orogeny. Geologic basemaps reproduced from Biek 2005a, and Biek 2008 (Utah Geological Survey).
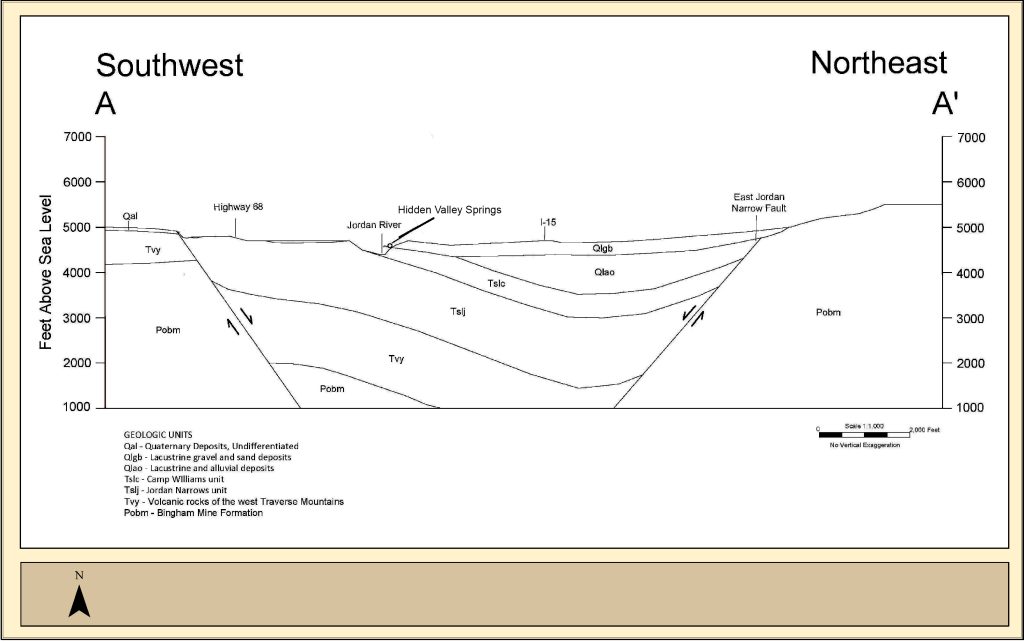 Figure 2. Geologic cross section A-A’. Illustrates the subsurface geology in the vicinity of the springs. The Jordan River Valley is bordered on each side by the Bingham Mine Formation and east-west trending normal faults. Interfingering lenses of lacustrine and alluvial deposits overlie the graben. Reproduced from Biek geologic cross-section, 2005a.
2.3 – Geochemistry
Hidden Valley contains 6 springs in total, with high geochemical variability throughout the system. Previous environmental tracer, stable isotope, and major ion chemistry evaluations showed that Springs A-D possess the “youngest” water, having recharged less than 5 years ago. They also note that the stable isotope signature of water discharging from Springs A-D plots similarly to that of the Jordan River, with a highly evaporated signature. Springs E-F plot on the Local Meteoric Water Line, indicating that their water is derived from precipitation with little evaporation occurring (Solomon, 2021). In response, this study focuses on the irrigation canal as a potential source of water to springs A-D, and assumes that springs D-F have deeper flow paths, older recharge, and are recharged primarily by precipitation.
Solomon (2021) examined the geochemistry of springs A-D and concluded that a mixing of 24% irrigation water with 76% natural groundwater could explain the observed geochemical makeup. However, recent longitudinal sampling has shown that the Jordan River, and in turn the irrigation canal, have high seasonal variability in stable isotope composition and major dissolved ions. Springs A-D have a relatively consistent stable isotope signature that is intermediate among values observed in the Jordan River. This may suggest the river/canal as a primary source of water, with significant dispersion/mixing occurring between recharge and discharge. Seepage analysis serves as a more direct assessment of whether the irrigation canal in the area directly adjacent to the springs is providing water to the springs.
3 – Methods
3.1 – Theory
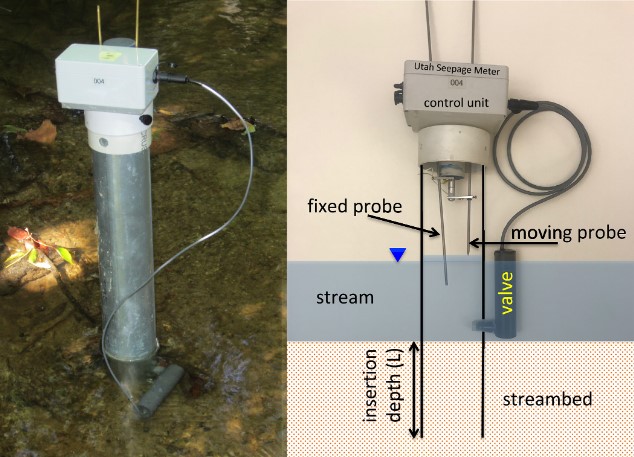
The automatic seepage meters measure the vertical specific discharge (q) of a surface water feature by measuring change in water level over time. A thin-walled tube is driven 30-50 cm into the streambed, and a control unit is affixed to the top of the tube. The tube has a hole below the stream level, where a valve is placed. Before seepage measurements are taken, the valve is set to open, allowing the water level in the tube to equilibrate with the stream stage. The height of the initial stream stage is measured 10 times and recorded. The valve then closes, and the water level in the tube changes (upwards for a gaining stream, downwards for a losing stream) over time. A linear actuator and metal probe within the control unit measures changes in the water level, and writes the data to an SD card within the control unit. Water level measurements are taken every 30 seconds. After a set number of measurements is taken (50 in this case), the valve reopens so that the final stream stage can be measured. The test is then automatically repeated until the meter is manually switched off, or runs out of battery.
Figure 3. Photo and diagram of the seepage meter. The control unit is affixed to the top of a thin-walled tube that is inserted 30-50cm into the streambed. The valve in the side of the tube is initially open, allowing the water level in the tube to match the stream stage. The valve then closes, and the water level in the tube changes (upwards for a gaining stream, downwards for a losing stream) over time. A linear actuator and metal probe within the control unit measures these changes to the water level, and writes the data to an SD card within the control unit. Reproduced from Solomon et al. (2020).
 Evaluating seepage rates is based on combining a water balance equation with Darcy’s law. Once data is extracted from the SD card, a water level vs time graph is generated. Changes in stream stage outside the tubing during the duration of the test are accounted for based on the initial and final stream stage measurements taken by the meter when the valve is open. The slope of the water level vs time graph evaluated at time = 0 is a direct measure of the seepage rate in the stream, and is independent of the hydraulic conductivity of the streambed. A full description of the theoretical basis behind the seepage meter’s design can be found in Solomon et al. (2020).
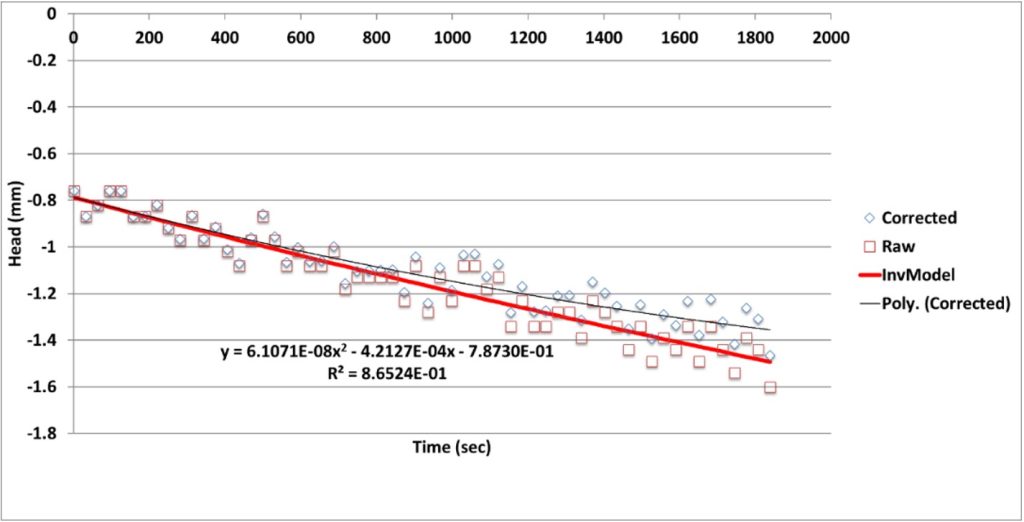
Figure 4. Example data recorded by a seepage meter during a measurement (R3-5). The water level in the tube in mm is plotted against time since the valve opened in seconds. Data points are corrected to account for fluctuations in stream stage throughout the measurement. A polynomial is fit to the data points obtained, and seepage flux (q) is estimated as the slope of the polynomial at t = 0 (-.035 m/day).
3.2 – Study Design
Seepage flux measurements were taken along a 400 m transect of the canal directly adjacent to the springs. A preliminary set of measurements were taken with one seepage meter in the center and one seepage meter near each bank to determine if seepage varied between the canal’s center and edges. The preliminary run showed little variation between measurements, so for the full study all measurements were taken in the center of the canal, equidistant from both banks. For the full study, the first meter was placed directly in-line with spring 1, and subsequent meters were placed at 50 ft (15.24 m) intervals, beginning at the north end of the transect and moving southward. Measurements were taken over the course of 4 non-consecutive field outings, with multiple meters being deployed simultaneously during each field outing. Measurements were taken for 3-12 hours, with some transects being measured continually overnight and others being deployed and collected within the same day. For data presentation, measurement points have been labeled based on the field outing (“run”) they were a part of, and what number the meter was in relation to others. For example, R2-1 was a part of run 2 (the second field outing), and was the northern-most meter in the sequence during that run. Figure 6 presents a detailed map of measurement points in relation to the springs.
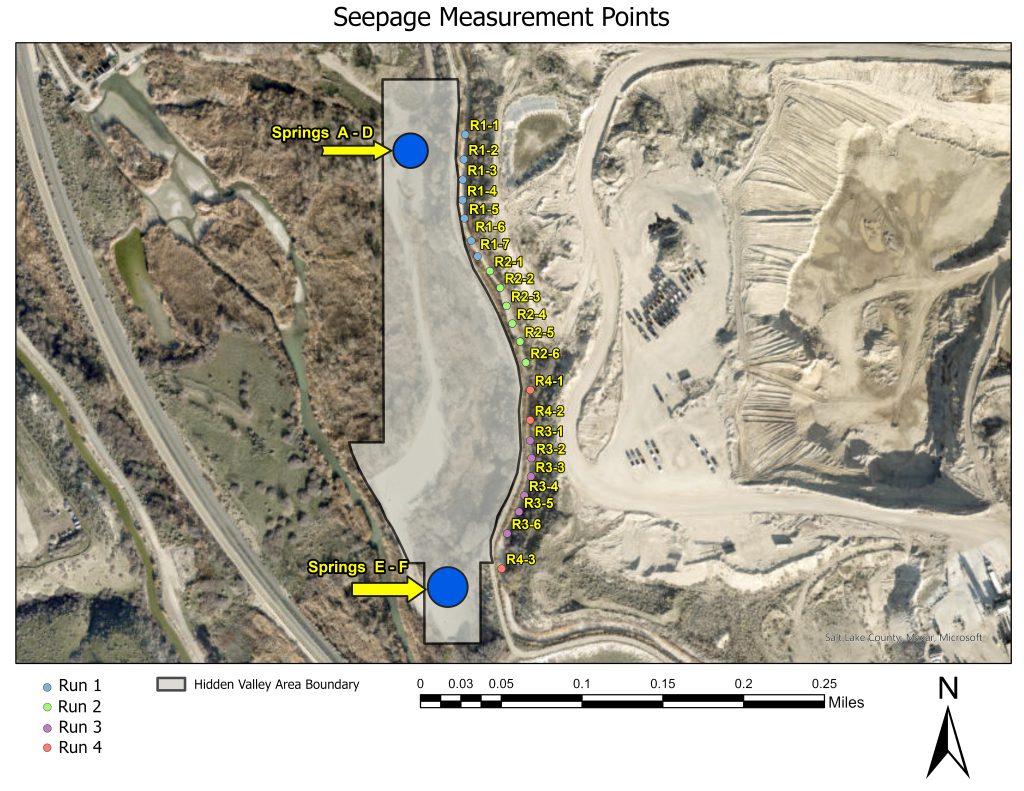 Figure 5. Map of canal measurement points and adjacent springs. Each color group represents points that were measured simultaneously during one field outing. Measurement points were situated in the center of the canal, around 15 meters apart from one another. Seepage measurements were taken throughout the portion of the canal that lies within the Spring’s 3 year time-of-transit zone identified by Horrocks engineers.
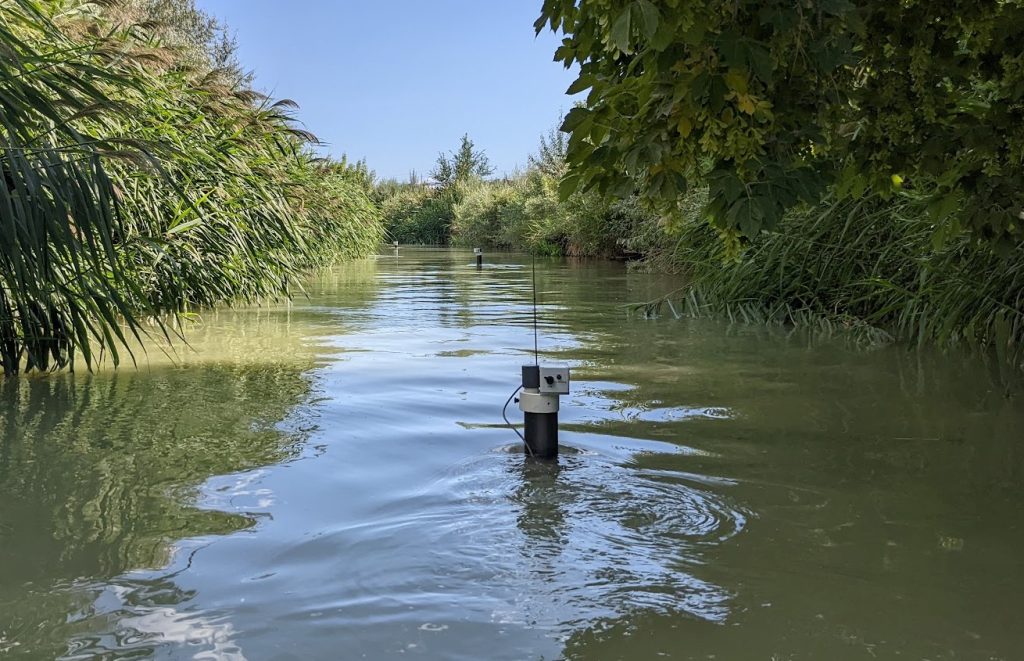
Figure 6. Seepage meters in operation at the field site on the first day of measurements. Measurements were taken over the course of four non- consecutive field outings, with one transect being measured during each outing. Measurements for each transect were taken simultaneously over the course of 2-12 hours.
 4 – Results
4.1 – Mean Seepage Flux (q)
Seepage fluxes were recorded at each measurement point 5-20 times depending on the time available for each field outing. Each measurement point produced an average seepage flux (q), with attributed uncertainty taken as the standard error of all measurements made at that point. The total representative seepage flux for the canal is obtained by calculating the arithmetic mean of all measurement point fluxes. Overall uncertainty is obtained by propagating the standard error of each measurement point average through the overall average calculation. The representative canal seepage rate was -0.87 ±2.1 cm/day, meaning that on average throughout the study area 0.87 cm of water height was lost per day to the ground. Spatial variability was greater than the mean seepage value, but was still quite small, with only 9.1 cm separating the highest and lowest seepage value recorded.
Table 1. The mean seepage flux obtained from each meter, and associated uncertainty values. Each meter performed multiple tests at the same measurement point. Mean seepage flux is the arithmetic mean of flux values recorded at that individual point over the measurement period (typically 5-7 hours). Uncertainty is calculated by taking the standard error of each measurement, and propagating that uncertainty through the averaging of fluxes at that point. Note: R3-1 produced anomalous results, and has been omitted. The overall representative seepage flux for the canal is obtained by calculating the arithmetic mean of all measurement point fluxes. Overall uncertainty is obtained by propagating the standard error of each measurement point average through the overall average calculation, and multiplying the standard error by 2.96 to produce a 95% confidence interval.
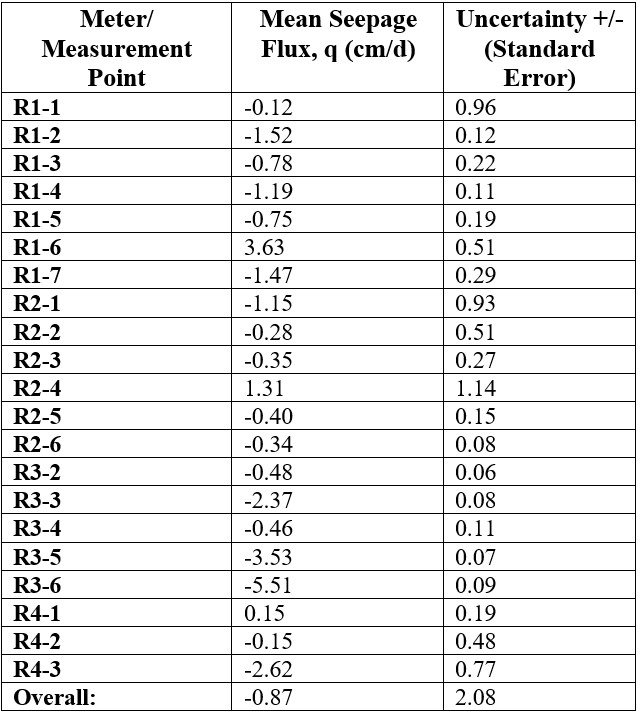
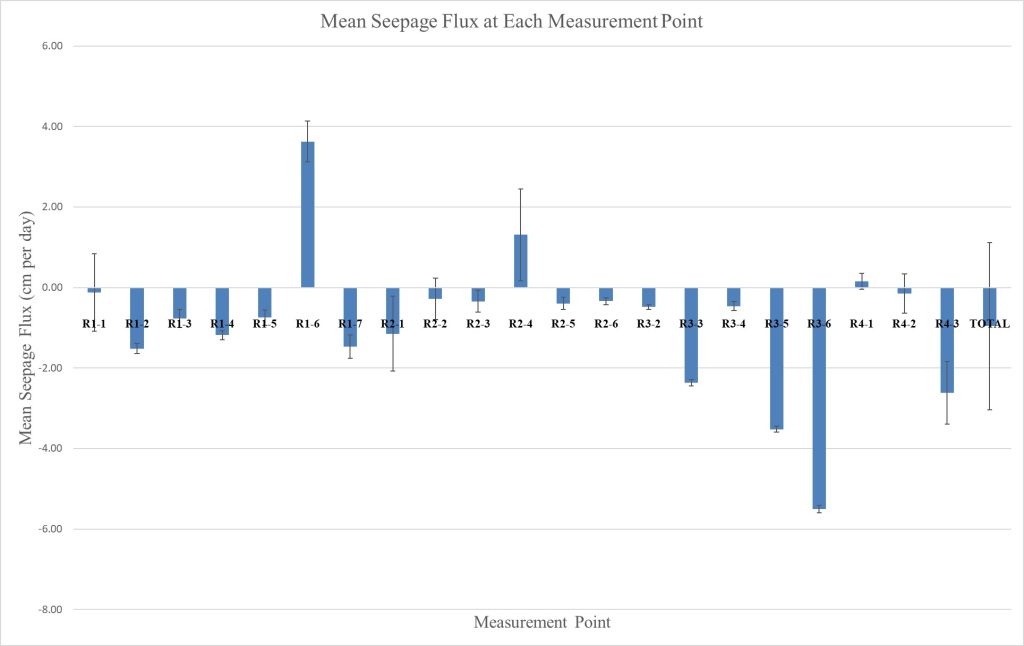
Figure 7. Mean seepage flux for each measurement point along the study reach. While some measurement points recorded a positive (gaining) seepage value, a majority of measurement points demonstrated a small amount of negative (downward) seepage. The two points with upward flow may be the result of hyporheic flow, wherein water that has seeped from the canal further upstream discharges back into the canal. Uncertainty, obtained from the standard error calculation above, is presented as error bars.
4.2 -Volumetric Seepage Rate(Q)
To estimate the volumetric seepage rate from the canal and into Hidden Valley Springs (Q), the area of canal within the springs presumed recharge zone is multiplied by the representative seepage flux (q). A spring delineation performed by Horrocks engineers in 2021 identified the recharge zone to extend several kilometers east into the Traverse mountains, and a few kilometers south of the springs. ArcGIS was used to measure the length of canal within the recharge zone, 3400 m. 3% error (±102 m) was attributed to the length measurement. ArcGIS was used to measure the width of the canal, which was found to be 6.1 m on average. 15% error (±.92 m) was attributed to the width measurement to account for places in the canal’s reach that were more wide or narrow than average. Multiplying the canal area by the representative seepage rate for the canal (.0087 ± .021 m/day) and propagating associated uncertainties yields a volumetric seepage rate of 181.3 ± 444.4 m3/day (0.07 ±.18 CFS). Assuming the irrigation canal is operational for 6 months per year produces an annual seepage volume of 3.32 X 10⁴ m3/year.
4.3 – Estimating Proportion of Spring Flow due to Seepage
The proportion of flow through springs A-D that may be attributed to canal seepage is estimated by comparing the total annual flow through the springs in 2021 to the estimated annual seepage volume. Flow data from 2021 was utilized since it is the highest resolution annual flow data on record. Applying 181.3 m3/day as the volumetric seepage rate (Q) and assuming the typical yearly canal runtime from April 15th to October 15th (183 days), yields an annual seepage volume of 3.32 X 10⁴ m3/year. The 2021 total annual flow through Springs A-D was 6.38 X 10⁵ m3/year. Dividing the seepage input by the total flow yields 5.2%. This indicates that a maximum of 5% of spring flow can be accounted for by seepage losses from the nearby canal. Several assumptions are made in this calculation regarding spring recharge, groundwater flow paths, and spatial/temporal uniformity, discussed below.
5 – Discussion
5.1 – Assumptions and Limitations
Estimating the proportion of spring flow that is due to seepage losses from the canal involves several assumptions. Firstly, the presumed recharge area identified by Horrocks engineers may be disparate from the true recharge zone due to subsurface heterogeneity and the presence of fractured bedrock in the vicinity of the Traverse mountains. It is also unlikely that all canal seepage within the recharge zone discharges at springs A-D, since some likely discharges at the Jordan River and other seeps in the area. Further subsurface characterization, such as the installation of groundwater monitoring wells to contour hydraulic head would be necessary to determine more precise flow paths in the area. The canal also has relatively high spatial heterogeneity in seepage, and it is possible that locations further along the canal’s course may have higher or lower seepage rates than that identified in this study. Assessing temporal variability in seepage was outside the scope of this study, but since the canal is dry for the winter, refilled in the spring, and fully saturated throughout the summer, it is possible that seepage rates vary throughout the irrigation season. The higher than typical statistical noise recorded during this study also increases the uncertainty associated with the estimates considerable. Due to these assumptions and limitations, the 5% estimate is considered the maximum possible proportion of spring flow that may be attributed to the canal
Data recorded by seepage meters during this study generally possessed higher uncertainty and statistical noise than in previous field applications. After noting the high uncertainty in data from the first few field outings, plastic hand screws were used to affix the meter’s housing to the metal tubing more securely. This reduced statistical noise in future tests, but did not fully remediate the high uncertainty. Potential sources of higher than typical variability include vibrations from the gravel mining operations and freeway nearby. Future seepage meter application in the area could emphasize reducing statistical noise to produce a lower uncertainty analysis.
The third transect of the canal that was measured (run 3) produced significantly lower uncertainty and statistical noise than runs 1, 2, and 4. The average seepage rate for run 3 was also larger than other runs, at -2.5 cm per day ±.18 cm. Applying this seepage rate to the full 3.4 km reach of the canal within the springs recharge zone, and propagating the associated uncertainty results in a volumetric seepage rate of 512.1 m3/day ±87.4 m3/day (0.21 ±.04 CFS). This discharge value is within with the uncertainty range of the discharge rate calculated for the whole canal (0.07 ±0.18 CFS), demonstrating parity between the higher certainty run and the overall study results. The canal reach measured in run 3 has the highest seepage rate of any transect in the study, and provides a snapshot of the upper end of seepage variability throughout the canal.
5.2 – Statistical Analysis
Simple statistical analysis was applied to study results to estimate the uncertainty attributed to the seepage data. Since a high number of measurements were conducted at each measurement point, the standard error of seepage values recorded at each point was utilized as uncertainty. The standard error is appropriate, as it allows the repeatability of seepage values to determine how representative measurements were of the true mean seepage. Uncertainty was propagated through all calculations conducted including averaging to determine mean flux at each point, averaging to determine the total representative seepage rate, and multiplication to turn the mean specific discharge value into a volumetric seepage rate. The uncertainty in total mean seepage rate, calculated via the standard error, was multiplied by 1.96 to produce a 95% confidence interval, meaning there is a 95% chance that the value range presented includes the true mean seepage rate throughout the study area.
The goal of this study was to identify whether the canal is a primary source of water to Hidden Valley Springs. While these estimates contain inherent assumptions and uncertainties, it is very likely that true seepage is of similar magnitude to what this study estimates. Thus, it is unlikely that the canal is a primary source of water to the springs.
6 – Summary & Conclusions
Novel automatic seepage meters were applied to an irrigation canal in Bluffdale, Utah in order to evaluate canal seepage as a source of recharge to the Hidden Valley springs. The seepage meters provide: (1) An estimate of the representative seepage flux for the canal (q), (2) an estimate of the annual volumetric seepage flux (Q), and (3) quantify the potential influence of canal seepage losses on nearby springs.
The mean seepage flux for the canal was -0.87 ±2.1 cm/day. Applying this seepage flux to a 3.4 km reach of the canal that lies within the spring’s recharge zone, and an average canal width of 6.1 ± 0.9 m, results in a maximum possible volumetric seepage rate of 181.3 ± 444.4 m3/day (0.07 ± 0.18CFS). Assuming 6 months of canal runtime (April 15th-October 15th), this would result in an annual volumetric seepage of 33,200 m3. Springs A-D have an annual flow of 638,000 m3, which indicates that a maximum of 5% of annual spring flow may be accounted for by seepage losses from the canal. It is unlikely that all canal seepage to groundwater in the 3.4 km transect enters the springs, so this estimate is considered an absolute maximum.
The 2021 Hidden Valley Springs Geochemistry study noted that the seasonal uniformity in stable isotopes for Spring A, along with the high seasonal variability in Jordan River stable isotopes means that substantial dispersion may be occurring between recharge and discharge for spring A. This suggests that spring water may be taking a longer flow path than that necessary to discharge from the area evaluated in this study. In the future, it may be useful to take seepage measurements much further south along the canal’s reach in order to determine if seepage is higher in those areas. High canal seepage further upstream may explain why the geochemical makeup of springs A-D suggests Jordan River water as a primary source despite low seepage occurring directly adjacent to the springs. Discussing this study with the East Jordan Canal Company may help determine whether the entire canal has been lined with clay to prevent seepage, or if some areas upstream have been left unsealed.
Although measurable seepage from the canal does occur in the study area, seepage losses are unlikely to be a primary contributor of flow to the springs. These results imply that it is not necessary to make the irrigation canal a primary consideration in Drinking Water Source Protection plans for the springs. Rather, potential primary spring contamination vectors include subsurface pollution within the spring’s recharge zone, which extends east of the springs, throughout the adjacent gravel/sand mining operations, and into the East traverse mountains.
Bibliography
[1] Biek, R.F., 2005a, Geologic Map of the Jordan Narrows Quadrangle, Salt Lake and Utah Counties, Utah: Utah Geological Survey Map 208, Map scale 1:24:000.
[2] Biek, R. F, 2005b, The Traverse Mountains; New Geologic Maps and Explosive Suburban Growth. Utah Geol. Miner. Surv. Notes, 37(1), 1-5.
[3] Robert F. Biek, 2008, Geologic map of the Tickville Spring quadrangle, Salt Lake and Utah Counties, Utah. M-214dm. UGS. 1:24,000 scale.
[4] Bowen Collins and Associates, (2021) Camp Williams Water Source Report, Consultant’s report prepared by BC&A for UTNG ERM
[5] Bowen Collins and Associates, (2021) Hidden Valley Springs Geochemistry Study, Consultant’s report prepared by BC&A for UTNG ERM
[6] CH2MHill, (2003) Delineation Report associated with Drinking Water Source Protection Plan for Hidden Valley Springs: Consultant’s report prepared by CH2MHill of Salt Lake City, UT for UTNG ERM
[7] Loughlin W., (2021) Updated Delineation Report for DWSP For Hidden Valley Springs Nos. 1 Through 6. PWS No. Utah18054, Consultant’s report prepared by Loughlin Water Associates for UTNG ERM
[8] Solomon, D. K., Humphrey, E., Gilmore, T. E., Genereux, D. P., & Zlotnik, V. (2020). An automated seepage meter for streams and lakes. Water Resources Research, 56(4), e2019WR026983.
[9] Solomon, D. K. (2016). Analysis of Environmental Tracers in Hidden Valley Springs, Letter report to Bowen Collins & Associates, Dec. 2016.
[10] Solomon, D. K. (2021). Continued Analysis of Environmental Tracers in Hidden Valley Springs, Letter report to Bowen Collins & Associates, Feb. 2022
Appendix A: Raw Data Recorded in Study
For future reference, the raw .txt files recorded by seepage meters during this study have been archived online. They can be accessed on the Harvard Dataverse online data repository with this link.
