The John and Marcia Price College of Engineering
19 Engineering Meets Photography Through Vitamin C and Silver
Abigail Stringfellow
Faculty Mentor: Roseanne Warren (Mechanical Engineering, University of Utah)
Background
Recently, Professor Joe Marotta from the Department of Art & Art History pressed a lily onto a piece of photopaper, then developed it, without light exposure through the process. When a permanent image remained, he and Professor Roseanne Warren from the Department of Mechanical Engineering determined that it occurred due to the chemical reaction between the silver in the photopaper and the L-ascorbic acid (vitamin C) in the flower. Though ascorbic acid has been used as a developing agent for light-exposed silver-based paper before, Professor Marotta and Professor Warren’s findings are the first to show this result in the absence of light [1, 2]. L-ascorbic acid is widely used industrially and commercially. Among its uses are as an additive or preservative in food, a medical treatment, a measurement of quality in produce, and a crop spray in agriculture [3-6]. Due to the many applications of ascorbic acid, ascorbic acid detection methods are in demand in both consumer and industrial markets. Approaches to detection include, among others, titration [7], fluorescence [8], and electrochemical [4]. Out of the current options, none are low-cost, and most use specialized equipment, making them unsuitable for the average consumer. This project investigates the chemical reaction between ascorbic acid and silver halides with the aim to develop a low-cost ascorbic acid concentration sensor. In the past weeks, I have determined a preliminary grayscale to use in the sensor, which relates ascorbic acid concentration to image darkness. Type of photopaper, time between application and development, pH of solution, addition of copper ions, and ascorbic acid concentration were experimented with in this model.
Methods
Using the statistical analysis program JMP, I produced a Design of Experiment based on these five factors. In each test, 35 milliliters of pH buffer four, seven, or ten was added to 100 milliliters of deionized water. Between four and eight grams of ascorbic acid was stirred in. A ratio of between 0:1 to 1:1 of cupric sulfate to ascorbic acid was included in each solution. Solution pH was recorded using a pH meter. Each solution was applied to one of three types of Ilford photopaper—Multigrade Resin Coated (RC), Multigrade Fiber Based (FB), and Ilfospeed Resin Coated (IS)—using a needleless syringe. After being left without light exposure, the tests were developed after two, four, or six hours. Following development, each test was scanned and evaluated using the program ImageJ, which gave a grayscale score 0 to 255, with 0 as black and 255 as white. Tests 11, 18, and 22 (Fig 1-3 respectively) are shown below to show typical outputs of the experimental runs. A range of gray values can be seen alongside the added calibration black and white strips, which were added in ImageJ post-scan to standardize the tests.

Results
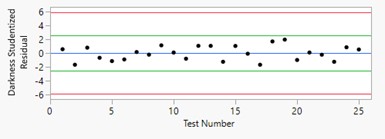
Below, the data for all 25 tests is shown (Table 1). A regression line model “Experimental Darkness versus Predicted Darkness” was run in JMP, which is also shown below (Fig 4). The blue line is the mean of the data points, while the red line is the regression line. With a coefficient of determination of 0.89 and a p-value of 0.1035, this regression model explains 89% of the variation in experimental darkness from the predicted. There is a probability of 0.1035 that these results would have occurred at random. None of the data points are outliers, as the studentized residual graph shows (Fig 5). Overall, the model fits the data fairly well, but with further testing, it could be strengthened.
Table 1
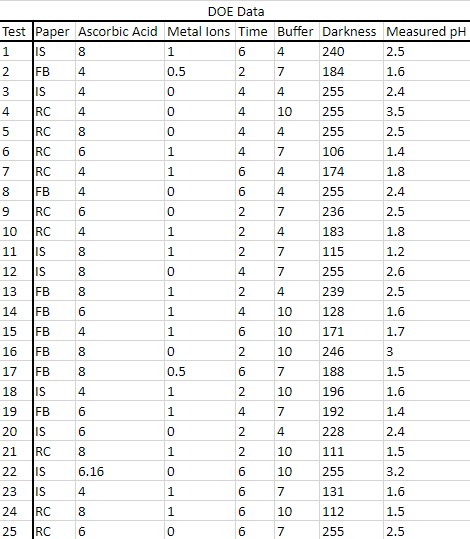
Figure 4
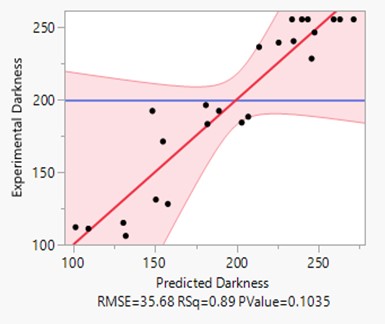
Figure 5
The model “Measured pH versus Calculated pH” is also given below (Fig 6). As can be seen in the data table, all measured pH values were between 1.2 and 3.5, despite the addition of pH buffers to change the pH of the solutions further. This graph, where the theoretical pH of each solution is graphed against the measured value, shows evidence that the pH buffers were not strong enough to effectively change the pH of the solutions to higher values. Therefore, one of the next steps for the project is to calculate the necessary added amount of a stronger buffer that would be needed to effectively test solutions with higher pH, such as 7 or 10.

The graph below shows the modeled quadratic line of fit for “Darkness versus Measured pH” (Fig 7). This line of fit shows promising results for relating a solution’s pH to its darkness, as the coefficient of determination shows that 81% of the variation in the darkness can be explained by the measured pH from this model. Additionally, the series of graphs of “Darkness versus Ascorbic Acid Concentration,” split into three graphs based on time between application and development, show that leaving tests for four hours presents a quadratic model where ascorbic acid explains 84.6% of the variation in darkness (Fig 8). The fact that the models for two and six hours have much less accountability (r2 = 0.193 and 0.339 respectively), however, brings up the question of why the four-hour range developed with more predictability. Running further tests in this time range would be recommended to investigate these results.


Conclusion
In the coming months, a secondary experiment should be run to strengthen these results. This grayscale relates ascorbic acid solutions with different chemical pH buffers to the darkening of silver halides. Therefore, the next experiment should use liquids that would realistically be measured in the sensor, such as juices, beverages, crop sprays, or medicines. This next DOE should use a time of four hours based on the results of “Darkness versus Ascorbic Acid Concentration.” Additionally, the Multigrade Fiber-Based (FB) photopaper should be excluded from further tests, as it curled, yellowed, and was generally harder to work with in the darkroom. As the regression lines for Darkness versus Ascorbic Acid Concentration and Darkness versus Measured pH are refined, they will be used for the sensor to determine ascorbic acid content from the darkness of the sample.
Acknowledgements
This work was supported by SPUR from the Office of Undergraduate Research at the University of Utah awarded to Abigail Stringfellow. I would like to acknowledge and thank Professor Roseanne Warren, Professor Joe Marotta, and Christopher Woodward for their work on this project and for their help in determining methods to carry out this experiment. This project is funded by the University of Utah Faculty Small Grant Program.
Bibliography
[1] C. E. Bills, “Ascorbic acid (vitamin C) and photographic developing action,” Science, vol. 81, no. 2097, pp. 257-258, Mar. 1935.
[2] T. H. James, “Ascorbic and iso-ascorbic acids as photographic developing agents,” J Am Chem Soc, vol. 66, no. 1, pp. 91-94, Jan. 1944.
[3] J.-A. López-Pastor, A. Martínez-Sánchez, J. Aznar-Poveda, A.-J. García-Sánchez, J. García-Haro, and E. Aguayo, “Quick and cost-effective estimation of vitamin C in multifruit juices using voltammetric methods,” Sensors-Basel, vol. 20, no. 3, pp. 676-690, Jan. 2020.
[4] P. J. O’Connell, C. Gormally, M. Pravda, and G. G. Guilbault, “Development of an amperometric L-ascorbic acid (vitamin C) sensor based on electropolymerized aniline for pharmaceutical and food analysis,” Anal Chim Acta, vol. 431, no. 2, p. 239-247, Mar. 2001.
[5] J. T. B. Collie, R. F. Greaves, O. A. H. Jones, G. Eastwood, and R. Bellomo, “Vitamin C measurement in critical illness: challenges, methodologies and quality improvements,” Clin Chem Lab Med, vol. 58, no. 4, pp. 460-470, Apr. 2020.
[6] Allahveran, A. Farokhzad, M. Asghari, and A. Sarkhosh, “Foliar application of ascorbic and citric acids enhanced ‘Red Spur’ apple fruit quality, bioactive compounds, and antioxidant activity,” Physiol Mol Biol Plants, vol. 24, no. 3, pp. 433-440, May 2018.
[7] L. Suntornsuk, W. Gritsanapun, S. Nilkamhank, and A. Paochom, “Quantitation of vitamin C content in herbal juice using direct titration,” J. Pharm. Biomed. Anal., vol. 28, no. 5, pp. 8490855, Jun. 2002.
[8] X. Wu, Y. Diao, C. Sun, J. Yang, Y. Wang, S. Sun, “Fluorometric determination of ascorbic acid with o-phenylenediamine,” Talanta, vol. 59, no. 1, pp. 95-99, Jan. 2003.
