School of Medicine
55 Loss of Soluble (Pro)Renin Receptor Attenuates Kidney Injury and Fibrosis in Unilateral Ureteral Obstruction
Dhruvan Gopinath and Nirupama Ramkumar
Faculty Mentor: Nirupama Ramkumar (Internal Medicine, University of Utah)
Abstract
The prorenin receptor (PRR) is a recently discovered component of the Renin-Angiotensin-Aldosterone System (RAAS) that is involved in the maintenance of kidney function and blood pressure. Cleavage of the extracellular domain of the (pro)renin receptor yields a soluble fragment termed soluble PRR (sPRR). We previously demonstrated that loss of sPRR attenuates angiotensin-II-induced hypertension and kidney injury. To further characterize the role of sPRR in chronic kidney disease and fibrosis, we used an experimental model known as unilateral ureteral obstruction (UUO) to induce kidney disease in male wild type and mutant mice with loss of sPRR. UUO surgery was performed, and mice were followed for 3-day or 7-day time periods. Markers of kidney injury, fibrosis, and kidney inflammation were examined by qRT-PCR and kidney fibrosis by Picro Sirius Red staining. Our results showed that 1) UUO mice had markedly increased expression of markers of kidney injury, inflammation and fibrosis compared to Sham at 3 and 7 days following UUO; 2) loss of sPRR attenuated gene expression of fibronectin and Monocyte Chemoattractant Protein-I (MCP-I) with a trend toward lower expression of Kidney Injury Molecule-1 (KIM-1), Collagen-I (COL-I) and Vascular Cell Adhesion Molecule-I (VCAM-I), compared to WT UUO mice; 3) no differences were observed in expression of Tumor Necrosis Factor (TNF-α), Transforming Growth Factor Beta (TGF-β), and Interleukin-6 (IL6) between WT and mutant mice that underwent UUO; 4) At 7 days following UUO, all markers were similar between WT and mutant UUO mice. Additionally, Sirius Red staining showed reduced fibrosis in mutant UUO mice compared to WT UUO mice. Thus, loss of sPRR had acute kidney protective effects in UUO at 3 days but not 7 days. Further studies are needed to examine the effect of sPRR in kidney disease and fibrosis.
Keywords: soluble (pro)renin receptor, kidney injury, fibrosis, chronic kidney disease
Introduction
Chronic kidney disease (CKD) has emerged as a leading cause of death in the 21st century (Kovesdy, 2022). Estimates show that as many as 843 million individuals are affected by CKD stages 1-5 worldwide. This is largely in part due to an increased prevalence of risk factors such as obesity, diabetes, and hypertension. Additionally, moderate to severe CKD patients have greatly increased mortality, primarily due to cardiovascular disease (CVD) (Jankowski et al., 2021). Between 40-50% of Stage 4 and End Stage Renal Disease (ESRD) patients result in cardiovascular mortality, thus, improved treatment of CKD can reduce the prevalence of CVD. C KD is defined as the presence of kidney damage or loss of estimated glomerular filtrate rate (GFR) of <60 mL/min per 1.73 m2 for more than three months (Levey & Coresh, 2012). It is commonly regarded to be a silent killer; the vast majority of patients remain asymptomatic until CKD is severely progressed. Thus, CKD is diagnosed solely through routine screenings (blood tests, or urinary dipstick) (Webster et al., 2017). While there is no cure for CKD, interventions include treatment of risk factors such as diabetes, hypertension, irregular solute balance, irregular hormone balance, and high cholesterol. Further, dietary or lifestyle changes are often helpful in improving kidney longevity. Unfortunately, these treatments do not provide a definitive solution to CKD, thus, further research is needed to identify potential targets for the detection, and treatment of chronic kidney disease.
The renin-angiotensin-aldosterone pathway (RAAS) is an important mediator of arterial blood pressure (BP), sodium balance, and extracellular volume in the body (Fig. 1) (Patel et al., 2017). In this system, Angiotensinogen is secreted by the liver and is converted by renin to Angiotensin I. Angiotensin I is then converted by Angiotensin-Converting Enzyme (ACE) to Angiotensin II (Ang-II). Ang-II is the ultimate effector of the RAAS pathway. Over or under-regulation of Ang-II can alter blood pressure, sodium and fluid balance in the body. Further, drugs targeting the RAAS are the mainstay of treatment of hypertension and CKD ( Pohl et al., 2005).
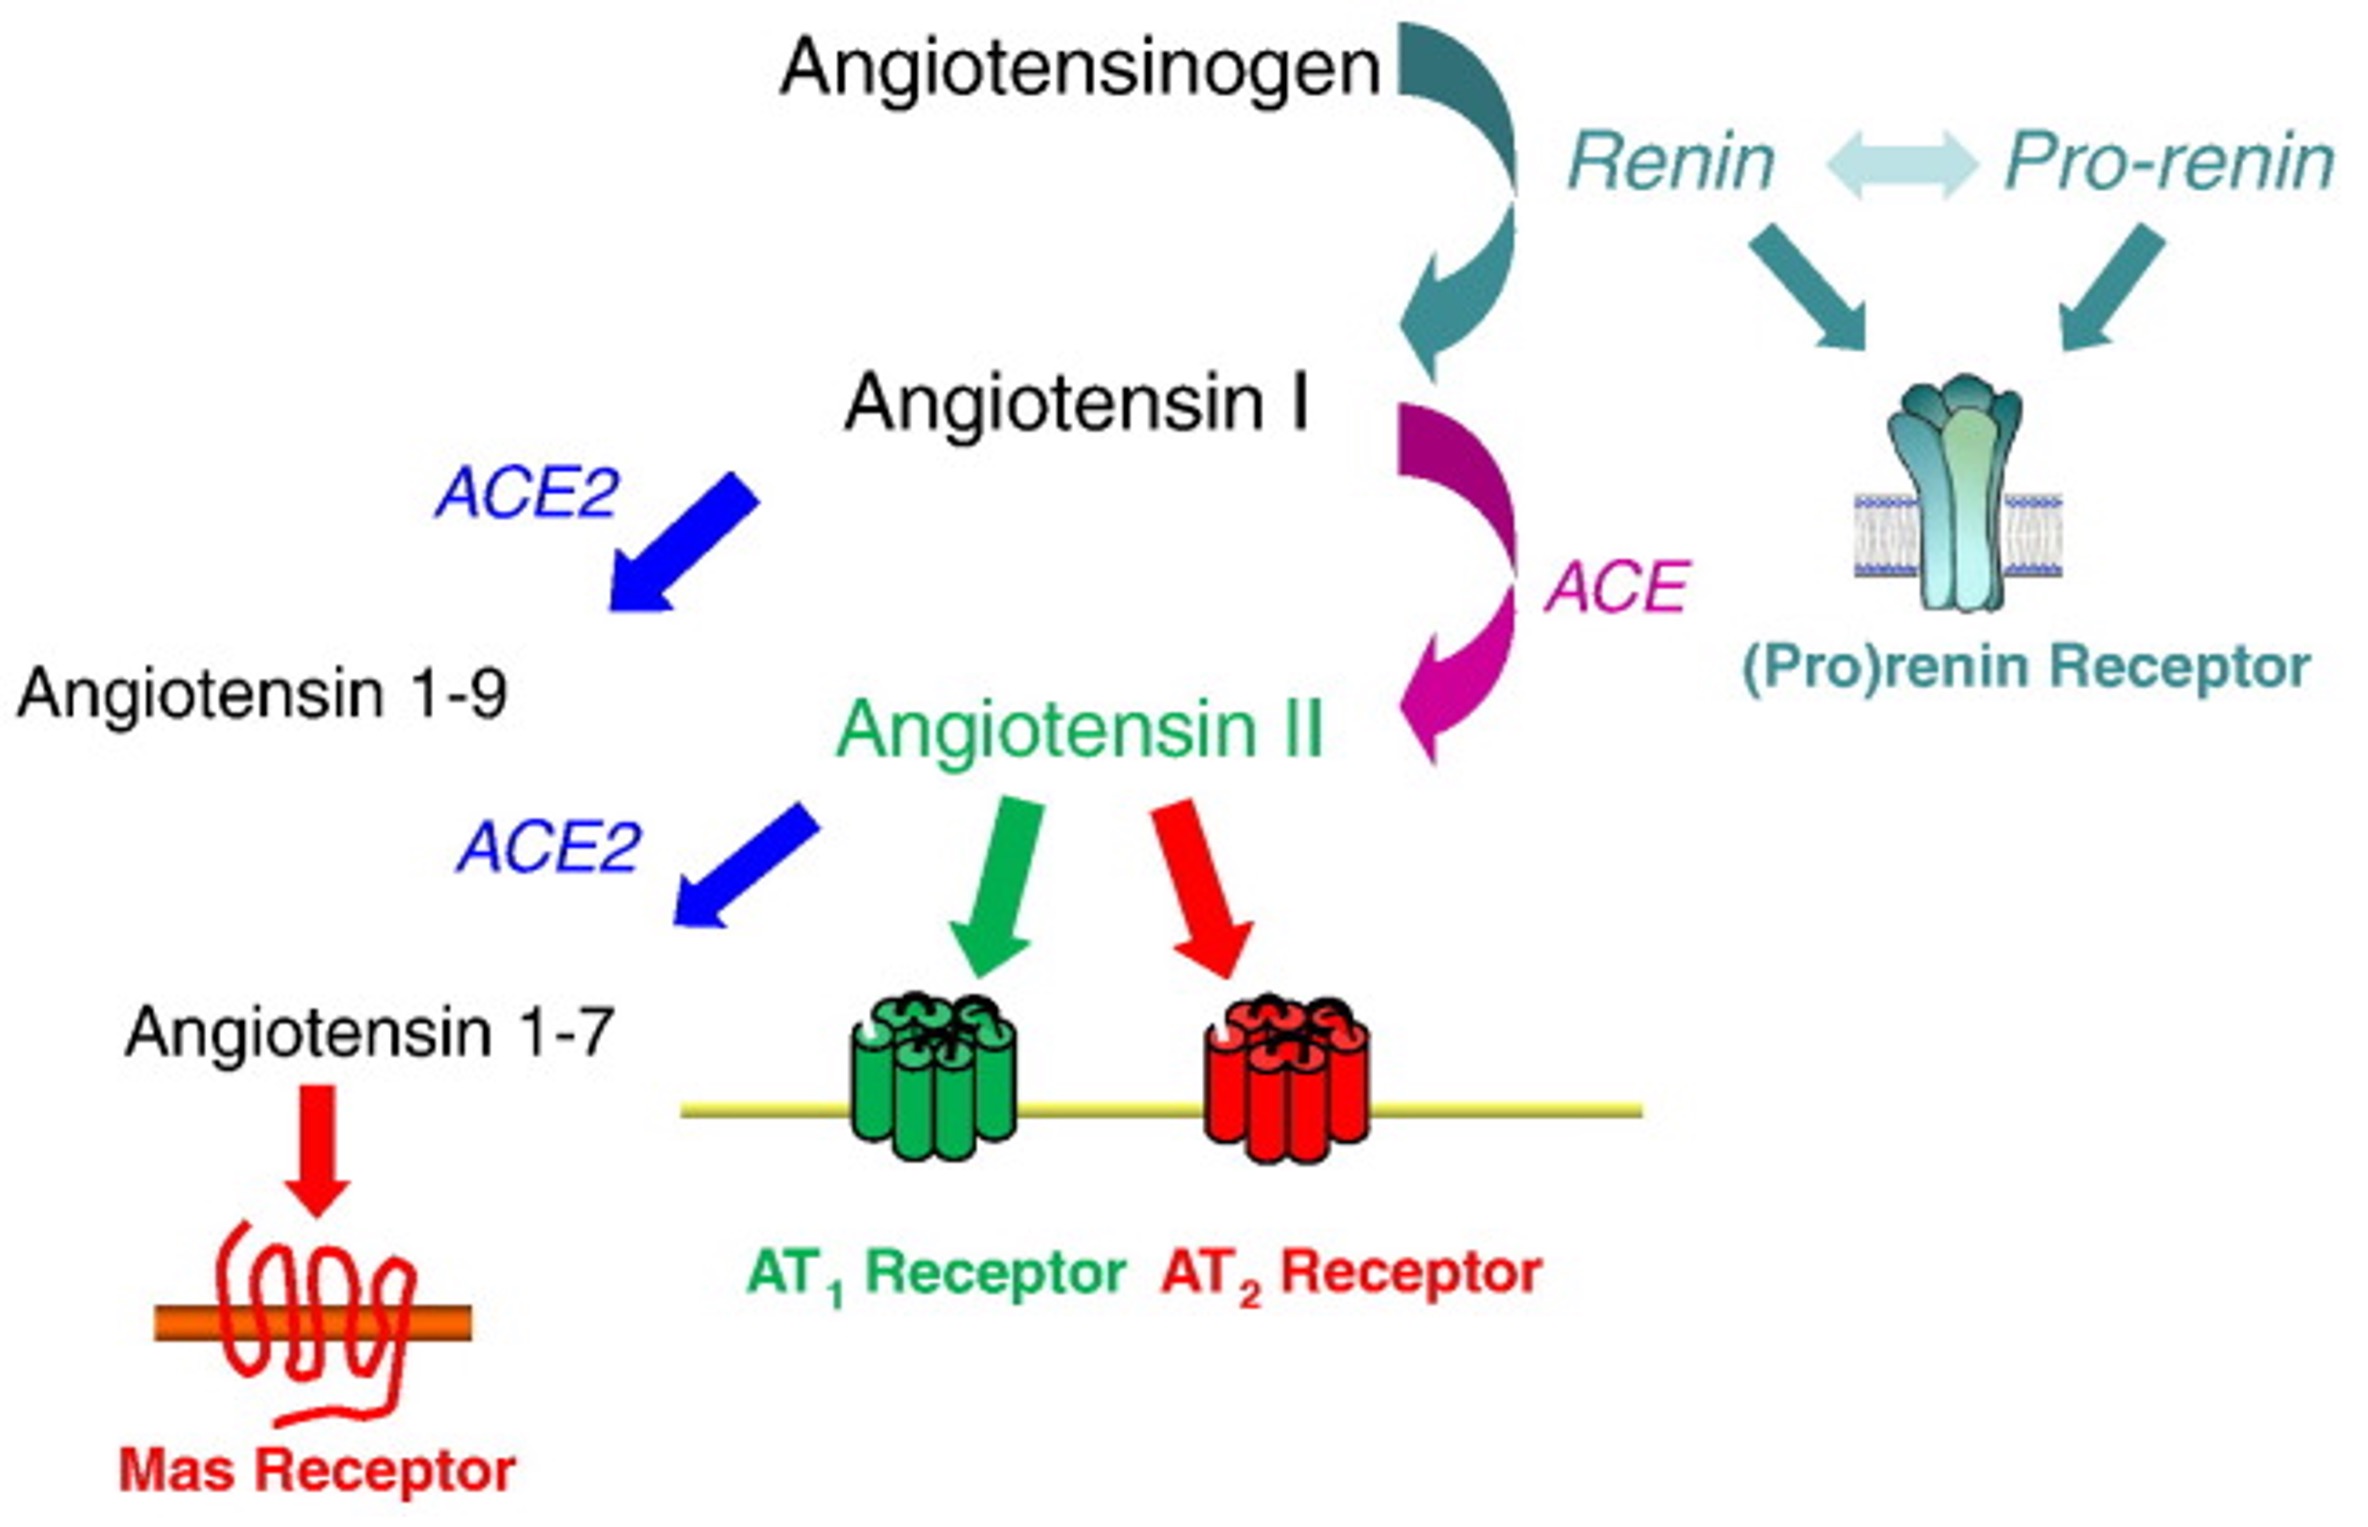 Fig. 1. Schematic of the renin-angiotensin-aldosterone system (RAAS) pathway (Crowley SD, Coffman TM. Expr Res, 2012)
The pro renin receptor (PRR) is a recently discovered component of the renin-angiotensin-aldosterone system (RAAS) (Fig. 2) (Danser & Deinum, 2005; Nguyen & Muller, 2010). PRR binds to prorenin, causing the non-proteolytic activation of prorenin. This enables it to cleave angiotensinogen. Renin, when bound to the PRR, has a four-fold greater catalytic efficiency when cleaving angiotensinogen. These both lead to increased angiotensin II (Ang II) synthesis (Nguyen et al., 2002). In addition, prorenin or renin when bound to the PRR independent of Ang-II synthesis can lead to activation of intracellular signaling pathways such as extracellular signal-regulated kinase (ERK1/2) and p38 mitogen-activated protein kinase (p38 MAPK) (Nguyen et al., 2002; Feldt et al., 2008; Saris et al., 2006). Both of which are related to cell growth, and proliferation, as well as cell stress response and death.
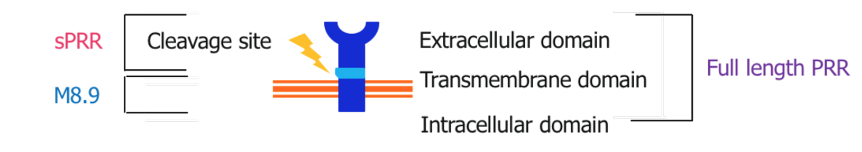
Fig. 2. Structure of the (pro)renin receptor
The role of PRR varies depending on whether it is in its intact or cleaved forms (Nguyen et al., 2002). The PRR consists of a smaller intracellular domain, a transmembrane domain, and a much larger extracellular domain. The large extracellular component can be cleaved close to the membrane, yielding the soluble (pro)renin receptor (sPRR). sPRR can be circulated throughout the blood plasma and urine allowing for RAAS dependent and independent effects. While PRR has been fairly well described since its discovery, sPRR is much less documented (Danser & Deinum, 2005; Nguyen et al., 2010; Ichihara et al., 2007; Danser et al., 2007). Although our knowledge is limited, preliminary studies suggest that sPRR may play a role in the mediation of kidney injury, fibrosis, and hypertension. Recent studies have described elevated plasma sPRR levels in humans with kidney disease and/or heart failure (Amari et al., 2016; Gong et al., 2019; Hamada et al., 2013; Morimoto et al., 2014; Fukushima et al., 2013). Studies involving the administration of recombinant sPRR have shown hypertension (Gatineau et al., 2019; Gatineau et al., 2019; Wu et al., 2016). Further study is needed to determine the extent to which sPRR influences kidney damage, kidney function, and blood pressure. Thus, our aim in this study is to describe the actions of sPRR in kidney tissue, specifically upon kidney injury markers, fibrosis markers, and inflammation markers.
Recently, our laboratory developed a mouse model such that sPRR is not generated (Ramkumar et al., 2021). Using CRISPR-Cas9, we generated a mutation in the cleavage site, located as part of the ATP6AP2 gene (Fig. 3). This mutation effectively prevents sPRR from being produced. Since the ATP6AP2 gene coding the PRR is located on the X chromosome, male mice are hemizygous, while female mice are heterozygous for the cleavage site mutation. Mutant mice with loss of sPRR are born at the normal frequency and do not display any evidence of organ dysfunction although they are lower in body weight. In addition, male mice are infertile and thus, the female heterozygous mutant mice were used for breeding.
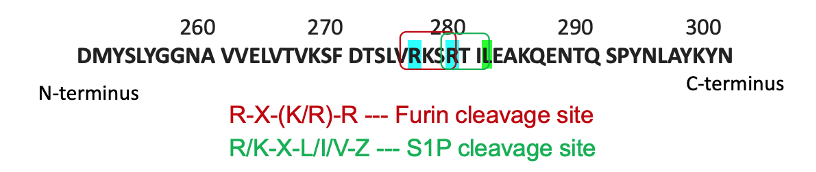
Fig. 3. CRISPR-Cas9 mutagenesis of the cleavage site of the PRR
We recently showed that sPRR attenuates Angiotensin-II mediated hypertension and kidney injury in male mice with loss of sPRR (Ramkumar et al., 2021). Additionally, preliminary studies have shown that sPRR is influential in attenuating kidney injury and inflammation. Thus, we hypothesized that compared to wild type, loss of sPRR will show decreased kidney injury, fibrosis, and inflammation.
The Unilateral Ureter Obstruction (UUO) is a widely used model of kidney injury in mice (Chevalier et al., 2009; Aranda-Rivera et al., 2021; Manucha, 2007; Rodríguez-Peña et al., 2008; Martinez-Klimova et al., 2019). A single ureter is tied off, obstructing the flow of urine and causing tubular injury to the obstructed kidney (Chevalier et al., 2009). The UUO model is most similar to chronic obstructive nephropathy, which, in the long term, leads to CKD. Typically, in the UUO, we are able to collect and analyze the kidneys post sacrifice of the mice. Messenger RNA (mRNA) is extracted to measure for 1) kidney injury markers, 2) markers of fibrosis or scarring, and 3) inflammation markers within the damaged kidneys. Markers of kidney injury include Kidney Injury Molecule 1 (KIM-1), which is not normally present unless the kidneys have been damaged (Timmeren et al., 2007; Bonventre, 2008). KIM-1 is a well-known marker of proximal renal tubular injury in laboratory settings (Han et al., 2002). Fibrosis markers include Collagen-I (COL-I), and Fibronectin (FN), and Transforming Growth Factor Beta (TGF-β). COL-I and FN are structural proteins seen in scar tissue (Buchtler et al., 2018; Dixon et al., 1980), while TGF-β is noted for its role in signaling collagen production (Roberts et al., 1986). Inflammation markers include Interleukin 6 (IL6), and Tumor Necrosis Factor α (TNF-α). Both are proinflammatory cytokines partly responsible for controlling immune response (Su et al., 2017; Ramseyer et al., 2013). Other inflammation markers include Monocyte Chemoattractant Protein-I (MCP-I), and Vascular Cell Adhesion Molecule-I (VCAM-I). Both are involved in the migration and action of immune cells in response to injury (Segerer et al., 2000; Wuthrich, 1992).
It is important to note that while we can measure mRNA levels within the kidneys, we are unable to analyze systemic markers such as blood urea nitrogen/creatinine or urinary markers in the UUO model. This is because the tying of the ureter obstructs urine production from the damaged kidney, while the other kidney continues to function normally and does not change blood or urinary markers of injury, fibrosis, or inflammation.
Methods
Generation of Mutant sPRR Mice
Cleavage of the PRR gene is performed by furin and site-1 protease. Through use of CRISPR-Cas9, cleavage sites of both enzymes were mutated so that sPRR cannot be generated (Fig. 3). In short, guide RNAs introduced two point mutations (R276A and R279A) into exon 8 of the ATP6AP2 gene. Homology-directed repairs altered the furin and site-1 protease sites of the gene. Founder mice were developed through co-injection of Cas9 mRNA and gRNA with donor oligo and targeting vectors into mice embryos. Mice were later genotyped, and genome sequencing was performed.
Unilateral Ureteral Obstruction
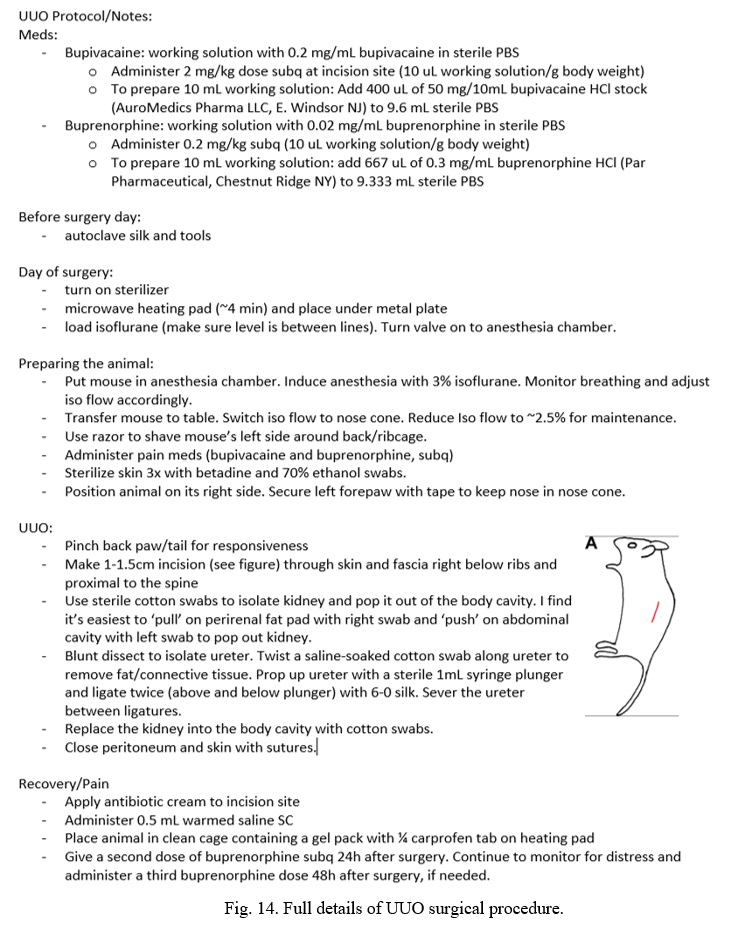
The Unilateral Ureteral Obstruction (UUO) procedure is able to cause scarring, inflammation, and fibrosis within the obstructed kidney through forcing the backflow of urine. Male mutant sPRR (MUT) and littermate wild type (WT) mice between four to seven months of age underwent surgical procedures. All mice were on a C57BL/6J strain. UUO mice had their left ureter tied off at the lower pole of the left kidney, while Sham mice underwent the motions of the UUO without actual tying of the ureter. Incisions were sutured closed, and mice were closely monitored in the following days. All mice successfully survived the procedure and survived until the time of sacrifice. Each cohort was sacrificed at a period of 3 days or 7 days post operation. Due to limited number of mice, we were unable to perform sham surgery in mutant sPRR mice. Only male mice were examined in this study. Details on surgical protocol are included in the appendix.
Plasma and Kidney Collection
Mice were sacrificed at 3 days or 7 days post UUO/Sham operation. 500 μL of blood was collected by cardiac puncture under anesthesia to measure plasma sPRR concentration. Kidneys were weighed, flash frozen in liquid nitrogen, and stored at -80°C. UUO/Sham kidneys were sectioned into thirds. One third underwent fixation for histology, one third underwent mRNA extraction for qRT-PCR, and one third was stored for immunoblotting.
Plasma sPRR Measurement
Plasma sPRR was measured using soluble (pro)renin receptor EIA assay kit (Immuno-Biological Laboratories Co., Gunma, Japan; 20898). The kit is a solid phase ELISA that yields coloring that is proportional to the concentration of PRR. Colored samples were run in a UV-vis spectrophotometer against pre-prepared standards. Concentrations were calculated by comparing samples to a standard curve .
RNA Extraction and Verification
mRNA was isolated from UUO kidneys using PureLink RNA Mini Kit (Thermo Fisher Scientific, Carlsbad, CA, USA; 12183025). In short, one third of the UUO/Sham kidneys were homogenized with a rotor-stator homogenizer. Samples underwent multiple washes with Invitrogen’s wash buffers followed by centrifugation. Finally, mRNA was extracted with Invitrogen’s elution buffer.
Before analysis, RNA concentration was quantified and checked for purity via NanoDrop 2000 UV-vis Spectrophotometer. Both 260/280 and 260/230 ratios were compared to determine whether the mRNA was usable. Nucleic acids absorb at 260 nm, while common organic and inorganic contaminants absorb at 280 nm and 230 nm, respectively. For RNA, good purity at 260/280 are values between 2.0-2.3, while good values for 260/230 are between 1.6-1.8. Once concentrations were calculated, the same amount of mRNA was used from each sample for reverse transcription.
Reverse Transcription
Isolated RNA (0.5-1 μg) was reverse transcribed to complimentary DNA (cDNA) using a High-Capacity cDNA Reverse Transcription Kit (Thermo Fisher Scientific, Vilnius, Lithuania; 4368814). Samples were prepared in polymerase chain reaction (PCR) tubes and ran in Veriti 96-Well Thermocycler. Amount of RNA varied per cohort dependent on maximum RNA yield. Reverse transcription converts mRNA strands into cDNA preparing for rapid amplification during polymerase chain reaction.
Quantitative Reverse Transcription Polymerase Chain Reaction
mRNA levels were quantified through Quantitative Reverse Transcription Polymerase Chain Reaction (qRT-PCR). qRT-PCR was performed using TaqMan Gene Expression Master Mix (Thermo Fisher Scientific, Waltham, MA, USA; 4369510) and SYBR Green PCR Master Mix (New England BioLabs, Ipswich, MA, USA; M3003) in a 96-well StepOne Real-time PCR System (Applied Biosystems, Foster City, CA, USA; 4376357). 2−ΔΔCT method was used to measure relative expression levels of mRNA. Markers were normalized to glyceraldehyde 3-phosphate dehydrogenase (GAPDH). GAPDH is 1) essential to cell survival and 2) expressed similarly in many tissue types (Sikand et al., 2012). TaqMan primer sequences (Table 1) (Thermo Fisher Scientific, Pleasanton, CA, USA; 4316034) were synthesized by Thermofisher (Thermo Fisher Scientific, Waltham, MA, USA ). SYBR Green primer sequences (Table 1) were synthesized at the University of Utah Primer Synthesis Core.
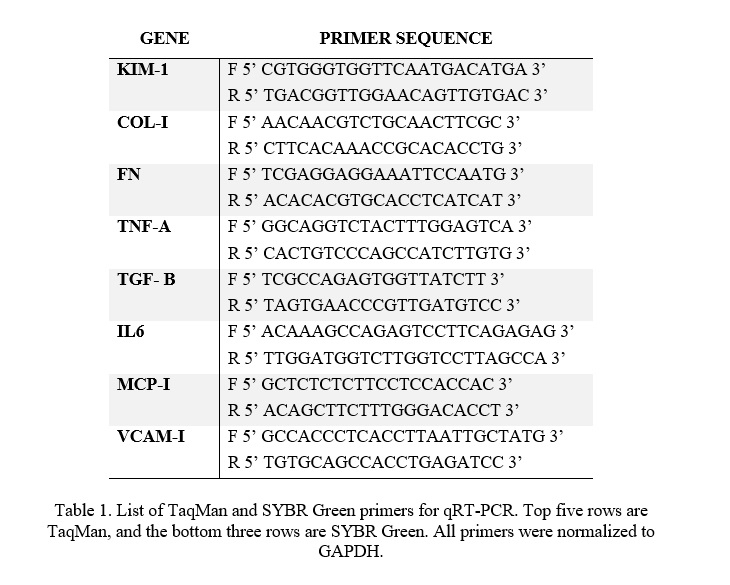 Table 1. List of TaqMan and SYBR Green primers for qRT-PCR. Top five rows are TaqMan, and the bottom three rows are SYBR Green. All primers were normalized to GAPDH.
Histology and Immunofluorescence
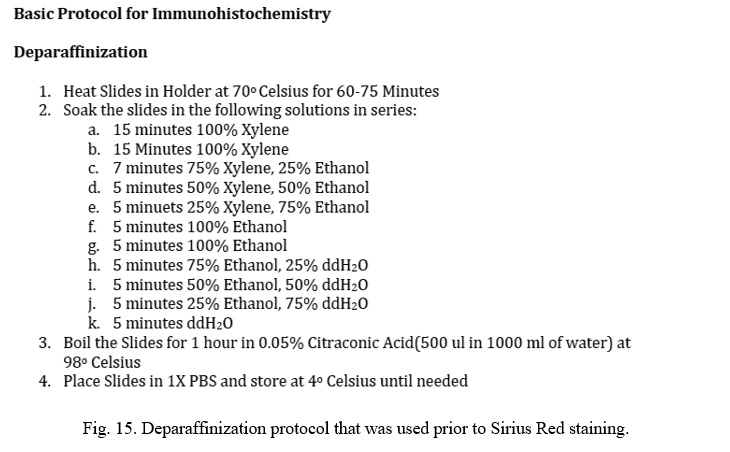
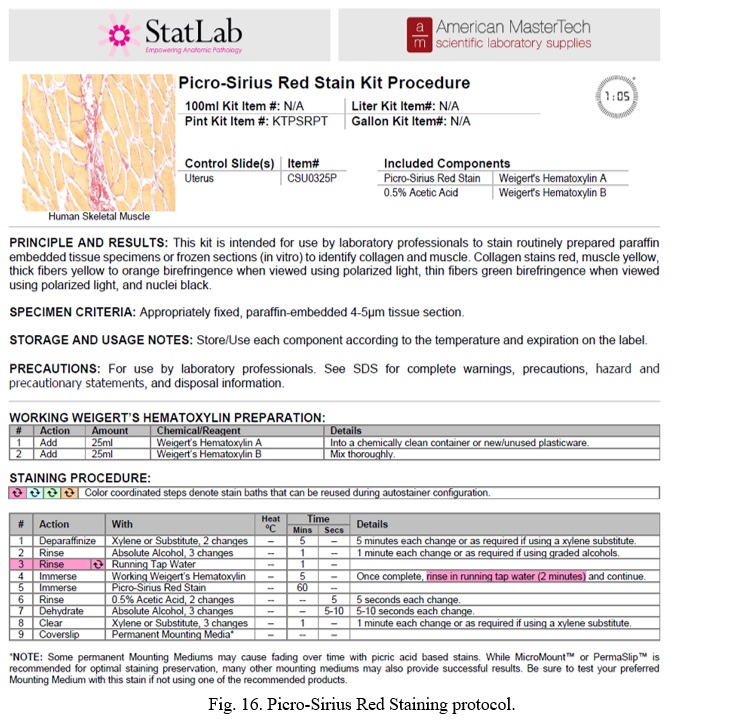
One third of UUO/Sham kidney were fixed overnight in 10% formaldehyde and sent to the University of Utah Histology Core for paraffin fixation. Received slides were deparaffinized and Picro Sirius red staining was performed. To assess cross-sectional areas of inflammation and scarring, quantification was measured with ImageJ software. Picro Sirius red staining highlights structural tissue bright red, while other tissues are left as light yellow in color. ImageJ software allows a color threshold to be selected at which the percentage of red can be measured. Full protocols for staining and analysis are attached in the appendix.
Statistical Analysis
All mice were used for the analysis. 3-day UUO and 7-day UUO were analyzed separately. qRT-PCR data was compared through measuring the CT values. CT values are measured as the number of cycles required to amplify the cDNA to the preset threshold. 2−ΔΔCT values were calculated and WT UUO/ mutant UUO were compared to the WT Sham. 1-way ANOVA with Tukey’s multiple comparisons test was used to compare fold values between each group. Statistical significance was marked at *P < 0.05.
Results
Male WT and mutant sPRR mice were used in this study for two reasons (1) ease of interpretation when comparing WT mice with mice with complete loss of sPRR in male mice as opposed to partial reduction of sPRR seen in female mutant sPRR mice, (2) female mice are less susceptible to kidney injury (Hodeify et al., 2013; Lima-Posada et al., 2017; Shepard, 2019).
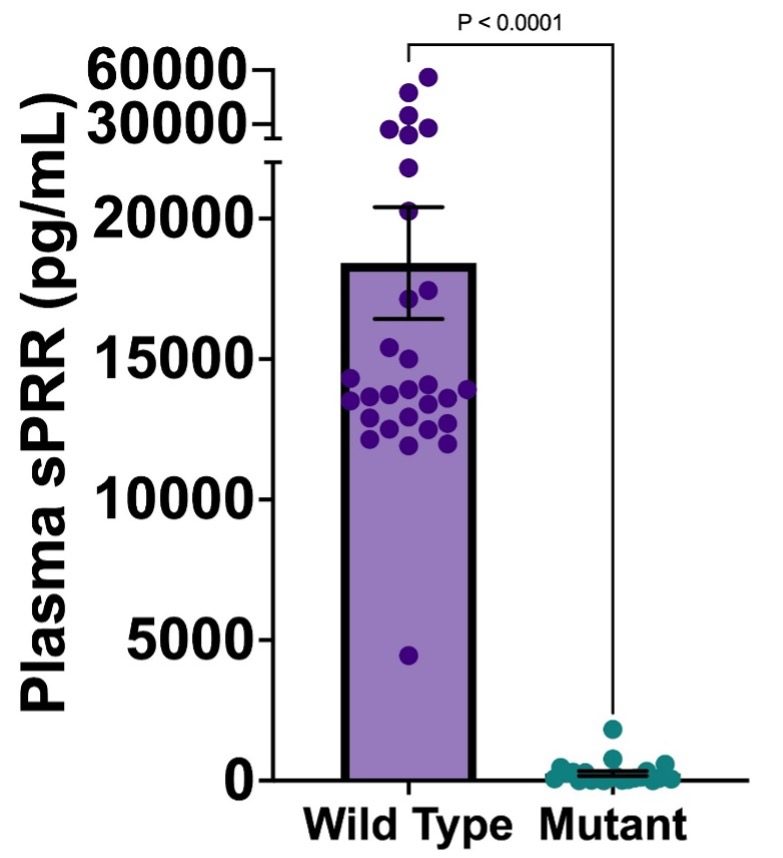
Fig. 4. Plasma sPRR concentrations of wild type and mutant mice for both 3-day and 7-day; Mean +/- SEM. *P < 0.05.
Stark differences in plasma sPRR levels can be seen between the mutant sPRR and WT groups. WT mice on average had a plasma sPRR concentration of 18,420 +/- 1,990 pg/mL while mutant sPRR mice on average had a plasma sPRR concentration of 258.2 +/- 86.6 pg/mL. This suggests that mutant mice on average showed a 99.6% decrease in plasma sPRR levels when compared to WT mice.
The length of time until the UUO mice are sacrificed is directly proportional to the extent of kidney damage, scarring, and inflammation. Preliminary studies were performed at 21 days following UUO. 21-Day mice showed far too severe structural damage and scarring to the kidney, thus, further studies were performed at 3 and 7 days post- UUO. Results of 3-day and 7-day qRT-PCRs are shown below.
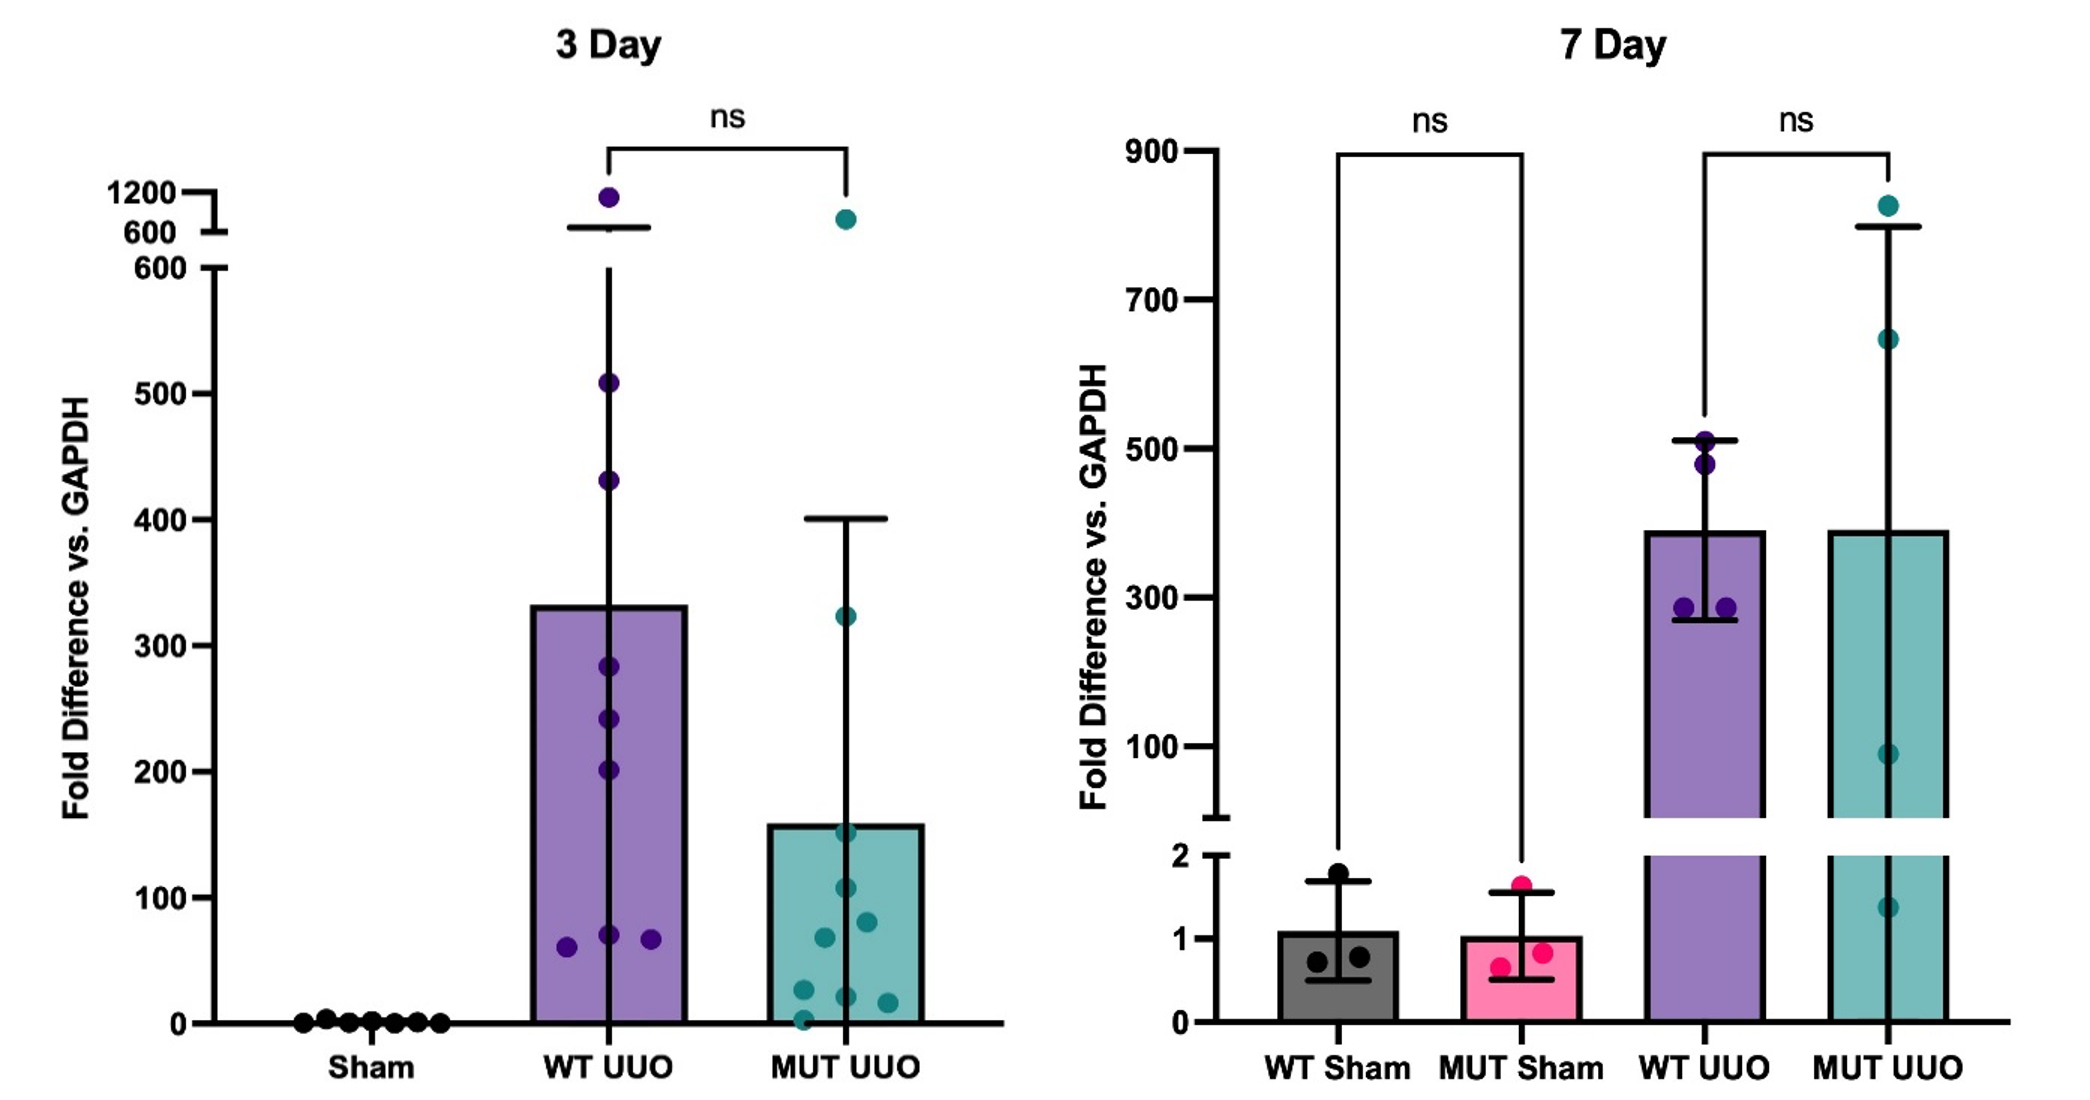
Fig. 5. Gene expression of KIM-1 by RT-PCR at 3-day (left; n = 7-10/group ) and 7-day UUO (right; n = 3-4/group); Mean +/- SEM of fold difference comparing GAPDH to KIM-1 is shown. All groups are compared to WT Sham. P-values determined by one-way ANOVA with Tukey’s multiple comparisons test. *P < 0.05.
For our kidney injury marker, both WT UUO and MUT UUO groups had significantly greater levels of Kidney Injury Marker 1 (KIM-1) compared to WT Sham and MUT Sham for both 3-day and 7-day. For the 3-day mice, WT UUO had an average fold increase of 332 +/- 113, while MUT UUO had an average fold of 159 +/- 76 compared to WT Sham with an average fold of 1.34 +/- 0.46. Meanwhile, for the 7-day mice, WT UUO had an average increase of 390 +/- 60, while MUT UUO had an average fold of 391 +/- 204. Unlike the 7-day mice, however, the 3-day mice had a trend toward attenuated KIM-1 presence for MUT UUO compared to WT UUO. Although the difference is not statistically significant, this trend may be of interest, suggesting that the MUT UUO shows less kidney injury compared to wild type.
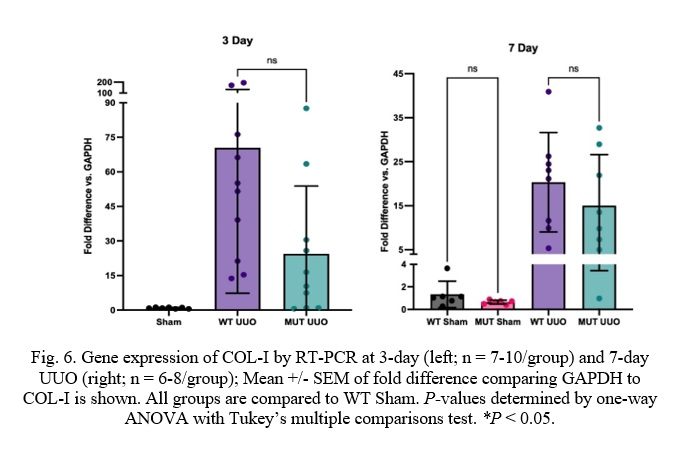 Fig. 6. Gene expression of COL-I by RT-PCR at 3-day (left; n = 7-10/group) and 7-day UUO (right; n = 6-8/group); Mean +/- SEM of fold difference comparing GAPDH to COL-I is shown. All groups are compared to WT Sham. P-values determined by one-way ANOVA with Tukey’s multiple comparisons test. *P < 0.05.
Markers of kidney scarring and fibrosis show similar results. Firstly, the UUO procedure causes dramatically increased levels of Collagen-I (COL-I) when compared to Sham as expected. COL-I levels are similar for 7-day mice with values of 20.3 +/- 4.0 and 15.0 +/- 4.1 for WT and MUT, respectively. COL-I levels for 3-day mice, however, are moderately attenuated for MUT UUO compared to WT UUO despite lacking statistical significance (MUT: 24.4 +/- 9.3 and WT: 70.4 +/- 20.0).
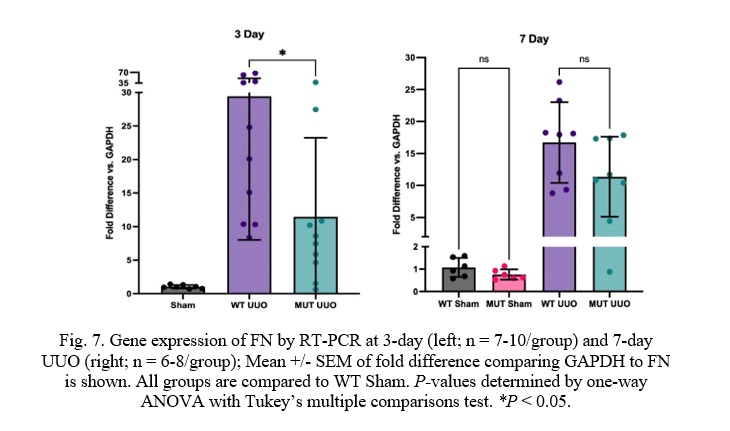
Fig. 7. Gene expression of FN by RT-PCR at 3-day (left; n = 7-10/group) and 7-day UUO (right; n = 6-8/group); Mean +/- SEM of fold difference comparing GAPDH to FN is shown. All groups are compared to WT Sham. P-values determined by one-way ANOVA with Tukey’s multiple comparisons test. *P < 0.05.
Similar to COL-I, Fibronectin (FN) was significantly attenuated in MUT UUO mice compared to WT UUO at the 3-day time-point. WT UUO and MUT UUO for 3-day show average folds of 29.4 +/- 6.8 and 11.5 +/- 3.7, respectively. Unlike COL-I, the difference between WT UUO and MUT UUO is statistically significant with a p-value of 0.033. Meanwhile, WT UUO and MUT UUO for 7-day show average increases of 16.7 +/- 2.2 and 11.4 +/- 2.2, respectively, which were no longer statistically different.
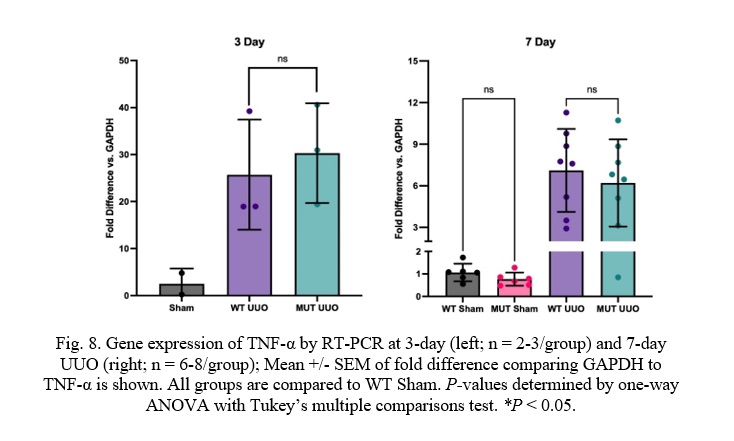 Fig. 8. Gene expression of TNF-α by RT-PCR at 3-day (left; n = 2-3/group) and 7-day UUO (right; n = 6-8/group); Mean +/- SEM of fold difference comparing GAPDH to TNF-α is shown. All groups are compared to WT Sham. P-values determined by one-way ANOVA with Tukey’s multiple comparisons test. *P < 0.05.
Unlike the kidney injury and fibrosis markers, there was no difference in TNF-α expression in the MUT UUO mice compared to WT UUO for either the 3-day or the 7-day mice. WT UUO and MUT UUO for 3-day show average increases of 25.7 +/- 6.8 and 30.3 +/- 6.1, respectively. WT UUO and MUT UUO for 7-day show average folds of 7.10 +/- 1.06 and 6.20 +/- 1.11, respectively relative to WT Sham.
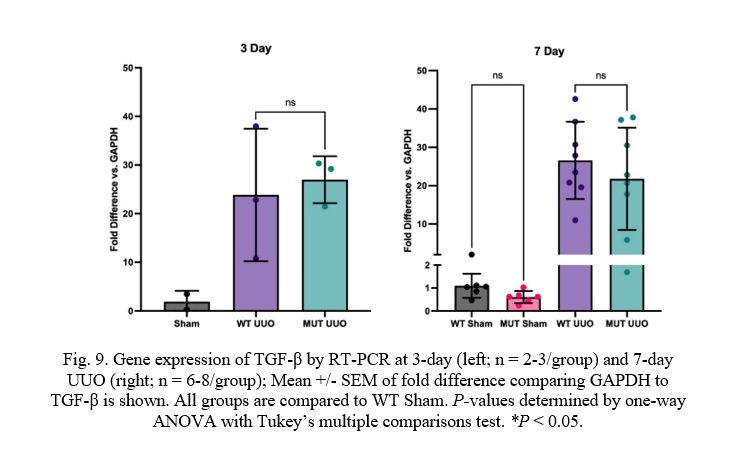
Fig. 9. Gene expression of TGF-β by RT-PCR at 3-day (left; n = 2-3/group) and 7-day UUO (right; n = 6-8/group); Mean +/- SEM of fold difference comparing GAPDH to TGF-β is shown. All groups are compared to WT Sham. P-values determined by one-way ANOVA with Tukey’s multiple comparisons test. *P < 0.05.
Transforming Growth Factor β (TGF-β) expression was also similar between MUT UUO mice compared to WT UUO for either the 7-day or the 3-day mice. WT UUO and MUT UUO for 3-day show average folds of 23.9 +/-7.9 and 27.0 +/- 2.8, respectively compared to WT Sham. WT UUO and MUT UUO for 7-day show average folds of 6.24 +/- 1.35 and 4.75 +/- 1.04, respectively relative to WT Sham.
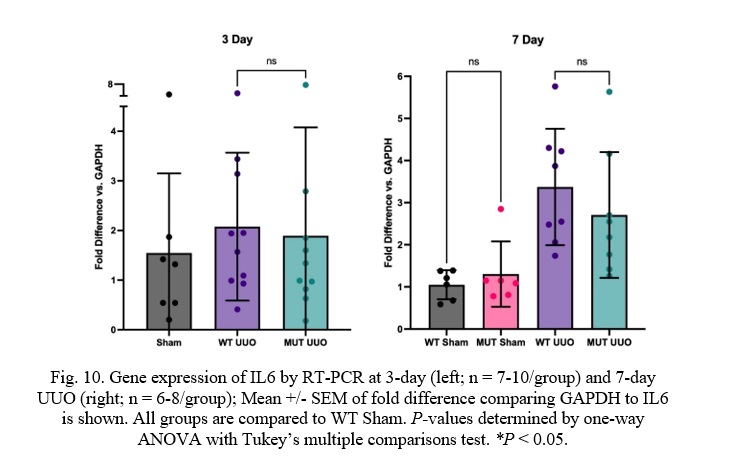
Fig. 10. Gene expression of IL6 by RT-PCR at 3-day (left; n = 7-10/group) and 7-day UUO (right; n = 6-8/group); Mean +/- SEM of fold difference comparing GAPDH to IL6 is shown. All groups are compared to WT Sham. P-values determined by one-way ANOVA with Tukey’s multiple comparisons test. *P < 0.05.
Similar to TNF-α and TGF-β, WT UUO and MUT UUO mice had similar Interleukin 6 (IL6) concentrations for both 3-day or 7-day time-points. WT UUO and MUT UUO for 3-day show average folds of 2.08 +/- 0.47 and 1.89 +/-0.69, respectively compared to WT Sham. WT UUO and MUT UUO for 7-day show average folds of 3.37 +/- 0.49 and 2.71 +/- 0.53, respectively relative to WT Sham.

Fig. 11. Gene expression of MCP-I by RT-PCR at 3-day (left; n = 9/group) and 7-day UUO (right; n = 6-8/group); Mean +/- SEM of fold difference comparing GAPDH to MCP-I is shown. All groups are compared to WT Sham. P-values determined by one-way ANOVA with Tukey’s multiple comparisons test. *P < 0.05.
At 3 days, there is a statistically significant difference between WT UUO and MUT UUO mice in Monocyte Chemoattractant Protein-I (MCP-I) concentrations with a p-value of 0.011. MUT UUO MCP-I concentrations appear to be much less than the WT UUO concentrations, almost similar to the Sham concentrations. Meanwhile, 7-day mice had similar expression of MCP-I between WT and MUT UUO. WT UUO and MUT UUO for 3-day show average folds of 36.0 +/- 10.0 and 9.13 +/- 3.86, respectively. WT UUO and MUT UUO for 7-day show average folds of 23.9 +/-2.3 and 18.4 +/- 4.2, respectively.
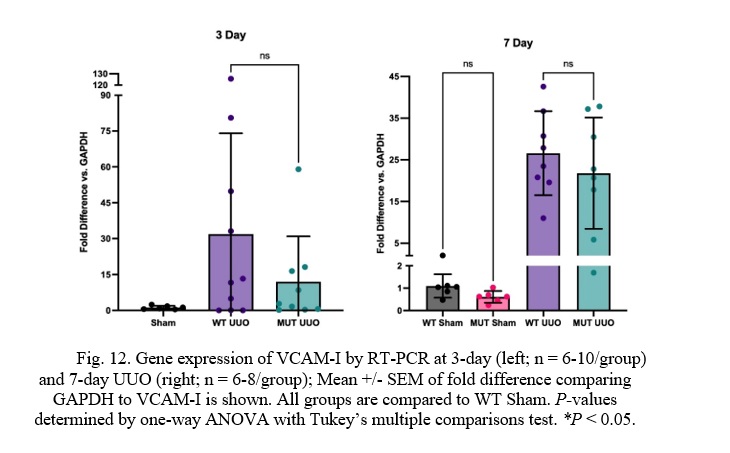
Fig. 12. Gene expression of VCAM-I by RT-PCR at 3-day (left; n = 6-10/group) and 7-day UUO (right; n = 6-8/group); Mean +/- SEM of fold difference comparing GAPDH to VCAM-I is shown. All groups are compared to WT Sham. P-values determined by one-way ANOVA with Tukey’s multiple comparisons test. *P < 0.05.
At 3 days, there was a trend toward lower Vascular Cell Adhesion Molecule-I (VCAM-I) expression in the MUT UUO mice compared to WT UUO. This difference, however, was not statistically significant. No difference in VCAM-I expression was seen at the 7-day time-point. For the 3-day mice, WT UUO and MUT UUO for 3-day show average increase of 31.9 +/- 13.3 and 12.0 +/- 6.3, respectively compared to WT Sham. WT UUO and MUT UUO for 7-day show average folds of 26.6 +/- 3.6 and 21.8 +/- 4.7, respectively relative to WT Sham.
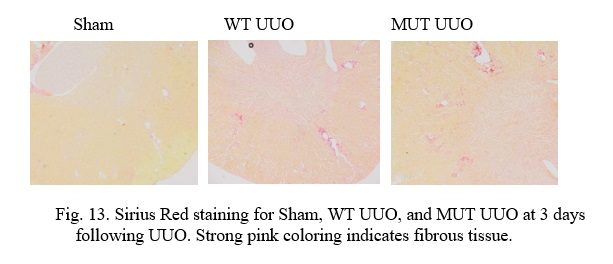
Fig. 13. Sirius Red staining for Sham, WT UUO, and MUT UUO at 3 days following UUO. Strong pink coloring indicates fibrous tissue.
In the above slides, Picro Sirius Red stains normal tissue a light yellow in color, while Collagen-I found in fibrous and scar tissue stains bright pink as a. Vascular tissue (i.e. arteries and veins) and structural tissue contain Collagen-I, and thus, it is important to recognize these areas to discern them from scarring due to UUO. It is interesting to note that UUO causes tubular dilatation and injury in comparison to the Sham tissue due to the obstruction.
At 3 days, the Sham kidneys can clearly be seen to have the least scarring. Structural tissue can be seen closer to the center of the kidney at the renal pelvis, while normal blood vessels can be seen on occasion throughout the tissue. Comparatively, the WT UUO appears to have the most scarring as the greatest pockets of interstitial fibrosis are visible all throughout the sample. The MUT UUO tissue appears to have attenuated scarring in the WT UUO. Unfortunately, due to time constraints, staining is yet to be performed for the 7-day mice, and quantitative analysis for both groups is ongoing.
Discussion
We expected to find that: 1) Loss of sPRR would attenuate kidney injury, fibrosis, and kidney inflammation when compared to wild type; 2) similar results would be found at both 3-day and 7-day time-points; 3) Sirius red staining would show attenuated fibrosis in the mutant sPRR mice compared to WT.
Our results show that at 3 days following UUO, Collagen-I (COL-I), Fibronectin (FN), Monocyte Chemoattractant Protein-I (MCP-I), and perhaps Vascular Cellular Adhesion Molecule-I (VCAM-I) are all reduced in the mutant sPRR mice compared to WT UUO mice. Loss of sPRR appears to attenuate, but not entirely reduce expression of kidney injury and fibrosis markers, and some, but not all kidney inflammation markers in the setting of UUO. This suggests that other factors than sPRR may influence kidney injury, fibrosis, and kidney inflammation. Furthermore, out of all markers, only FN and MCP-I show statistically significant differences while a strong trend towards attenuated presence in MUT UUO can still be seen in the other markers (KIM-1, COL-I, VCAM-I). It is likely that this is due to variation between individual mice; further testing increasing the sample size may potentially show significance. In addition, inconsistencies during mice surgeries, RNA sample purity, and analysis may have led to variances in the data. Regardless, sPRR does appear to play a role in kidney injury and fibrosis in the setting of UUO.
It is interesting to note that the 7-day results are quite different from the 3-day time-point. Differences between the MUT UUO and WT UUO at seven days do not show support towards a trend. This may presumably be due to the length of progression of the kidney damage. 7-day mice may have sustained more damage than protection afforded by loss of sPRR. In other words, loss of sPRR may have an acute protective effect which is no longer present with ongoing obstruction at the 7-day time-point. This is not entirely unexpected as UUO models tend to increase in severity with ongoing obstruction and several pathways of injury, inflammation, and fibrosis are likely to be activated by then. Additional models not involving UUO may be helpful in determining the temporal trends of how sPRR protects against kidney injury and fibrosis.
In our 3-day qRT-PCR results, we found that both our fibrosis markers, COL-I and FN were reduced in MUT sPRR mice compared to wild type. Upon visible inspection, the Sirius red staining reflects this wherein interstitial fibrosis for the MUT UUO mice appears to be greatly reduced in comparison to the WT UUO mice although not quite to the same degree as the WT Sham mice. While the slides are straightforward to compare visually, due to time constraints, quantitative analyses are still ongoing and will be completed in the next month. We anticipate that the staining results would be in accordance with RT-PCR results with loss of sPRR reducing kidney fibrosis at 3-day time-point and not as much at the 7-day time-point.
In addition to performing quantitative analysis on the staining, immunoblotting of kidney injury, inflammation, and fibrosis is planned as RNA and protein expression may be quite different. Moreover, considering alternative mouse models of CKD such as treatment with adenine or folic acid, may provide valuable insights into the role of sPRR in kidney disease. These models induce fibrosis, inflammation, and injury differently from the UUO model, and may be able to further clarify the role of sPRR in kidney disease. Another potential consideration is whether female mutant sPRR mice are protected against kidney disease. While mutant sPRR males have near complete reduction of sPRR, mutant females retain close to 50%, potentially resulting in different outcomes when subjected to UUO or other kidney disease models. Further investigations of these aspects could potentially enhance the understanding of the sPRR.
The results of this study are humbly contributive to the nature of the soluble (pro)renin receptor. The work presented here does not, by any means, represent a comprehensive explanation of the sPRR. Our aim is to describe sPRR in an instance of CKD such as the UUO. Although sPRR might be a promising target for medical treatments, further study of the sPRR is required to help understand the RAAS pathway, and the implications of sPRR on CKD, CVD, and hypertension.
References
-
Amari Y, Morimoto S, Nakajima F, Ando T, Ichihara A. Serum Soluble (Pro)Renin Receptor Levels in Maintenance Hemodialysis Patients. PloS One. 2016; 11(7): e0158068. doi: 10.1371/journal.pone.0158068
-
Aranda-Rivera AK, Cruz-Gregorio A, Aparicio-Trejo OE, Ortega-Lozano AJ, Pedraza-Chaverri J. Redox signaling pathways in unilateral ureteral obstruction (UUO)-induced renal fibrosis. Free Radical Biology and Medicine. 2021; 172: 65-81. doi: 10.1016/j.freeradbiomed.2021.05.034
-
Bonventre JV. Kidney Injury Molecule-1 (KIM-1): a specific and sensitive biomarker of kidney injury. Scandinavian Journal of Clinical and Laboratory Investigation. 2009; 68: 78-83. doi: 10.1080/00365510802145059
-
Buchtler S, Grill A, Hofmarksrichter S, Stockert P, Schiechl-Brachner G, Gomez MR, Neumayer S, Schmidbauer K, Talke Y, Klinkhammer BM, Boor P, Medvinsky A, Renner K, Castrop H, Mack M. Cellular Origin and Functional Relevance of Collagen I Production in the Kidney. Journal of American Society of Nephrology. 2018; 29(7): 1859-1873. doi: 10.1681/ASN.2018020138
-
Chevalier RL, Forbes MS, Thornhill BA. Ureteral obstruction as a model of renal interstitial fibrosis and obstructive nephropathy. Kidney International. 2009; 75(11): 1145-1152. doi: 10.1038/ki.2009.86
-
Crowley SD, Coffman TM. Recent advances involving the renin-angiotensin system. Experimental Cell Research. 2012; 318(9): 1049-1056. doi: 10.1016/j.yexcr.2012.02.023
-
Danser AHJ, Deinum J. Renin, Prorenin and the Putative (Pro)renin Receptor. Hypertension. 2005; 46(5):1069-1076. doi: 10.1161/01.HYP.0000186329.92187.2e
-
Dixon AJ, Burns J, Dunnill MS, McGee JO. Distribution of fibronectin in normal and diseased human kidneys. Journal of Clinical Pathology. 1980; 33: 1021-1028. doi: 10.1136/jcp.33.11.1021
-
Feldt S, Batenburn WW, Mazak I, Maschke U, Wellner M, Kvakan H, Dechend R, Fiebeler A, Burckle C, Contrepas A, Danser AHJ, Bader M, Nguen G, Luft FC, Muller DM. Prorenin and Renin-Induced Extracellular Signal-Regulated Kinase ½ Activation in Monocytes Is Not Blocked by Aliskiren or the Handle-Region Peptide. Hypertension. 2008; 51: 682-688. doi: 10.1161/HYPERTENSIONAHA.107.101444
-
Fu Z, Wang F, Liu X, Hu J, Su J, Lu X, Lu A, Cho JM, Symons JD, Zou CJ, Yang T. Soluble (pro)renin receptor induces endothelial dysfunction and hypertension in mice with diet-induced obesity via activation of angiotensin II type 1 receptor. Clinical Science. 2021; 135(6): 793-810. doi: 10.1042/CS20201047
-
Fukushima A, Kinugawa S, Homma T, Masaki Y, Furihata T, Abe T, Suga T, Takada S, Kadoguchi T, Okita K, Matsushima S, Tsutsui H. Increased plasma soluble (pro)renin receptor levels are correlated with renal dysfunction in patients with heart failure. 2013; 168(4): P4313-4314. doi: 10.1016/j.ijcard.2013.04.176
-
Gatineau E, Cohn DM, Poglitsch M, Loria AS, Gong M, Yiannikouris F. Losartan prevents the elevation of blood pressure in adipose-PRR deficient female mice while elevated circulating sPRR activates the renin-angiotensin system. Heart and Circulatory Physiology. 2019; 316(3): H506-H515. doi: 10.1152/ajpheart.00473.2018
-
Gatineau E, Gong MC, Yiannikouris F. Soluble Prorenin Receptor Increases Blood Pressure in High Fat-Fed Male Mice. Hypertension. 2019; 74(4): 1014-1020. doi: 10.1161/HYPERTENSIONAHA.119.12906
-
Gong L, Zhang S, Li L, Gao X, Wang D, Wu D, Wang K, Liu Y. Elevated plasma soluble (pro)renin receptor levels are associated with left ventricular remodeling and renal function in chronic heart failure patients with reduced ejection fraction. Peptides. 2019; 111: 152-157. doi: 10.1016/j.peptides.2018.04.010
-
Hamada K, Taniguchi Y, Shimamura Y, Inoue K, Ogata K, Ishihara M, Hornio T, Fujimoto S, Ohguro T, Yoshimoto Y, Ikebe M, Yuasa K, Hoshino E, Iiyama T, Ichihara A, Terada Y. Serum level of soluble (pro)renin receptor is modulated in chronic kidney disease. Clinical and Experimental Nephrology. 2013; 17: 848-856. doi: 10.1007/s10157-013-0803-y
-
Han WK, Bailly V, Abichandani R, Thadhani R, Bonventre JV. Kidney Injury Molecule-1 (KIM-1): a novel biomarker for human renal proximal tubule injury. Kidney International. 2002; 62(1): 237-244. doi: 10.1046/j.1523-1755.2002.00433.x
-
Hodeify R, Megyesi J, Tarcsafalvi A, Mustafa HI, Seng NSHL, Price PM. Gender differences control the susceptibility to ER stress-induced acute kidney injury. American Journal of Physiology-Renal Physiology. 2013; 304:F875-F882. doi: 10.1152/ajprenal.00590.2012
-
Ichihara A, Kaneshiro Y, Takemitsu T, Sakoda M, Itah H. The (Pro)Renin Receptor and the Kidney. Seminars in Nephrology. 2007; 27(5): 524-528. doi: 10.1016/j.semnephrol.2007.07.005
-
Ichihara A, Yatabe MS. The (pro)renin receptor in health and disease. Nature Reviews Nephrology. 2019; 15: 693-712. doi: 10.1038/s41581-019-0160-5
-
Jankowski J, Floege J, Fliser D, Bohm M, Marx N. Cardiovascular Disease in Chronic Kidney Disease. Circulation Research. 2021; 143:1147-1172. doi: 10.1161/CIRCULATIONAHA.120.050686
-
Kovesdy CP. Epidemiology of chronic kidney disease: an update 2022. Kidney International Supplements. 2022; 12(1): 7-11. doi: 10.1016/j.kisu.2021.11.003
-
Lima-Posada I, Portas-Cortés C, Pérez-Villalva R, Fontana F, Rodríguez-Romo R, Prieto R, Sánchez-Navarro A, Rodríguez-González GL, Gamba G, Zambrano E, Bobadilla NA. Gender Differences in the Acute Kidney Injury to Chronic Kidney Disease Transition. Scientific Reports. 2017; 12270. doi: 10.1038/s41598-017-09630-2
-
Manucha W. Biochemical-molecular markers in unilateral ureteral obstruction. Biocell. 2007; 31(1): 1-12. doi: 10.32604/biocell.2007.31.001
-
Martinez-Klimova E, Aparicio-Trejo OE, Tapia E, Pedraza-Chaverri J. Unilateral Ureteral Obstruction as a Model to Investigate Fibrosis-Attenuating Treatments. 2019; 9(4): 141. doi: 10.3390/biom9040141
-
Morimoto S, Ando T, Niiyama M, Seki Y, Yoshida N, Watanabe D, Kawakami-Mori F, Kobori H, Nishiyama A, Ichihara A. Serum soluble (pro)renin receptor levels in patients with essential hypertension. Hypertension Research. 2014; 37: 642-648. doi: 10.1038/hr.2014.46
-
Nguyen G, Delarue F, Burckle C, Bouzhir L, Giller T, Sraer JD. Pivotal role of the renin/prorenin receptor in angiotensin II production and cellular responses to renin. The Journal of Clinical Investigation. 2002; 109(11): 1417-1427. doi: 10.1172/JCI14276
-
Nguyen G, Muller DN. The Biology of the (Pro)Renin Receptor. Journal of the American Society of Nephrology. 2010; 21(1):18-23. doi: 10.1681/ASN.2009030300
-
Ohashi N, Isobe S, Ishigaki S, Suzuki T, Iwakura T, Ono M, Fujikura T, Tsuji T, Otsuka A, Ishioi Y, Furuse H, Kato A, Ozono S, Yasuda H. Plasma Soluble (Pro)renin Receptor Reflects Renal Damged. PloS One. 2016; 11(5): e0156165. doi:10.1371/journal.pone.0156165
-
Patel S, Rauf A, Khan H, Abu-Izneid T. Renin-angiotensin-aldosterone (RAAS): The ubiquitous system for homeostasis and pathologies. Biomedical and Pharmacology Journal. 2017; 94:317-325. doi: 10.1016/j.biopha.2017.07.091
-
Pohl MA, Blumenthal S, Cordonnier DJ, De Alvaro F, Defarrari G, Eisner G, et al. Independent and additive impact of blood pressure control and angiotensin II receptor blockade on renal outcomes in the irbesartan diabetic nephropathy trial: clinical implications and limitations. J Am Soc Nephrol. 2005; 16:3027–3037. doi: 10.1681/ASN.2004110919
-
Ramkumar N, Stuart D, Peterson CS, Hu C, Wheatley W, Cho JM, Symons JD, Kohan DE. Loss of Soluble (Pro)renin Receptor Attenuates Angiotensin-II Induced Hypertension and Renal Injury. Circulation Research. 2021; 129:50-62. doi: 10.1161/CIRCRESAHA.120.317532
-
Ramseyer VD, Garvin JL. Tumor necrosis factor-α: regulation of renal function and blood pressure. American Journal of Physiology-Renal Physiology. 2013; 304(10): F1231-F1242. doi: 10.1152/ajprenal.00557.2012
-
Roberts AB, Sporn MB, Assoian RK, Smith JM, Roche NS, Wakefield LM, Heine UI, Liotta LA, Falanga V, Kehrl JH, et al. Transforming growth factor type beta: rapid induction of fibrosis and angiogenesis in vivo and stimulation of collagen formation in vitro. Proceedings of the National Academy of Sciences of the United States of America. 1986; 83(12): 4167-4171. doi: 10.1073/pnas.83.12.4167
-
Rodriguez-Pena AB, Grande MT, Eleno N, Arevalo M, Guerrero C, Santos E, Lopez-Novoa JM. Activation of Erk1/2 and Akt following unilateral ureteral obstruction. Kidney International. 2008; 74(2): 196-209. doi: 10.1038/ki.2008.160
-
Saris JJ, Hoen PAC, Garrelds IM, Dekkers DHW, Dunnen JT, Lamers JMJ, Danser AHJ. Prorenin Induces Intracellular Signaling in Cardiomyocytes Independently of Angiotensin II. Hypertension. 2006; 48(4): 564-571. doi: 10.1161/01.HYP.0000240064.19301.1b
-
Segerer S, Nelson PJ, Schlondorff D. Chemokines, chemokine receptors, and renal disease: from basic science to pathophysiologic and therapeutic studies. Journal of American Society of Nephrology. 2000; 11(1): 152-176. doi: 10.1681/ASN.V111152
-
Shepard BD. Sex differences in diabetes and kidney disease: mechanisms and consequences. American Journal of Physiology-Renal Physiology. 2019; 317: F456–F462. doi: 10.1152/ajprenal.00249.2019
-
Sikand K, Singh J, Ebron JS, Shukla GC. Housekeeping Gene Selection Advisory: Glyceraldehyde-3-Phosphate Dehydrogenase (GAPDH) and β-Actin Are Targets of miR-644a. PLoS One. 2012; 7(10): e47510. doi: 10.1371/journal.pone.0047510
-
Su H, Lei CT, Zhang C. Interleukin-6 Signaling Pathway and Its Role in Kidney Disease: An Update. Frontiers in Immunology. 2017; 8: 405. doi: 10.3389/fimmu.2017.00405
-
Timmeren MM, Heuvel MC, Baily V, Bakker SJL, Goor H, Stegeman CA. Tubular kidney injury molecule-1 (KIM-1) in human renal disease. The Journal of Pathology. 2007; 212(2): 209-217. doi: 10.1002/path.2175
-
Vaughan ED, Marion D, Poppas DP, Felsen D. Pathophysiology of Unilateral Ureteral Obstruction: Studies From Charlottesville to New York. Journal of Urology. 2004; 172(6): 2563-2569. doi: 10.1097/01.ju.0000144286.53562.95
-
Webster AC, Nagler EV, Morton RL, Masson P. Chronic Kidney Disease. The Lancet. 2017; 389:1238-1252. doi: 10.1016/S0140-6736(16)32064-5
-
Wu CH, Mohammadmoradi S, Thompson J, Su W, Gong M, Nguyen G, Yiannikouris F. Adipocyte (Pro)Renin-Receptor Deficiency Induced Lipodystrophy, Liver Steatosis and Increased Blood Pressure in Male Mice. Hypertension. 2016; 68(1): 213-219. doi: 10.1161/HYPERTENSIONAHA.115.06954
-
Wuthrich RP. Intercellular adhesion molecules and vascular cell adhesion molecule-1 and the kidney. Journal of American Society of Nephrology. 1992; 3(6): 1201-1211. doi: 10.1681/ASN.V361201
Acknowledgements
My work here and my thesis would not have been possible without the guidance of my mentor and principal investigator, Dr. Nirupama Ramkumar. Dr. Ramkumar has been instrumental in my understanding of this project, her research, and the work that I have completed. She is an amazing mentor for not only my research aspirations, but also for my path to medical school. I will be eternally grateful for the two years that I have had the opportunity to spend in her laboratory.
I am further grateful for Deborah Stuart, BS and Will Wheatley, MS, in the laboratory, not only for their assistance and contributions to this project, but also for their roles as mentors and leaders in my scientific journey. They have taught me much over the years and I am grateful for their willingness to help me learn and grow as a student in my college career.
Lastly, I am grateful to my parents for continuing to support me through all the ups and downs. It has not been the smoothest journey, but in the end, I am grateful for their love and support.
SUPPLEMENTARY MATERIALS