School of Medicine
42 Visualizing Movie Magic: Graphing Character Connections in Beloved Films
Porter Bischoff and George Vega Yon
Faculty Mentor: George Vega Yon (Internal Medicine, University of Utah)
Introduction
Network visualization tools are crucial in enabling researchers and professionals to comprehend complex data structures. Analyzing networks holds significant importance across various fields, including business (Jack, 2010), biology (Alm & Arkin, 2003), social sciences (Garton et al., 1997), health sciences (Deri, 2005), and more. In the field of network visualization and analysis, the tool most commonly used is R. The most common R packages for network visualizations include `igraph` (Csardi & Nepusz, 2005), `sna` (Butts, 2023), and `ggraph’ (Pedersen, 2022). Network visualization is both an art and a science and can be described as a visual aid to discover or analyze patterns in complex systems.
Graph visualization aspects
Network visualization involves choosing how to position nodes, also known as vertices, and edges, the connections, in the space, which in network science is called layout algorithms. Popular algorithms like Circle (Six & Tollis, 1999), DrL (Martin et al., 2007), Fruchterman-Reingold (Fruchterman & Reingold, 1991), Kamada-Kawai (Kamada & Kawai, 1989), and LGL (Adai et al., 2004) each have their strengths in displaying specific network structures. Graphing parameters, such as vertex size (Sharma & Chou, 2022; Zien et al., 1999), color (Ognyanova, n.d.), shape (Grapov & Newman, 2012), and edge width (Lin, 2018), play a crucial role in conveying information and highlighting patterns. By skillfully utilizing these components, network visualization becomes a powerful tool for understanding intricate relationships within the data. Additionally, considering the type of data is essential; egocentric data focuses on social network measurements surrounding a central individual (Marsden & Hollstein, 2023), while network analysis involves small networks with high clustering and short path lengths (Amaral et al., 2000; Bassett & Bullmore, 2006; Newman, 2001) and large networks with billions of nodes and edges (Blondel et al., 2008), capturing connections within communities. Bipartite networks, which model relationships between two distinct sets of entities, find applications in various fields (Banerjee et al., 2017). Understanding these different data types and their applications provides valuable insights into the complexities of interconnected systems.
`Netplot` (Yon & Bischoff, 2023) was created as an alternative option for plotting network data to those mentioned above. It is built on the grid plotting system, the same used by the popular `ggplot2`. Like `ggplot2`, its focus is mainly on aesthetics, providing beautiful visualizations right out of the box. The plot below shows the differences between `netplot` and the most popular alternatives; which we presented during the 2023 SPUR program at the University of Utah:
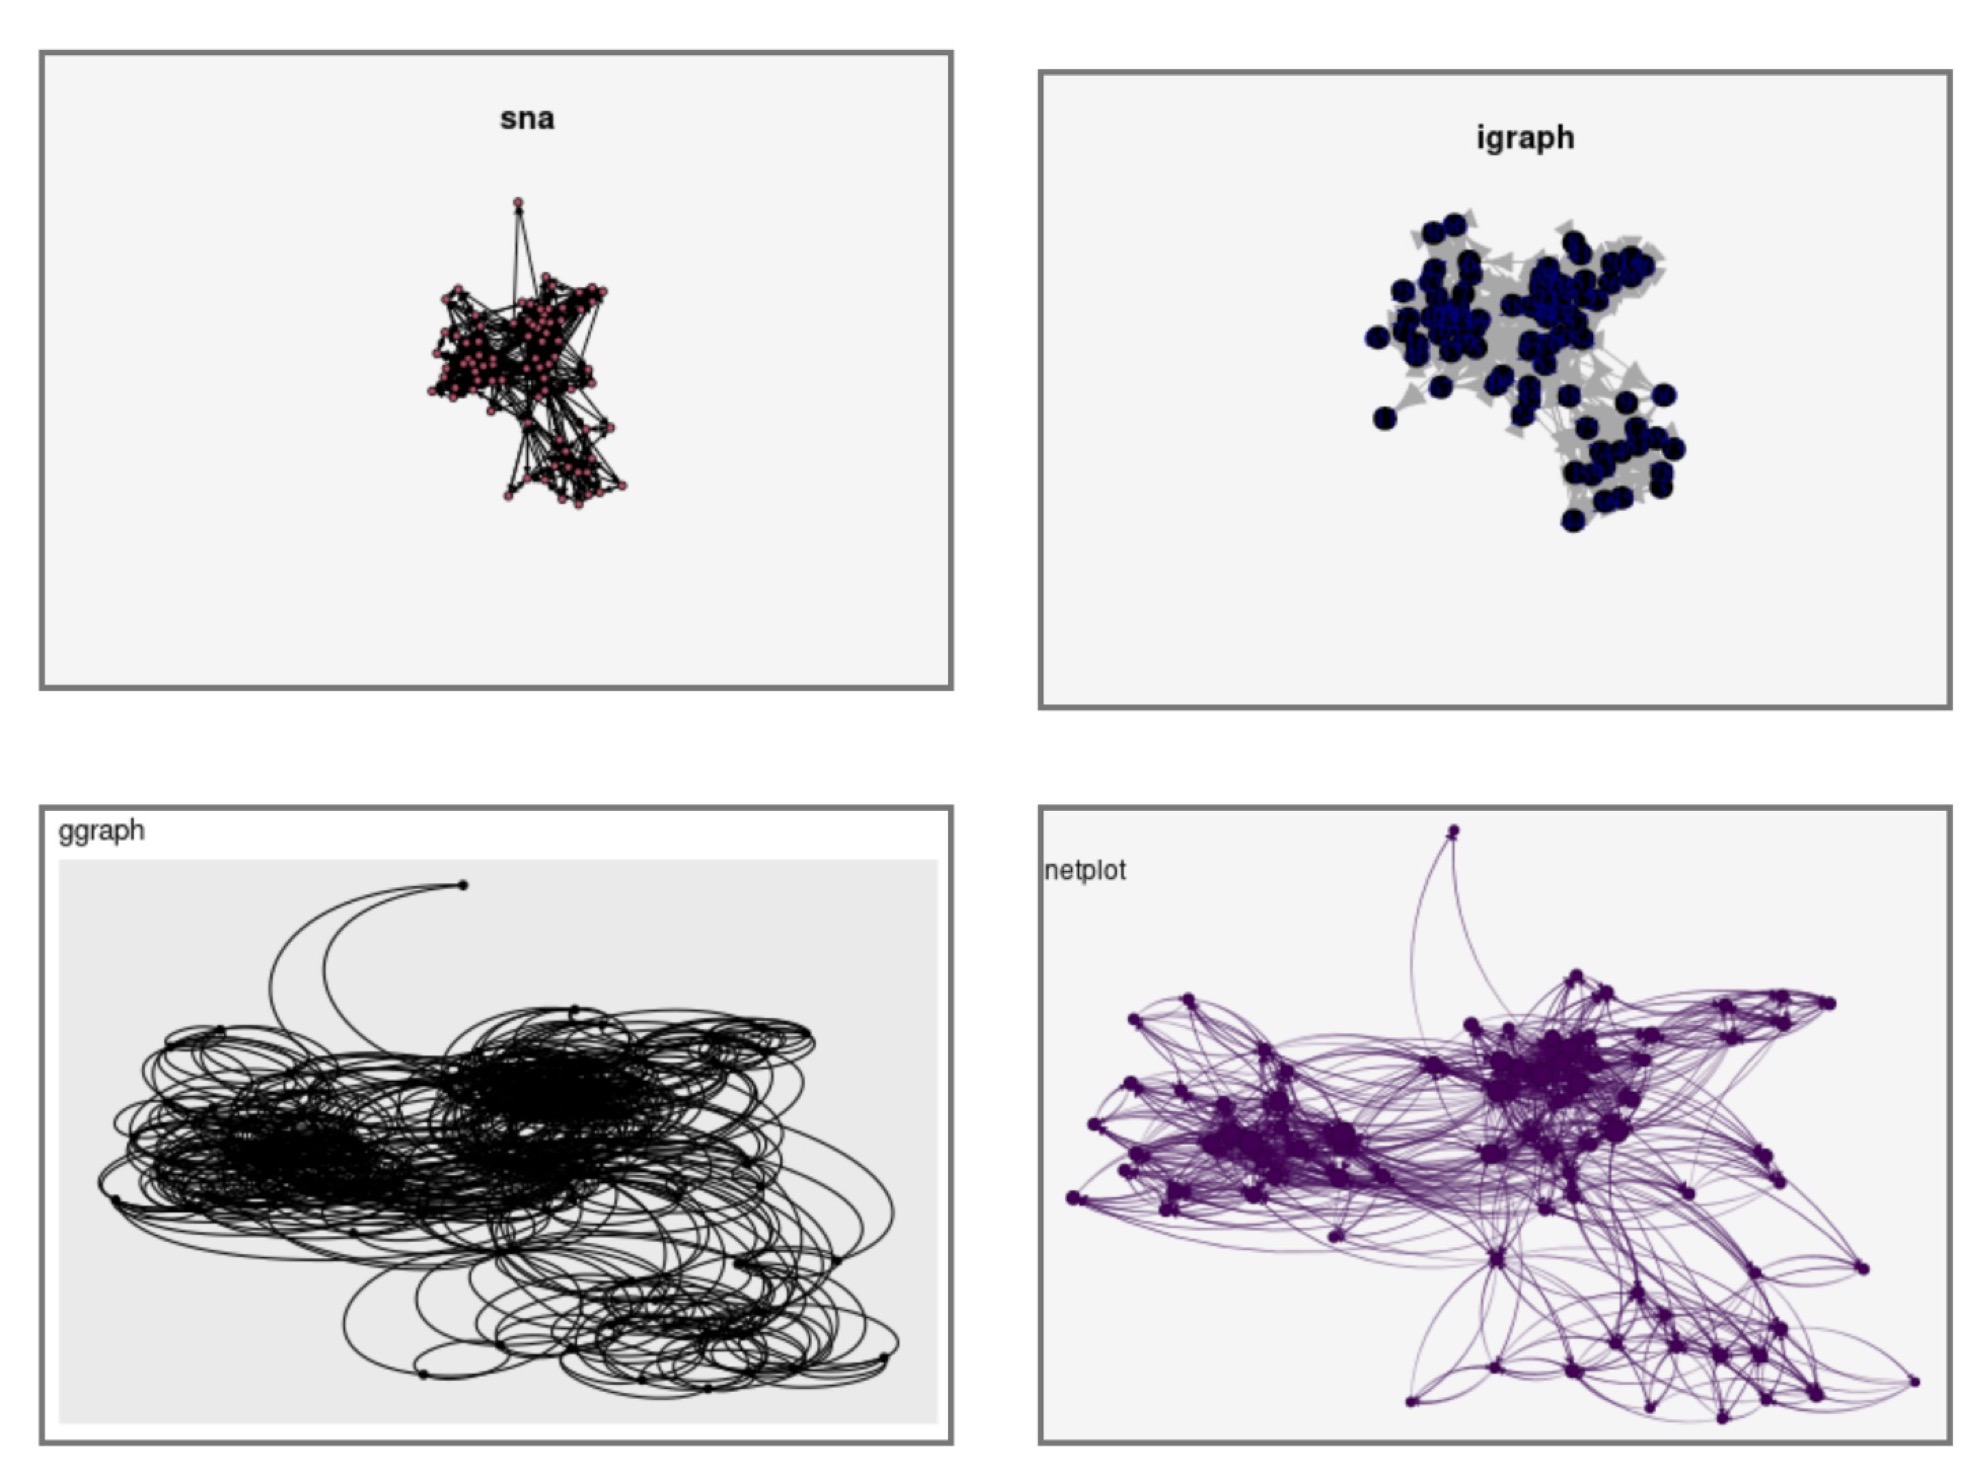
Figure 1
In what follows, I present a few examples of the `netplot` R package using data from the `networkdata` R package (Schoch, 2021).
Movie walkthrough
The `networkdata` package features 979 datasets with 2,135 networks, giving us a great place to explore some of the strengths of the `netplot` package. Here, I will focus on a subset including ~775 networks of movie characters. Of the latter, I will use `netplot` to visualize five of my favorites.
First, we need to load in the packages, as taught by Schochastics in 2019:
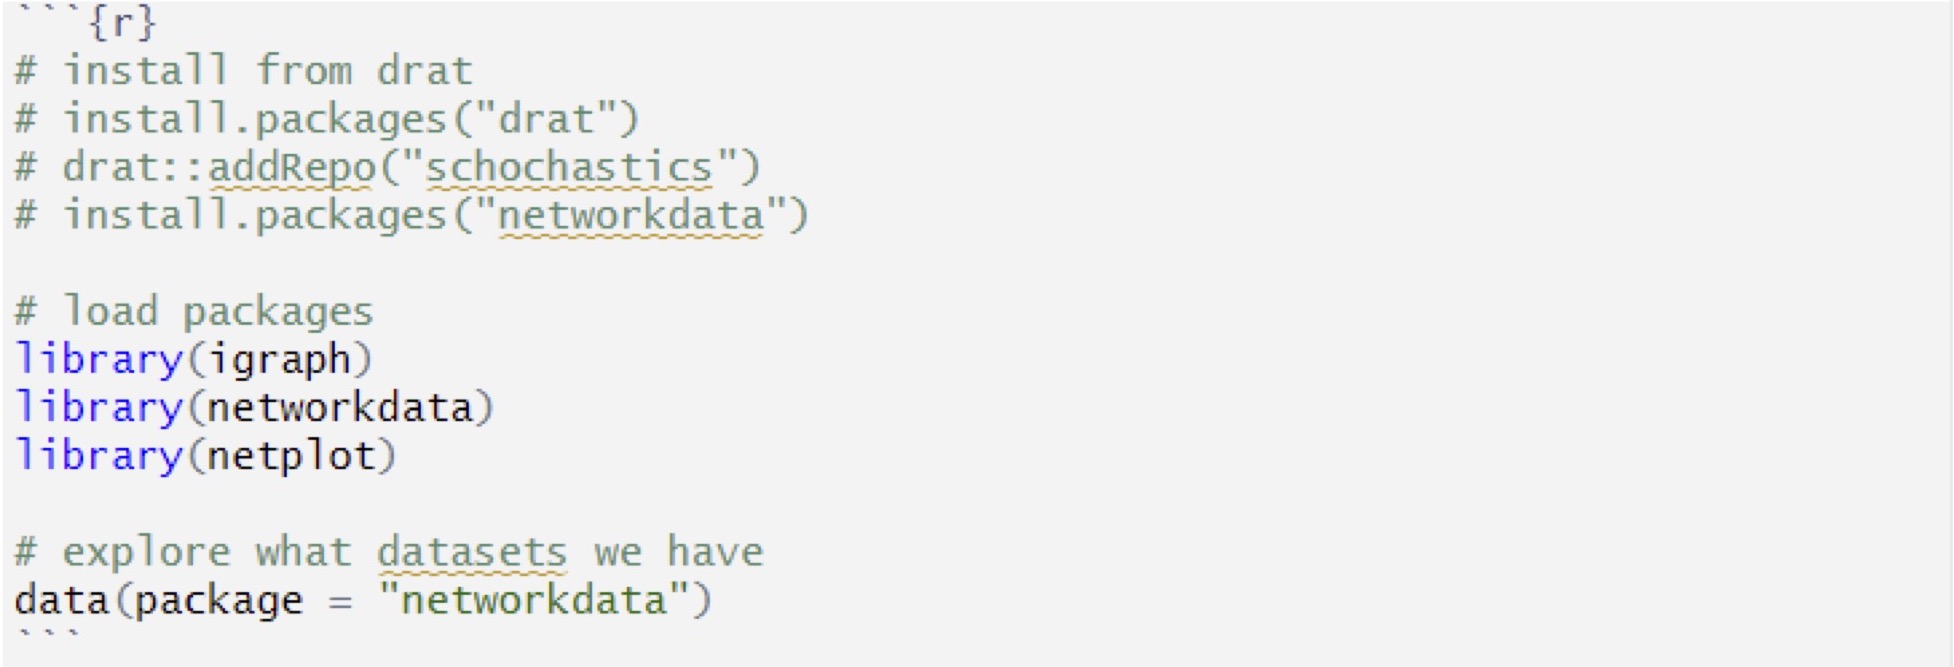
Figure 2
Following that, we are ready to identify our movies. Here is our code showing how to do that with the `networkdata` package:

Figure 3
The “xmen” dataset comes from the film titled “X-Men” (X-Men (2000) – IMDb, n.d.). The “dumb_and_dumber” dataset comes from the film titled “Dumb and Dumber” (Dumb and Dumber (1994) – IMDb, n.d.), while the “indiana_jones” dataset comes from the film titled “Indiana Jones and the Last Crusade” (Indiana Jones and the Last Crusade (1989) – IMDb, n.d.). Lastly, the dataset titled “mission_impossible” is from the film titled “Mission: Impossible” (Palma, 1996), and the “star_wars” dataset comes from the film titled “Star Wars: Episode IV – A New Hope” (Star Wars: Episode IV – A New Hope (1977) – IMDb, n.d.)
X-Men
First, let’s plot the “xmen” dataset:
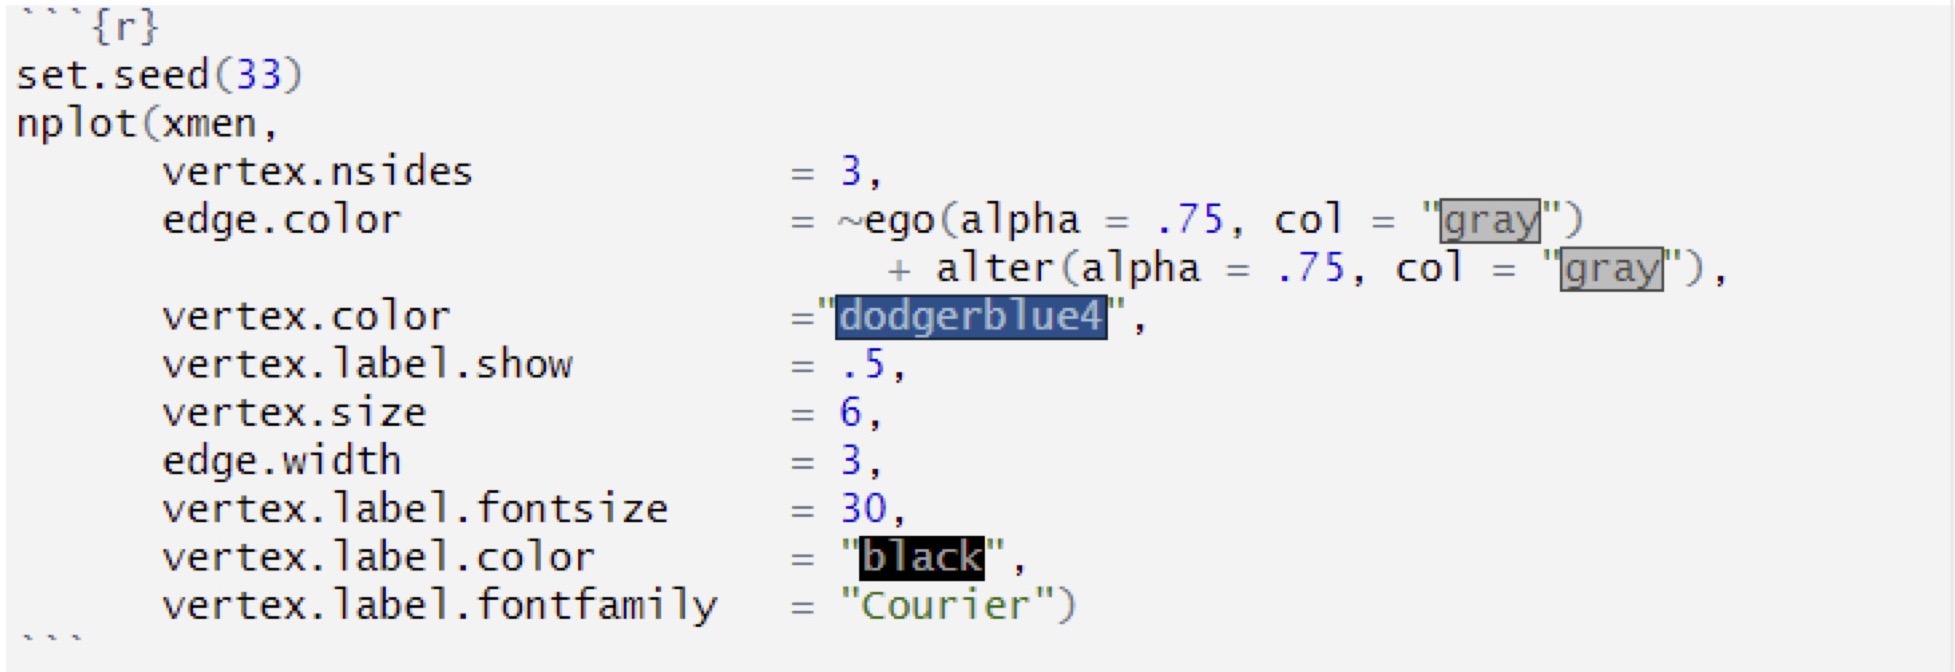
Figure 4
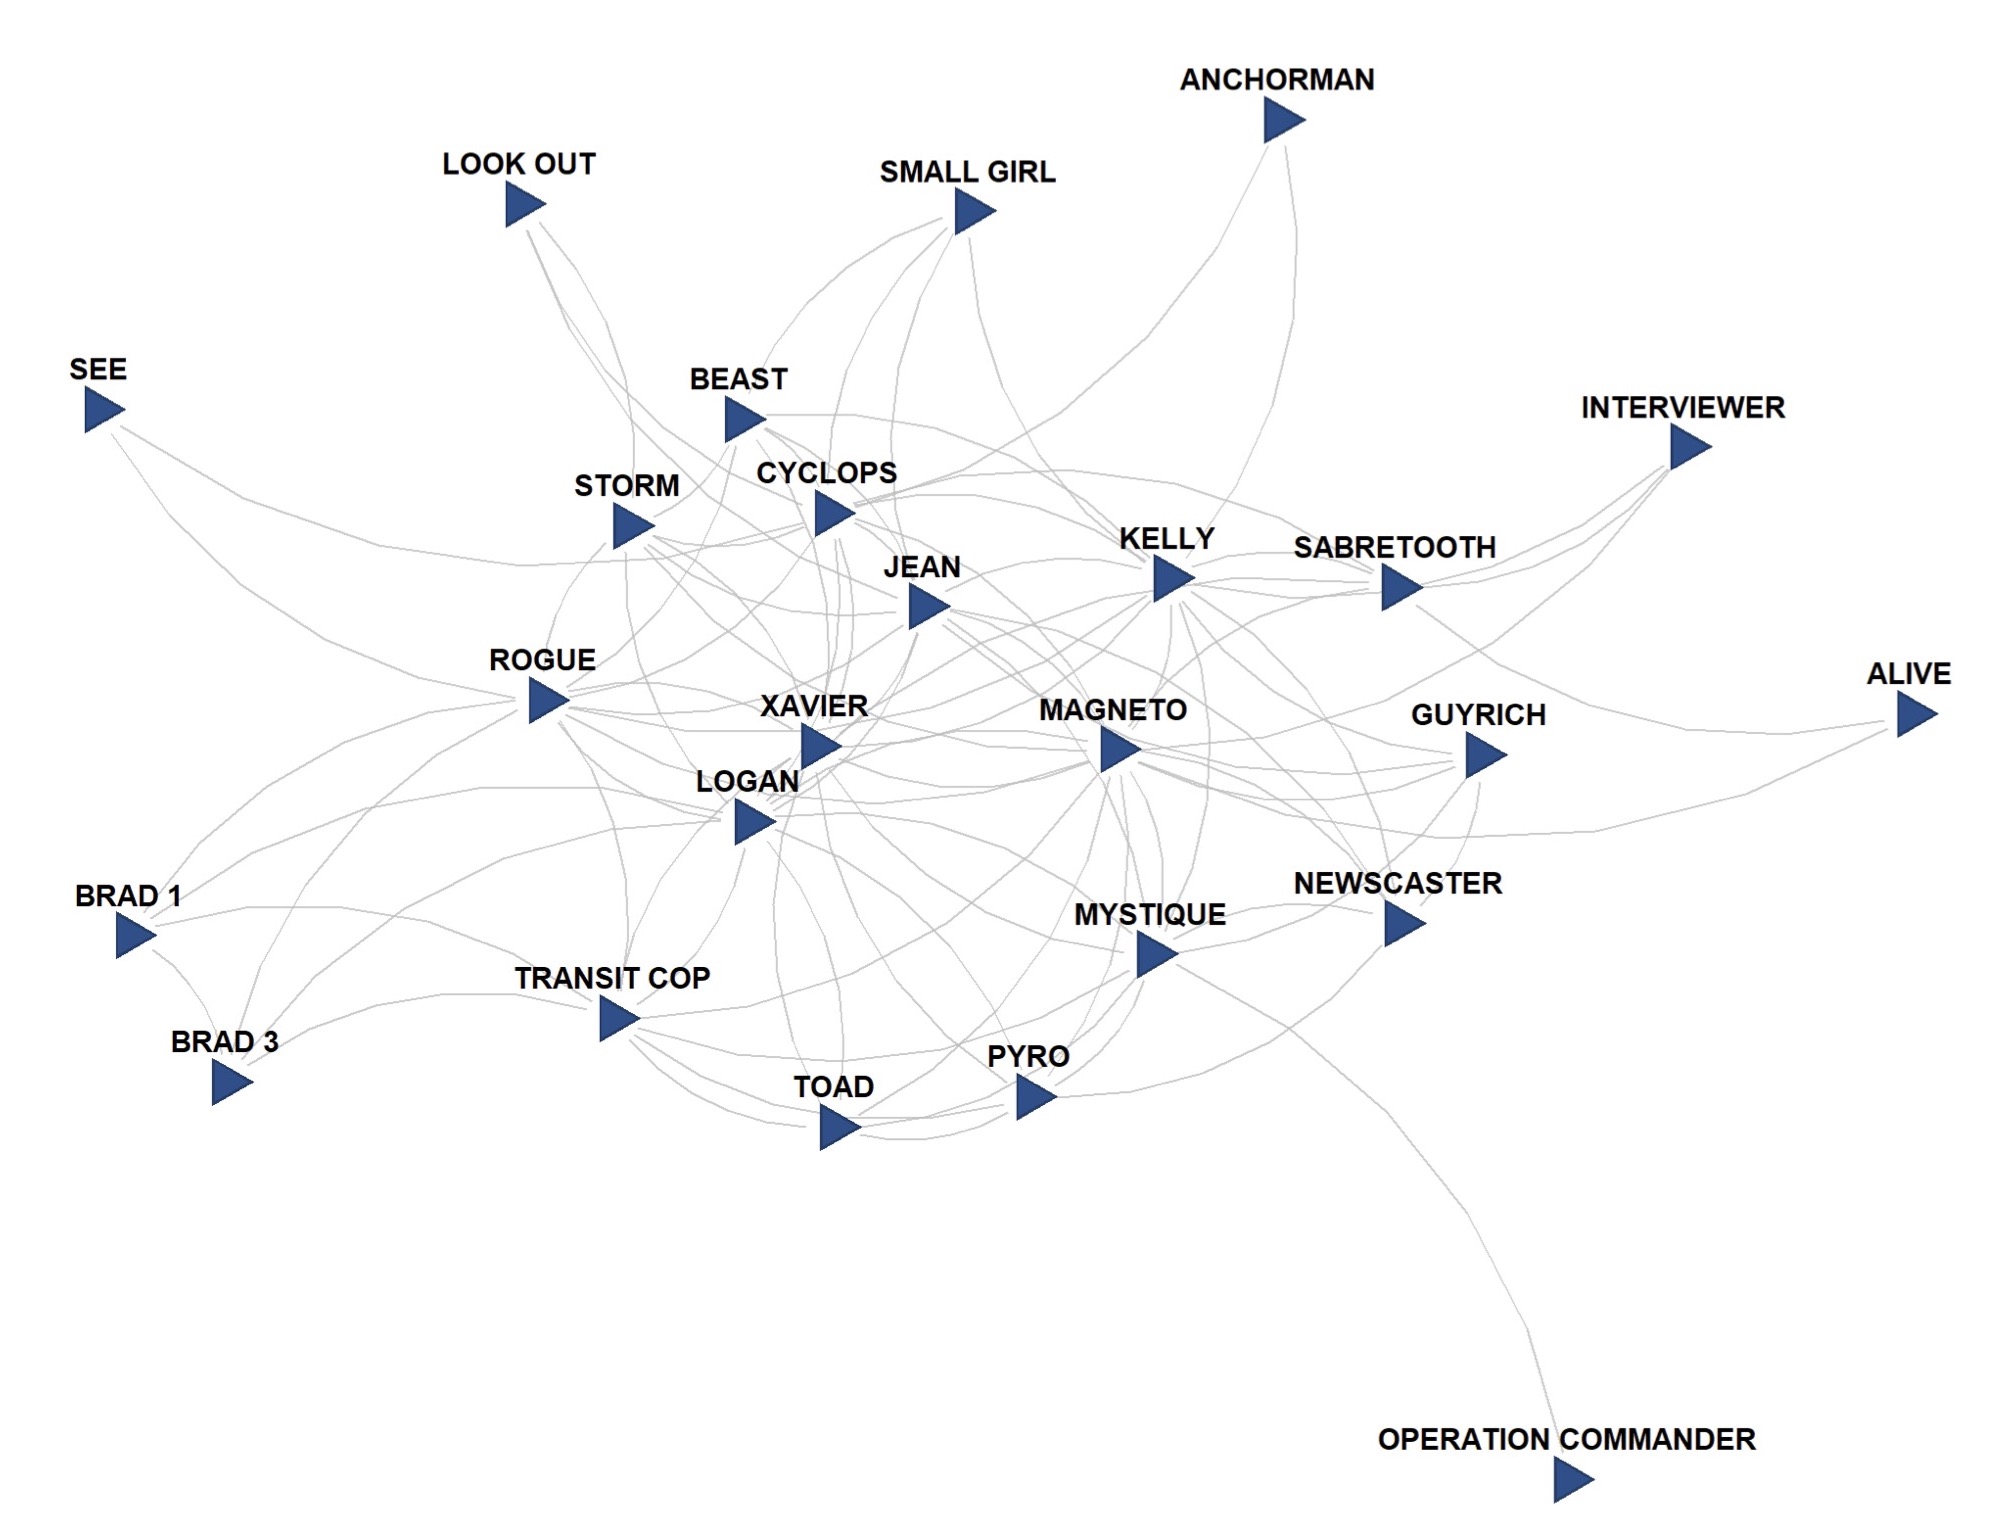
Figure 5
As we can see, Magneto, Logan, Rogue, and others are very connected, while characters like Anchorman or See are not as connected. As for what `netplot` shows, the nodes are blue triangles, and the edges are gray.
Dumb and Dumber
We will next run an analysis on the “dumb_and_dumber” network data. Here is the code to create the plot:
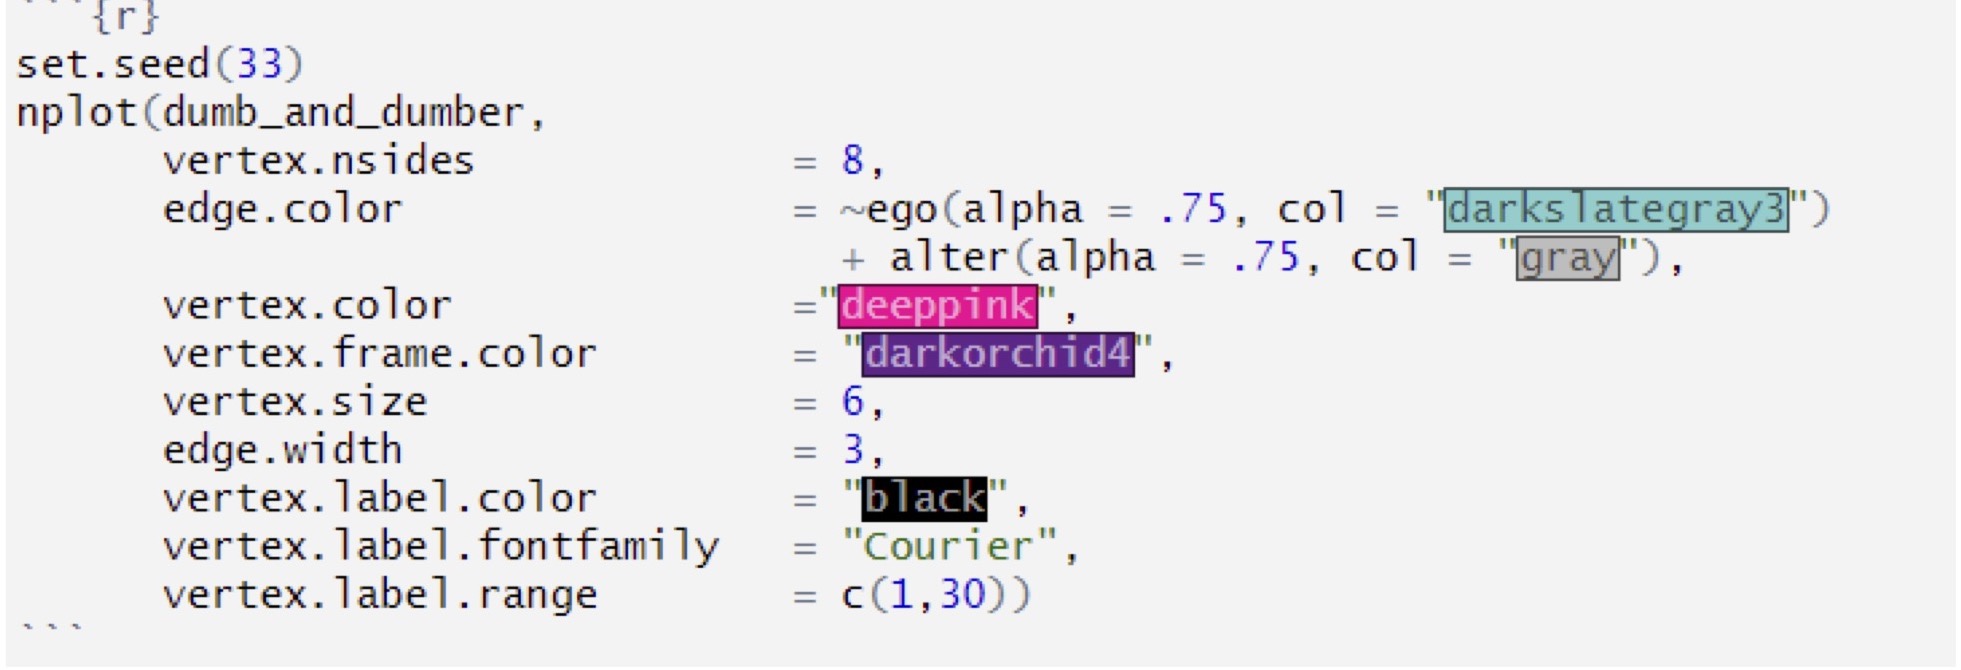
Figure 6
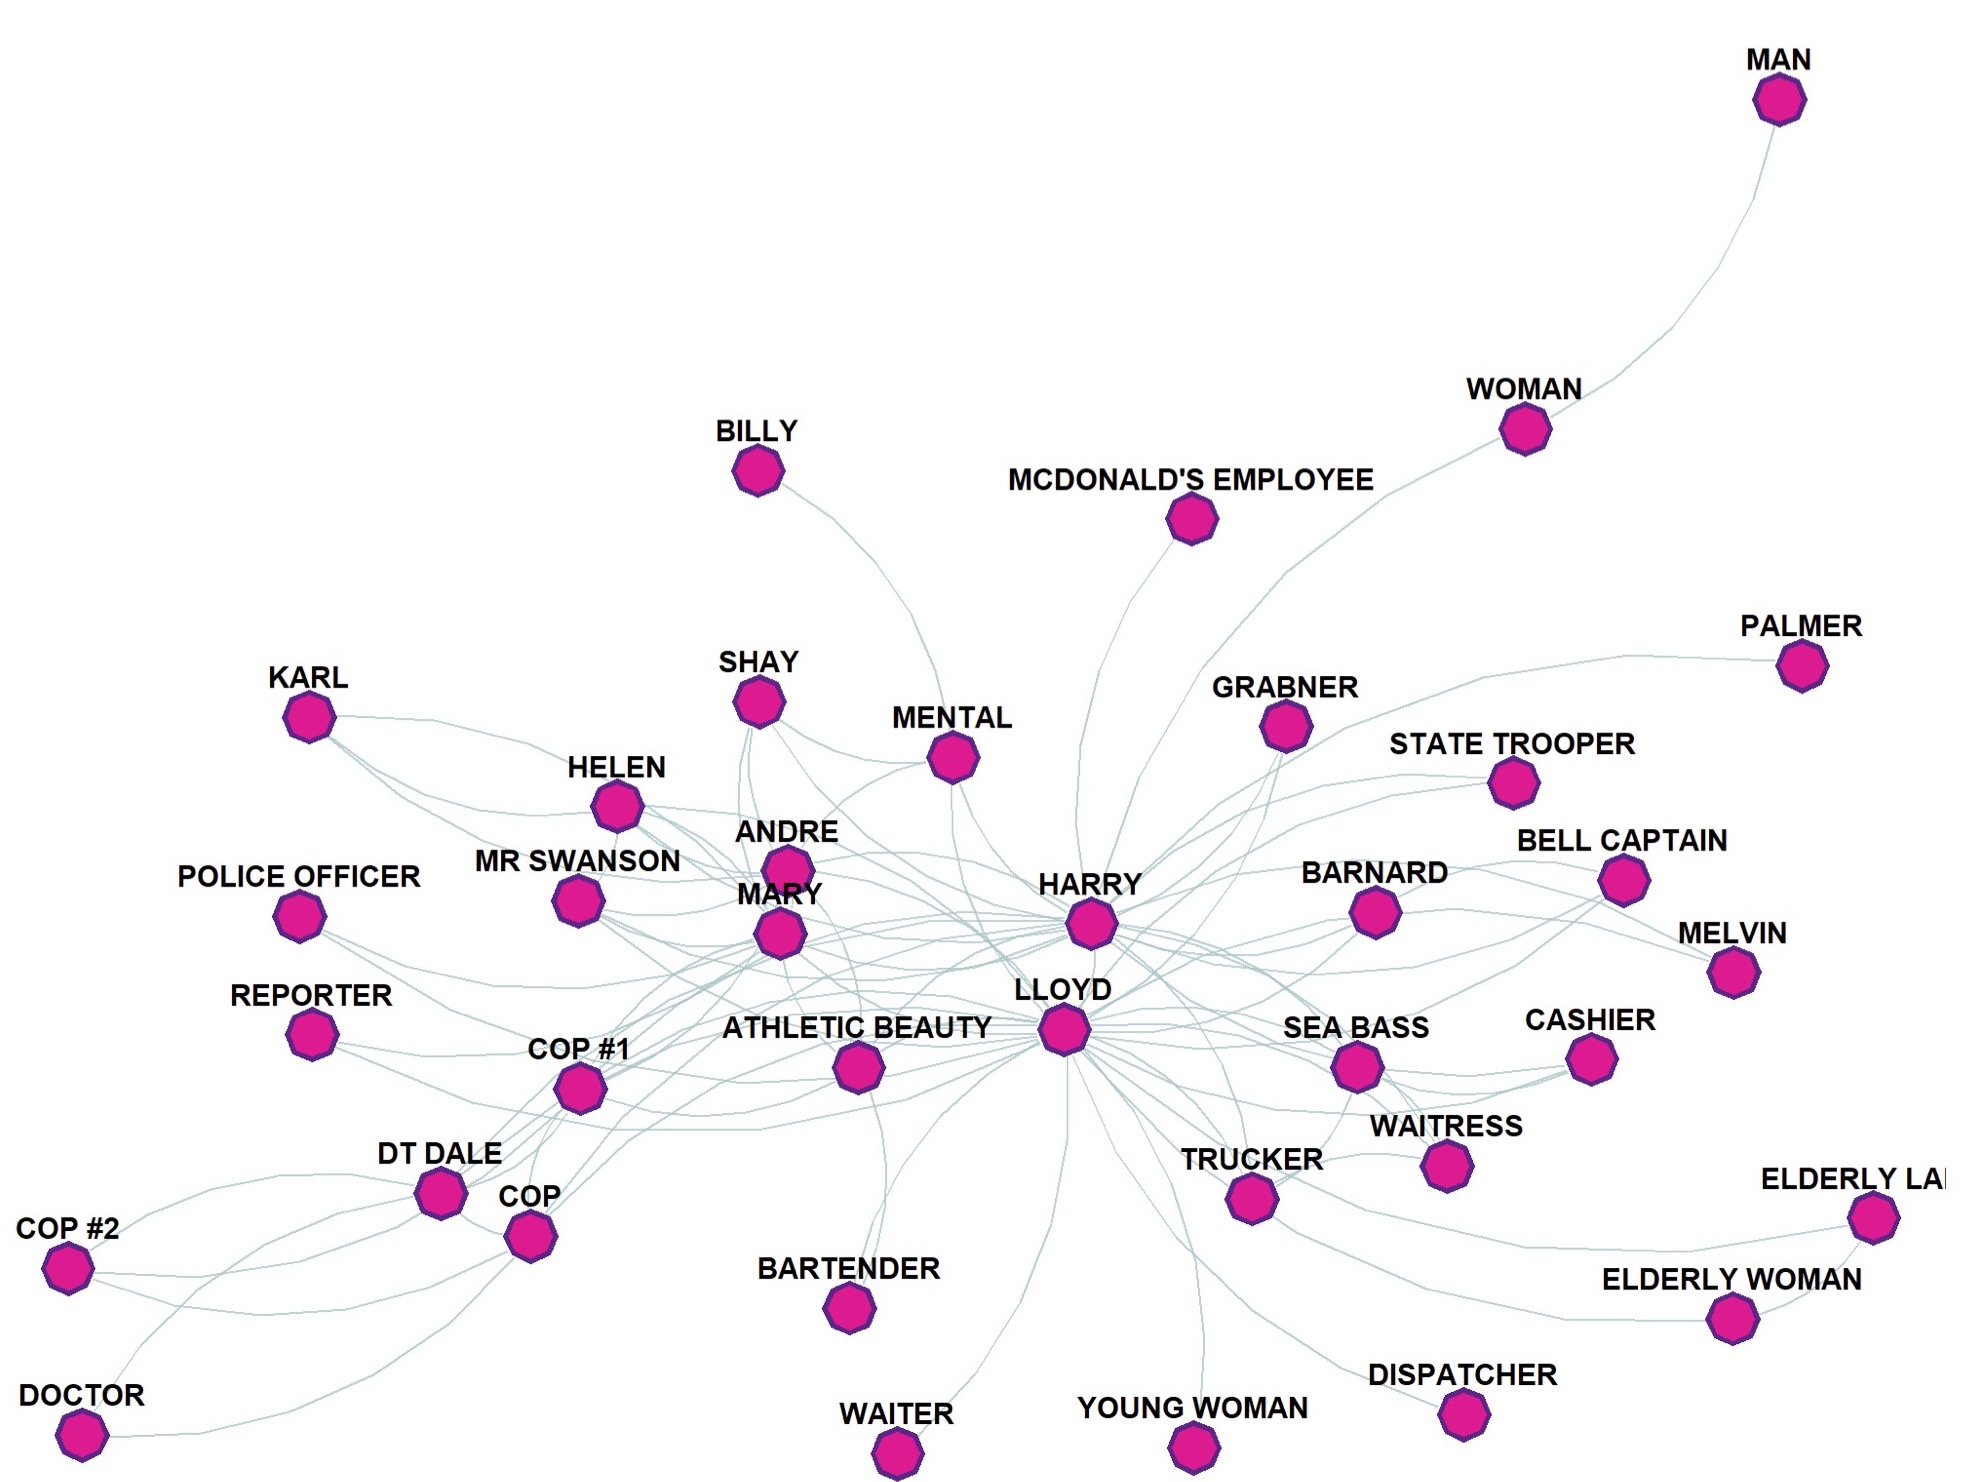
Figure 7
We manipulated the number of sides, vertex and vertex frame colors, and the color of the edges. This helps us see that Harry and Lloyd are some of the most connected in the movie.
Indiana Jones
Let’s take a look at the “Indiana_jones” dataset:
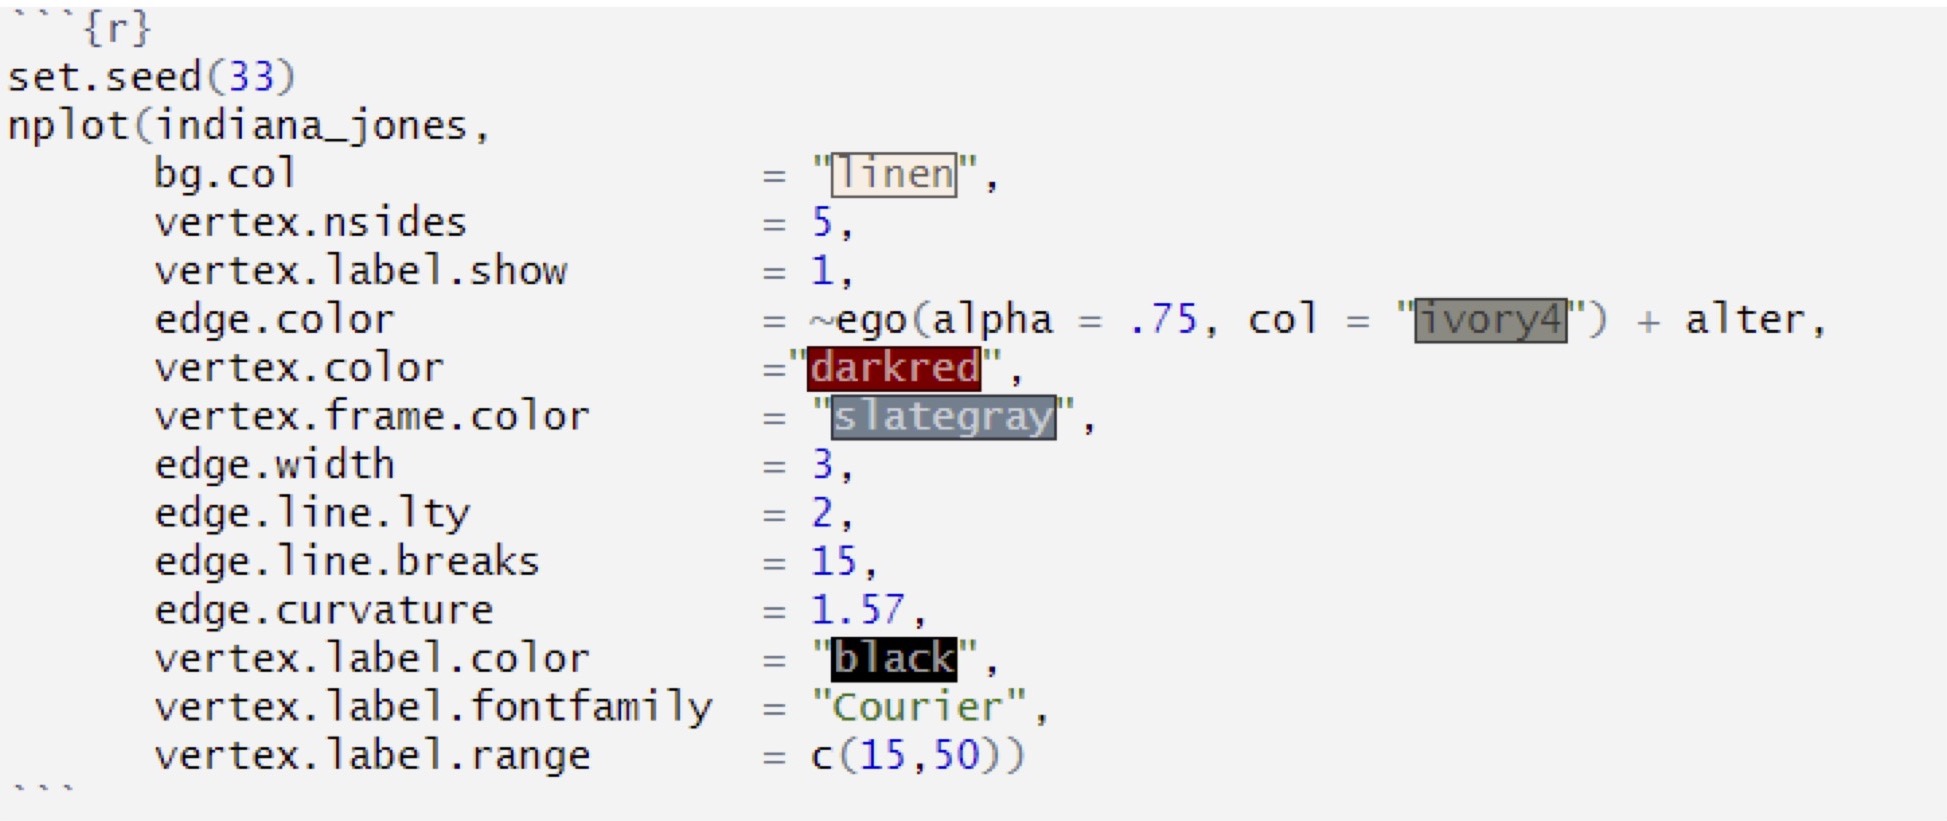
Figure 8
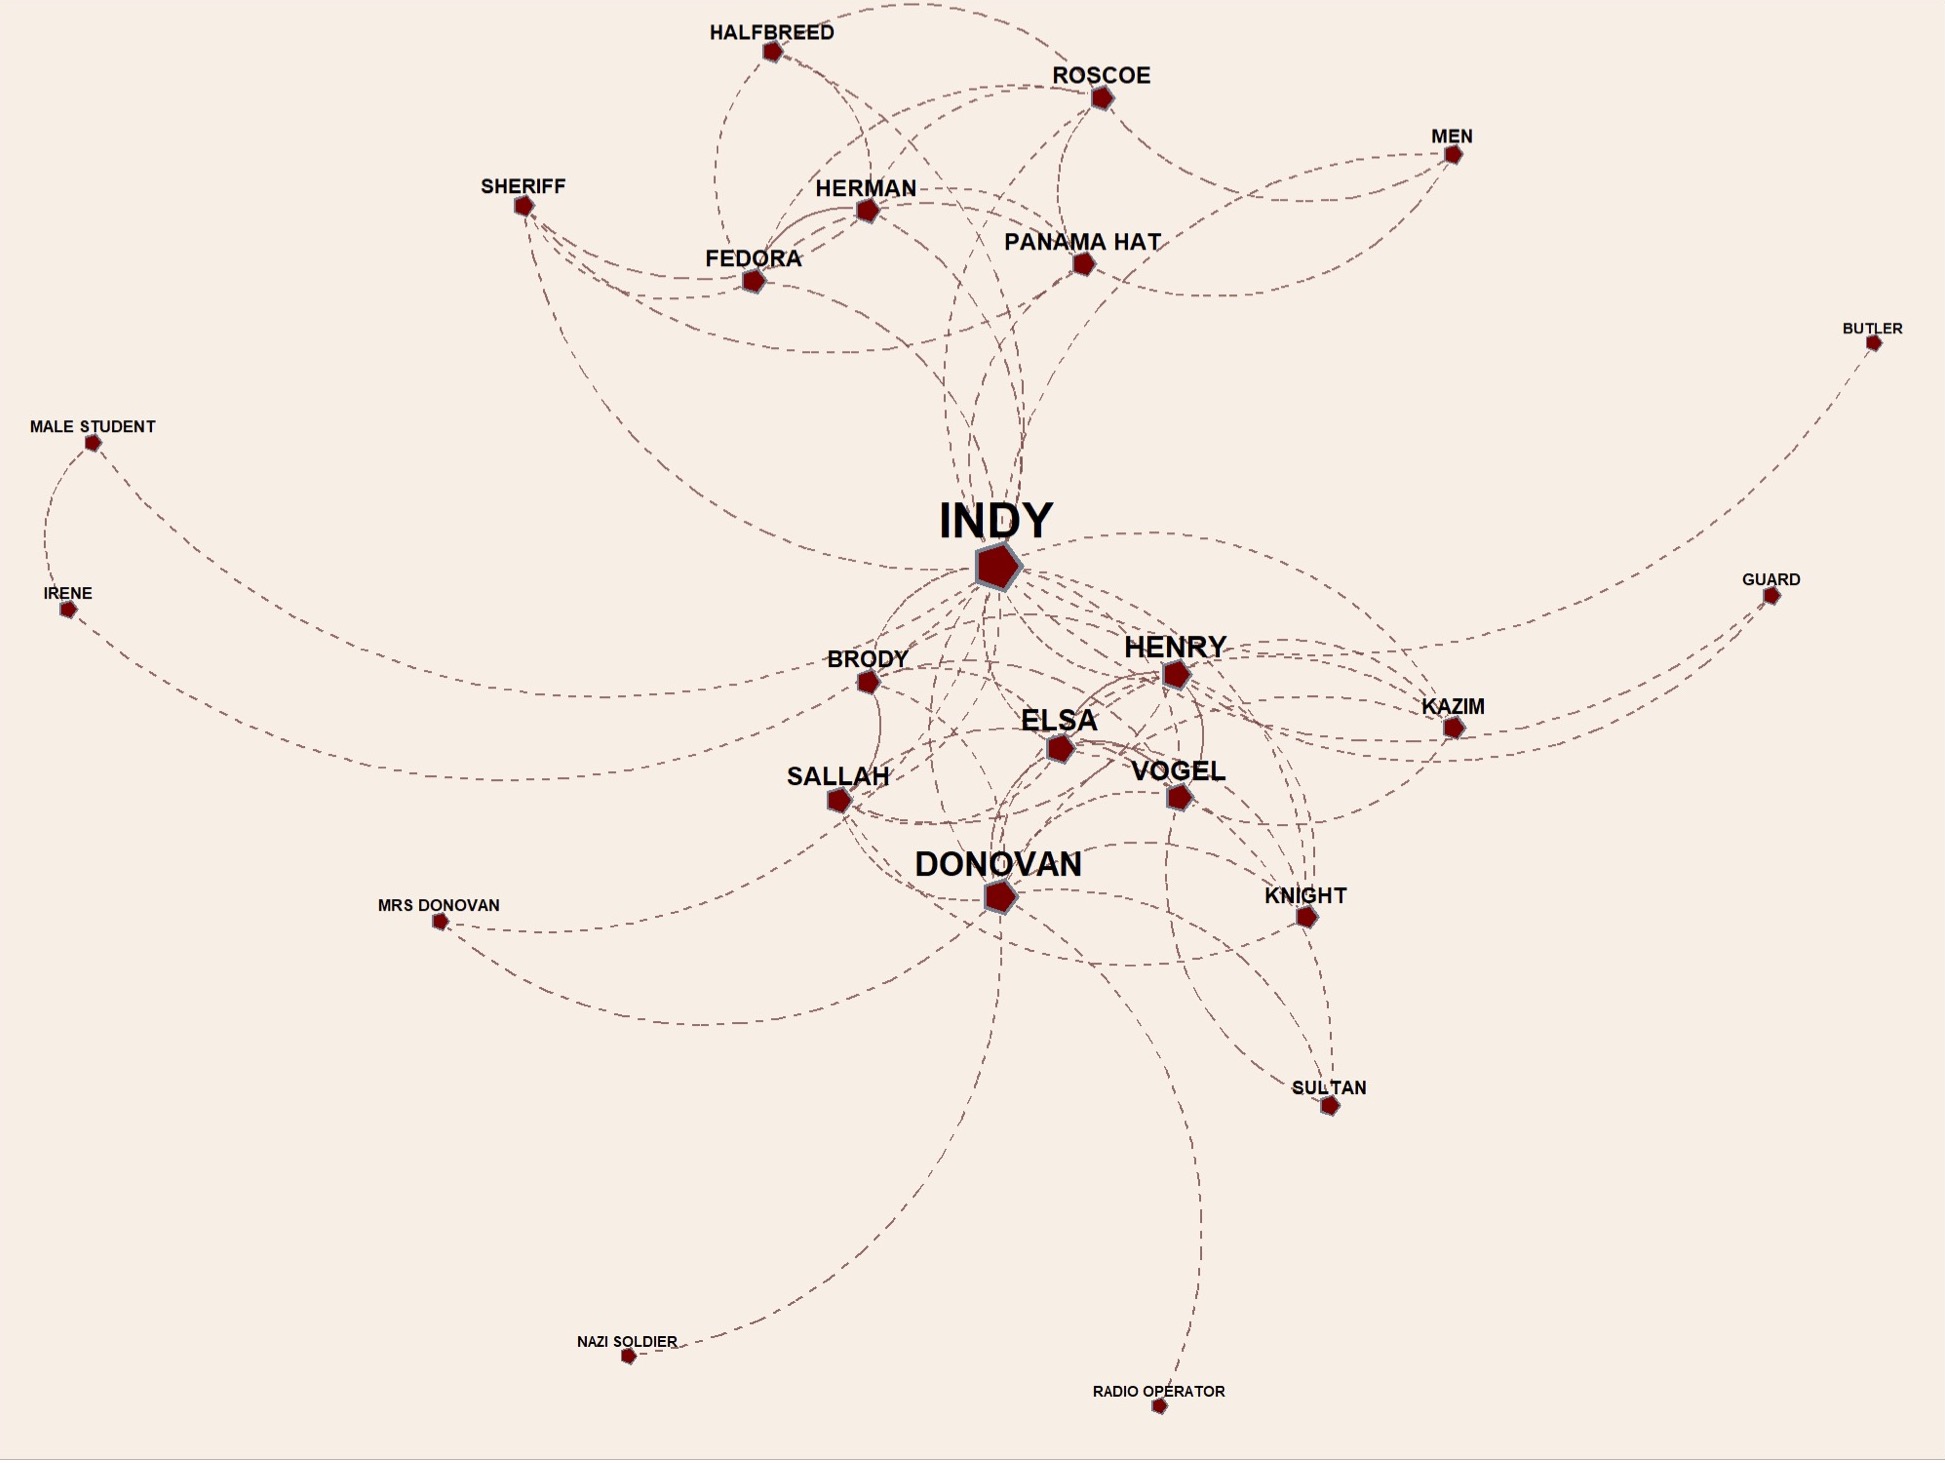
Figure 9
Here, we adjusted the size of the names according to how many connections they have while adding a background color, making the lines dotted, changing the vertices to a red pentagon, and making the lines have a steeper curve.
Mission: Impossible
Our next step will be working with the “mission_impossible” dataset:

Figure 10
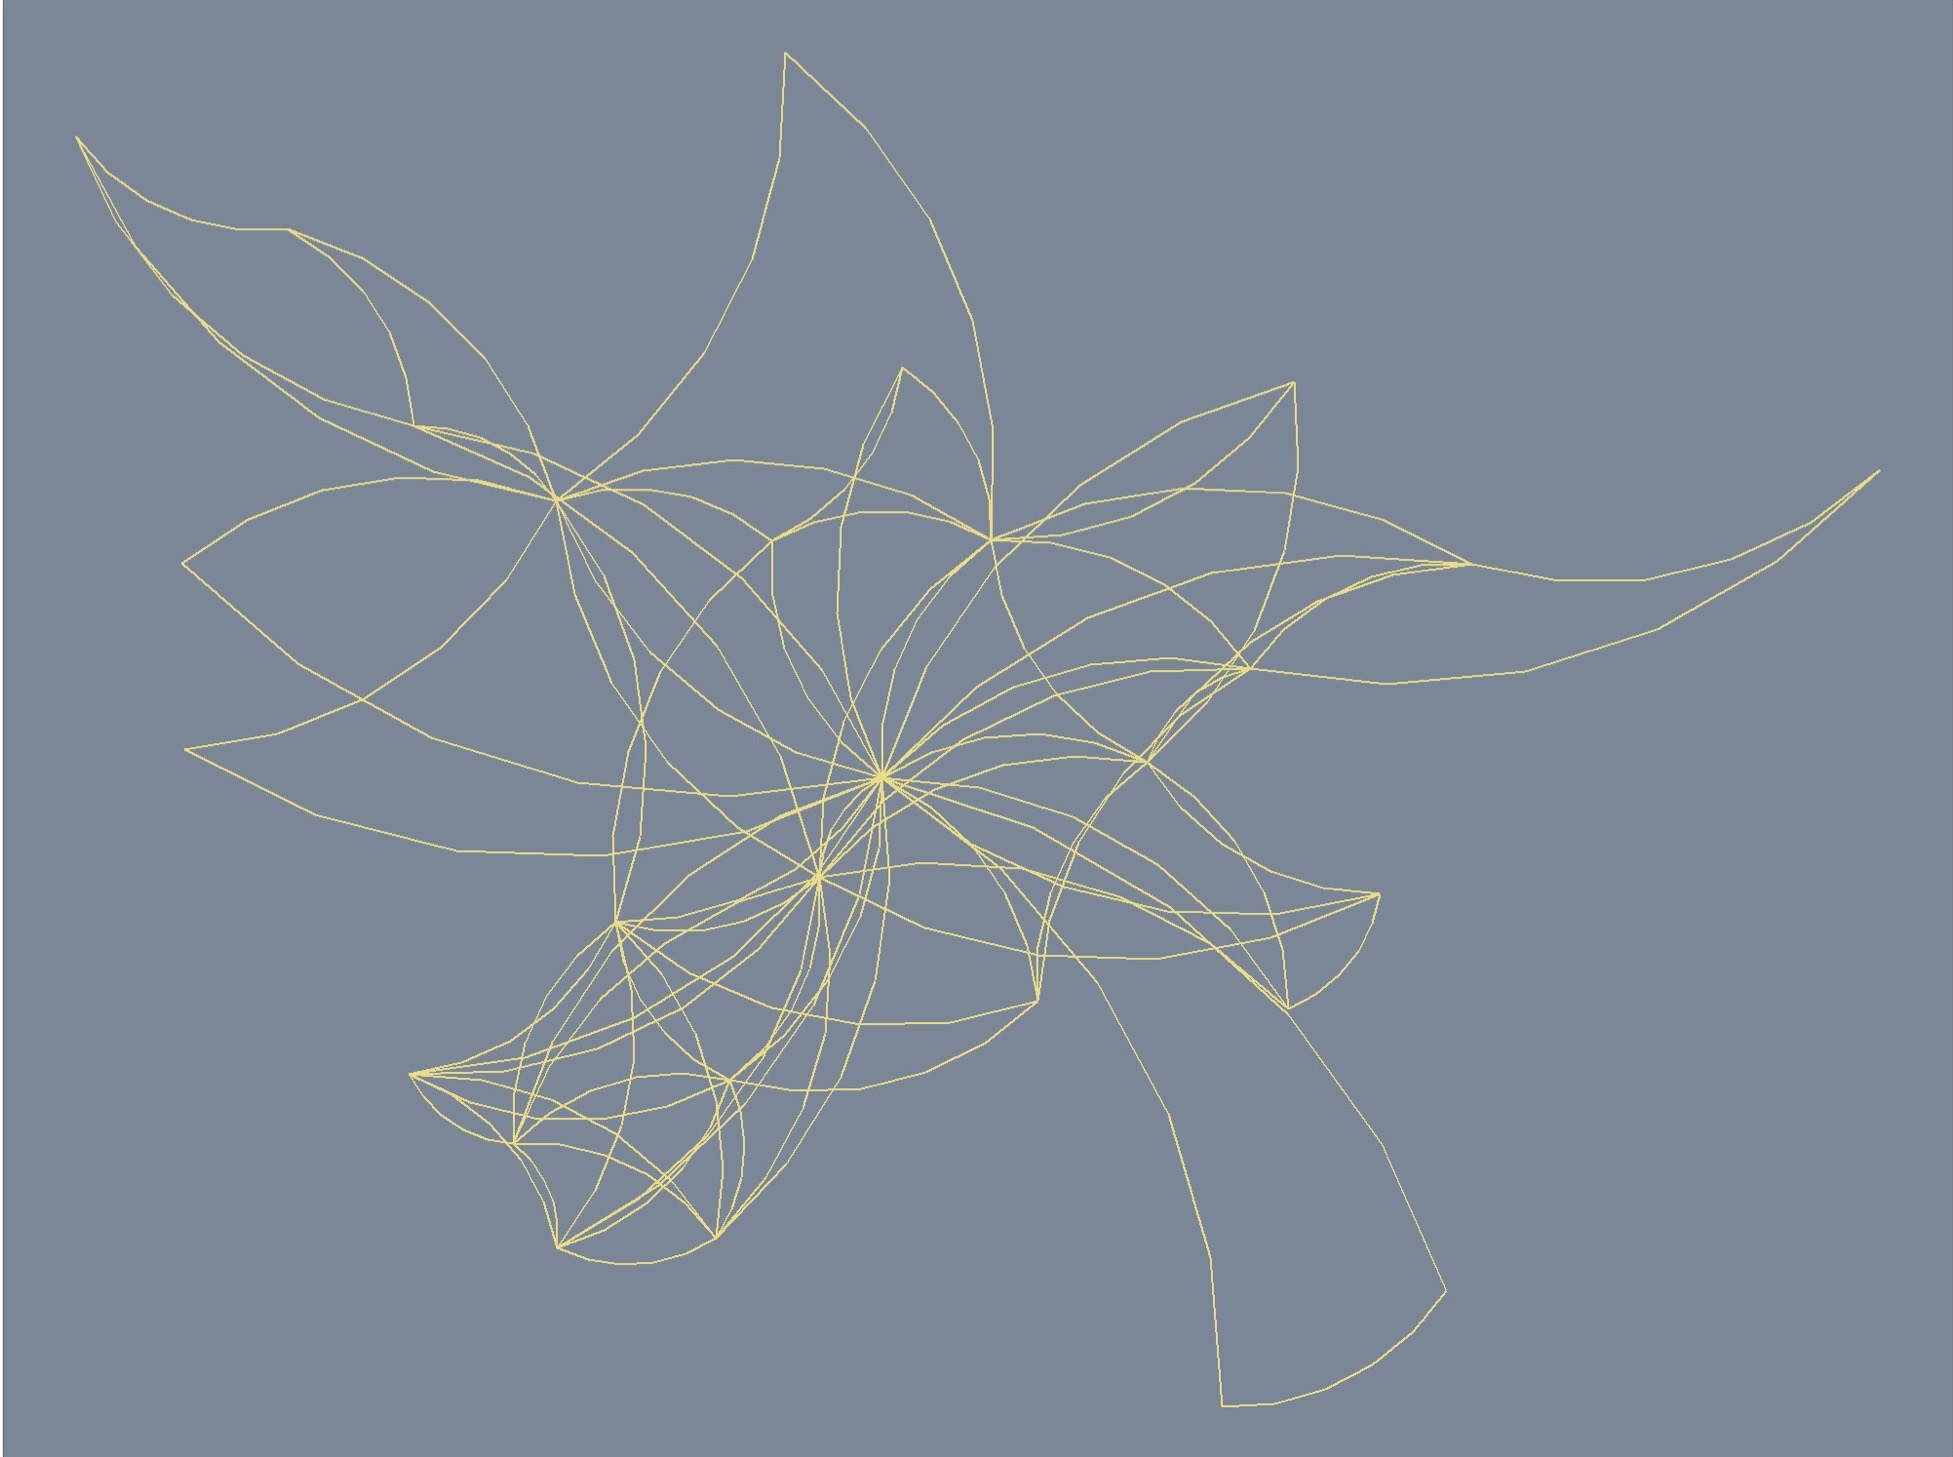
Figure 11
Here, we see that we can skip drawing vertices altogether to focus on the connections alone, which is a convenient approach when dealing with large networks.
Star Wars
Lastly, we will visualize the “star_wars” dataset. Our first step for this is to manually assign the roles the characters had in the movie, whether they were “Rebels”, “Empire”, or part of the supporting cast:
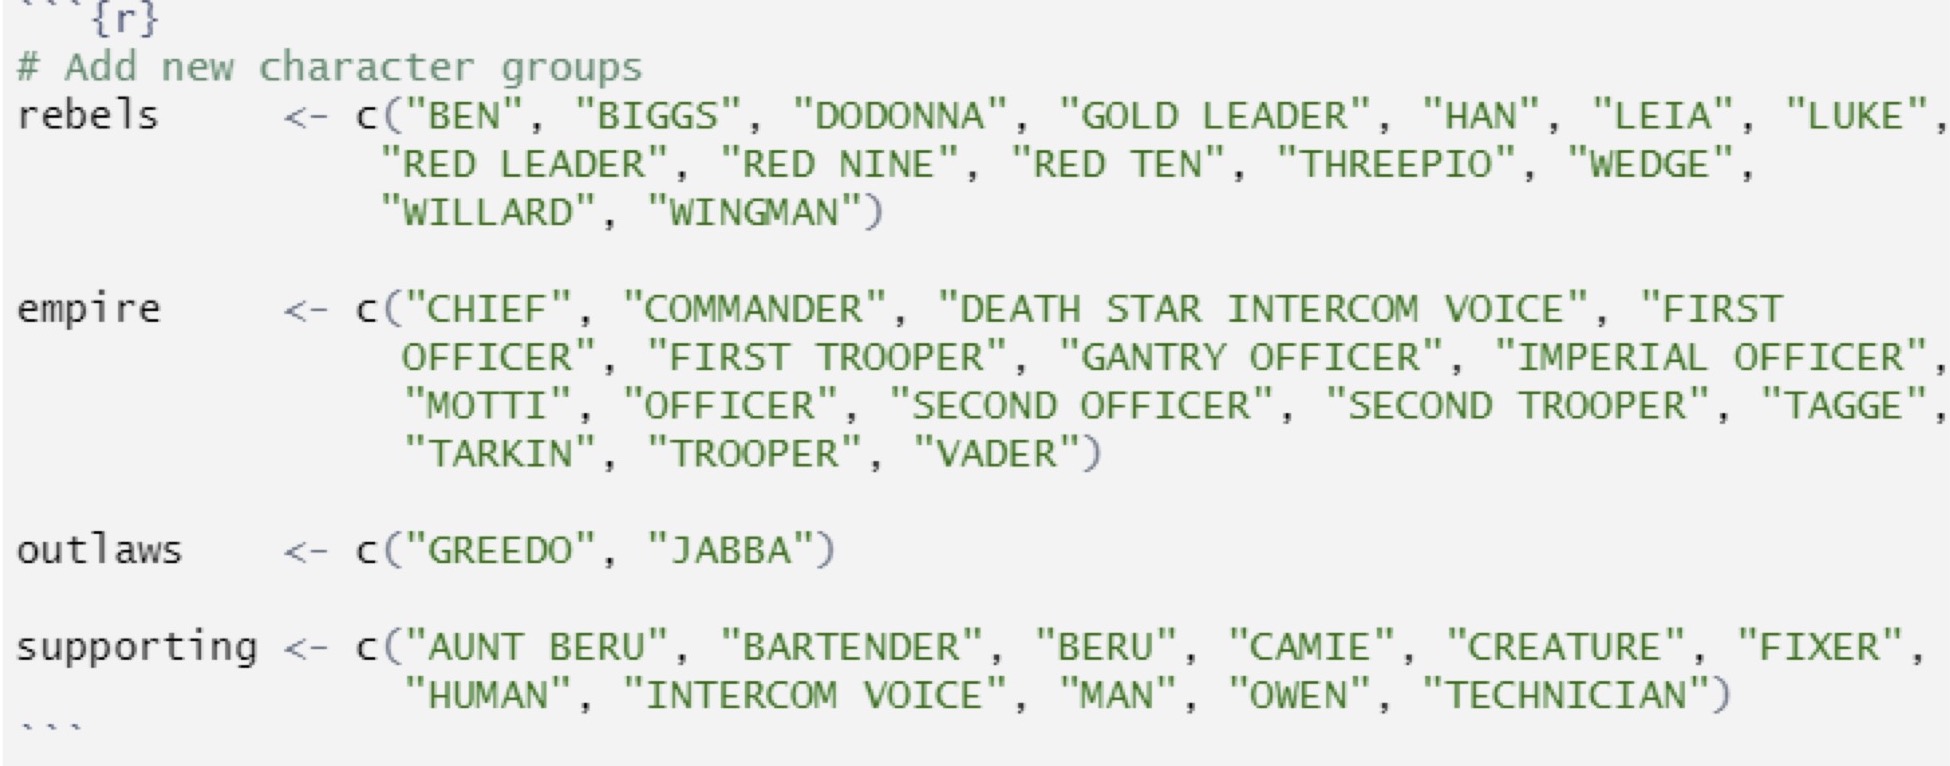
Figure 12
After, we add these attributes back to the original dataset we had:

Figure 13
And lastly, we need to plot the data with a legend:
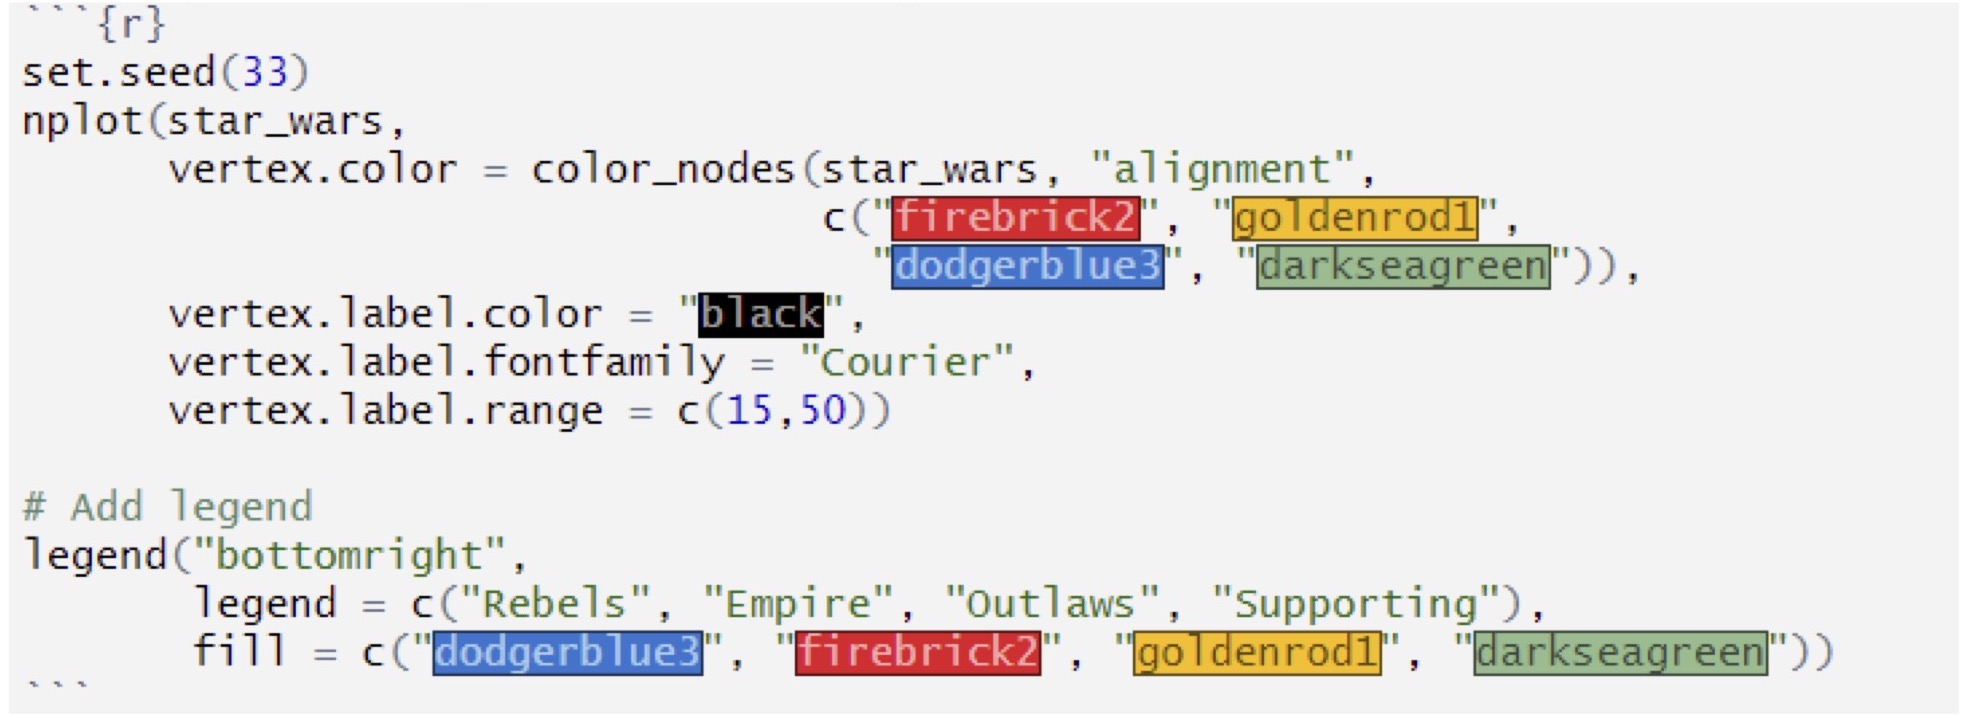
Figure 14
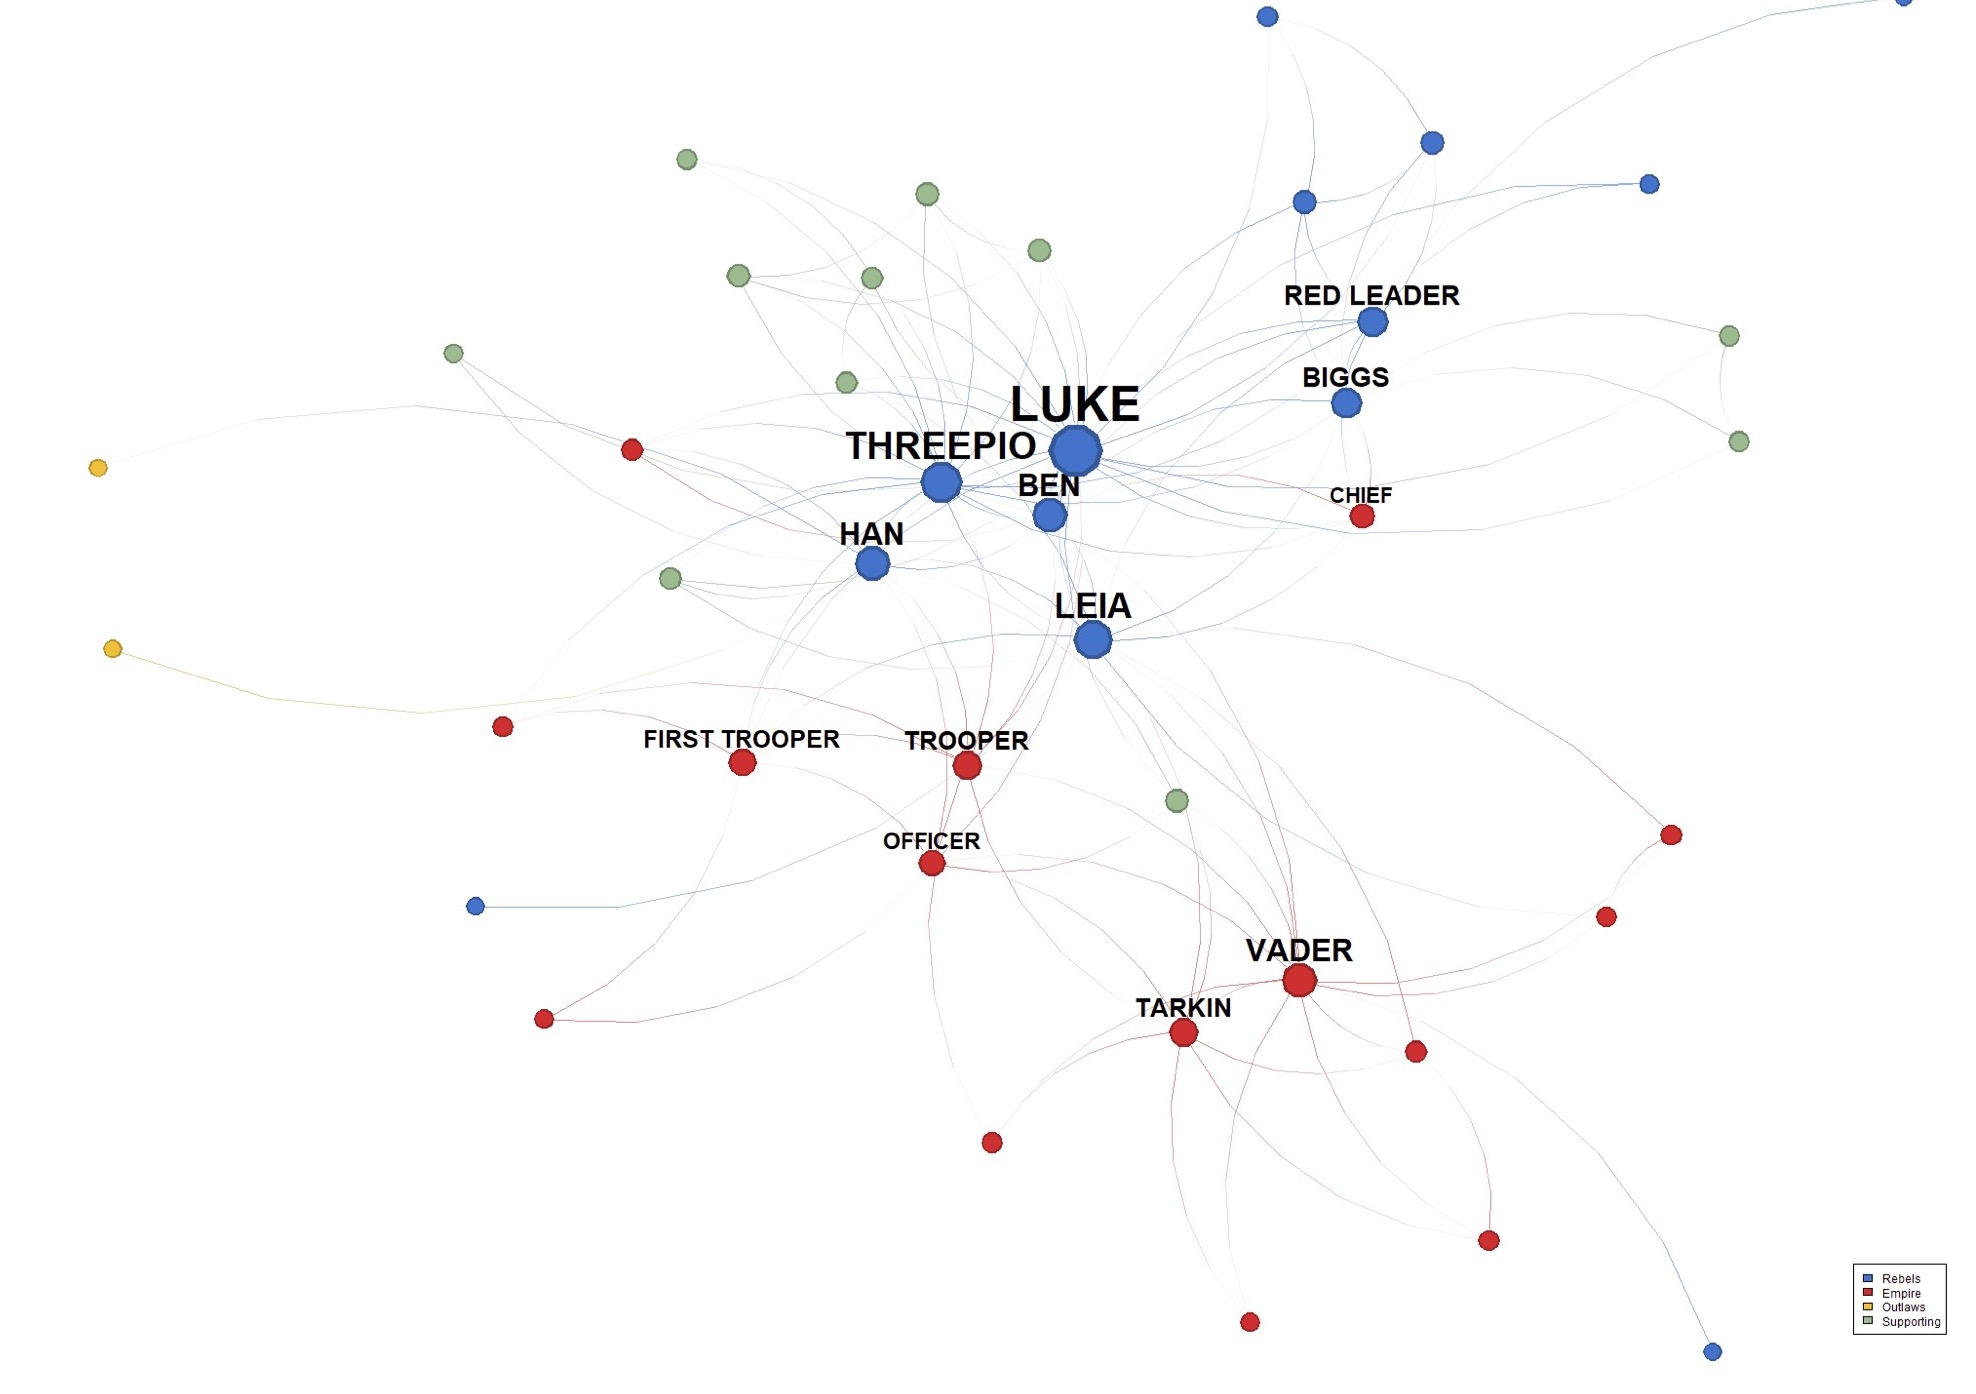
Figure 15
The vertices colored according to their alignment, the edges are on a gradient, and the most connected characters have a larger vertex and label.
Conclusion:
`netplot` is an innovative package that gives the user full customization over their network visualizations. It can be used on different types of network datasets, and this paper walks through how to use some of the customization aspects with examples from character interactions in movies.
Bibliography
Adai, A. T., Date, S. V., Wieland, S., & Marcotte, E. M. (2004). LGL: Creating a Map of Protein Function with an Algorithm for Visualizing Very Large Biological Networks. Journal of Molecular Biology, 340(1), 179–190. https://doi.org/10.1016/j.jmb.2004.04.047
Alm, E., & Arkin, A. P. (2003). Biological networks. Current Opinion in Structural Biology, 13(2), 193–202. https://doi.org/10.1016/S0959-440X(03)00031-9
Amaral, L. A. N., Scala, A., Barthélémy, M., & Stanley, H. E. (2000). Classes of small-world networks. Proceedings of the National Academy of Sciences, 97(21), 11149–11152. https://doi.org/10.1073/pnas.200327197
Banerjee, S., Jenamani, M., & Pratihar, D. K. (2017). Properties of a projected network of a bipartite network. 2017 International Conference on Communication and Signal Processing (ICCSP), 0143–0147. https://doi.org/10.1109/ICCSP.2017.8286734
Bassett, D. S., & Bullmore, E. (2006). Small-World Brain Networks. The Neuroscientist, 12(6), 512–523. https://doi.org/10.1177/1073858406293182
Blondel, V. D., Guillaume, J.-L., Lambiotte, R., & Lefebvre, E. (2008). Fast unfolding of communities in large networks. Journal of Statistical Mechanics: Theory and Experiment, 2008(10), P10008. https://doi.org/10.1088/1742- 5468/2008/10/P10008
Butts, C. T. (2023). sna: Tools for Social Network Analysis. https://CRAN.R-project.org/package=sna
Csardi, G., & Nepusz, T. (2005). The Igraph Software Package for Complex Network Research. InterJournal, Complex Systems, 1695.
Deri, C. (2005). Social networks and health service utilization. Journal of Health Economics, 24(6), 1076–1107. https://doi.org/10.1016/j.jhealeco.2005.03.008
Dumb and Dumber (1994)—IMDb. (n.d.). Retrieved August 4, 2023, from https://www.imdb.com/title/tt0109686/?ref_=fn_al_tt_1
Fruchterman, T. M. J., & Reingold, E. M. (1991). Graph drawing by force-directed placement. Software: Practice and Experience, 21(11), 1129–1164. https://doi.org/10.1002/spe.4380211102
Garton, L., Haythornthwaite, C., & Wellman, B. (1997). Studying Online Social Networks. Journal of Computer- Mediated Communication, 3(1), JCMC313. https://doi.org/10.1111/j.1083-6101.1997.tb00062.x
Grapov, D., & Newman, J. W. (2012). imDEV: A graphical user interface to R multivariate analysis tools in Microsoft Excel. Bioinformatics, 28(17), 2288–2290. https://doi.org/10.1093/bioinformatics/bts439
Indiana Jones and the Last Crusade (1989)—IMDb. (n.d.). Retrieved August 4, 2023, from https://www.imdb.com/title/tt0097576/?ref_=nv_sr_srsg_2_tt_5_nm_1_q_indiana%2520jones%2520and%2520the%2520last%2520
Jack, S. L. (2010). Approaches to studying networks: Implications and outcomes. Journal of Business Venturing, 25(1), 120–137. https://doi.org/10.1016/j.jbusvent.2008.10.010
Kamada, T., & Kawai, S. (1989). AN ALGORITHM FOR DRAWING GENERAL UNDIRECTED GRAPHS. INFORMATION PROCESSING LETTERS, 31(1).
Lin, L. (2018). Quantifying and presenting overall evidence in network meta-analysis. Statistics in Medicine, 37(28), 4114–4125. https://doi.org/10.1002/sim.7905
Marsden, P. V., & Hollstein, B. (2023). Advances and innovations in methods for collecting egocentric network data. Social Science Research, 109, 102816. https://doi.org/10.1016/j.ssresearch.2022.102816
Martin, S., Brown, W. M., & Wylie, B. N. (2007). Dr.L: Distributed Recursive (Graph) Layout (dRl). Sandia National Lab. (SNL-NM), Albuquerque, NM (United States). https://doi.org/10.11578/dc.20210416.20
Newman, M. E. J. (2001). Who is the best connected scientist? A study of scientific coauthorship networks. Physical Review E, 64(1), 016132. https://doi.org/10.1103/PhysRevE.64.016132
Ognyanova, K. (n.d.). Network visualization with R.
Palma, B. D. (Director). (1996, May 22). Mission: Impossible [Action, Adventure, Thriller]. Paramount Pictures, Cruise/Wagner Productions.
Pedersen, T. L. (2022). ggraph: An Implementation of Grammar of Graphics for Graphs and Networks. https://CRAN.R- project.org/package=ggraph
Schoch, D. (2021). networkdata: Repository of Network Datasets. https://github.com/schochastics/networkdata Sharma, S., & Chou, J. (2022). Accelerate Incremental TSP Algorithms on Time Evolving Graphs with Partitioning
Methods. Algorithms, 15(2), Article 2. https://doi.org/10.3390/a15020064
Six, J. M., & Tollis, I. G. (1999). A Framework for Circular Drawings of Networks. In J. Kratochvíyl (Ed.), Graph Drawing (pp. 107–116). Springer. https://doi.org/10.1007/3-540-46648-7_11
Star Wars: Episode IV – A New Hope (1977)—IMDb. (n.d.). Retrieved August 4, 2023, from https://www.imdb.com/title/tt0076759/?ref_=fn_al_tt_1
X-Men (2000)—IMDb. (n.d.). Retrieved August 4, 2023, from https://www.imdb.com/title/tt0120903/
Yon, G. V., & Bischoff, P. (2023). netplot: Beautiful Graph Drawing. https://github.com/USCCANA/netplot
Zien, J. Y., Schlag, M. D. F., & Chan, P. K. (1999). Multilevel spectral hypergraph partitioning with arbitrary vertex sizes. IEEE Transactions on Computer-Aided Design of Integrated Circuits and Systems, 18(9), 1389–1399. https://doi.org/10.1109/43.784130

