The Imaging Revolution
Jim Hutchins
Objective 5: Describe the imaging methods used to study the human brain.
History of Neuroscience Objective 5 Video Lecture
The invention of X-ray imaging by William Röntgen in 1895 didn’t have as much of an effect on our understanding of brain anatomy as it did on the anatomy of other parts of the body. X-rays were slowed or stopped by the skull, but the soft tissue of the brain did not interact with X-rays very much and so it was very difficult to image brain tissue with X-rays.
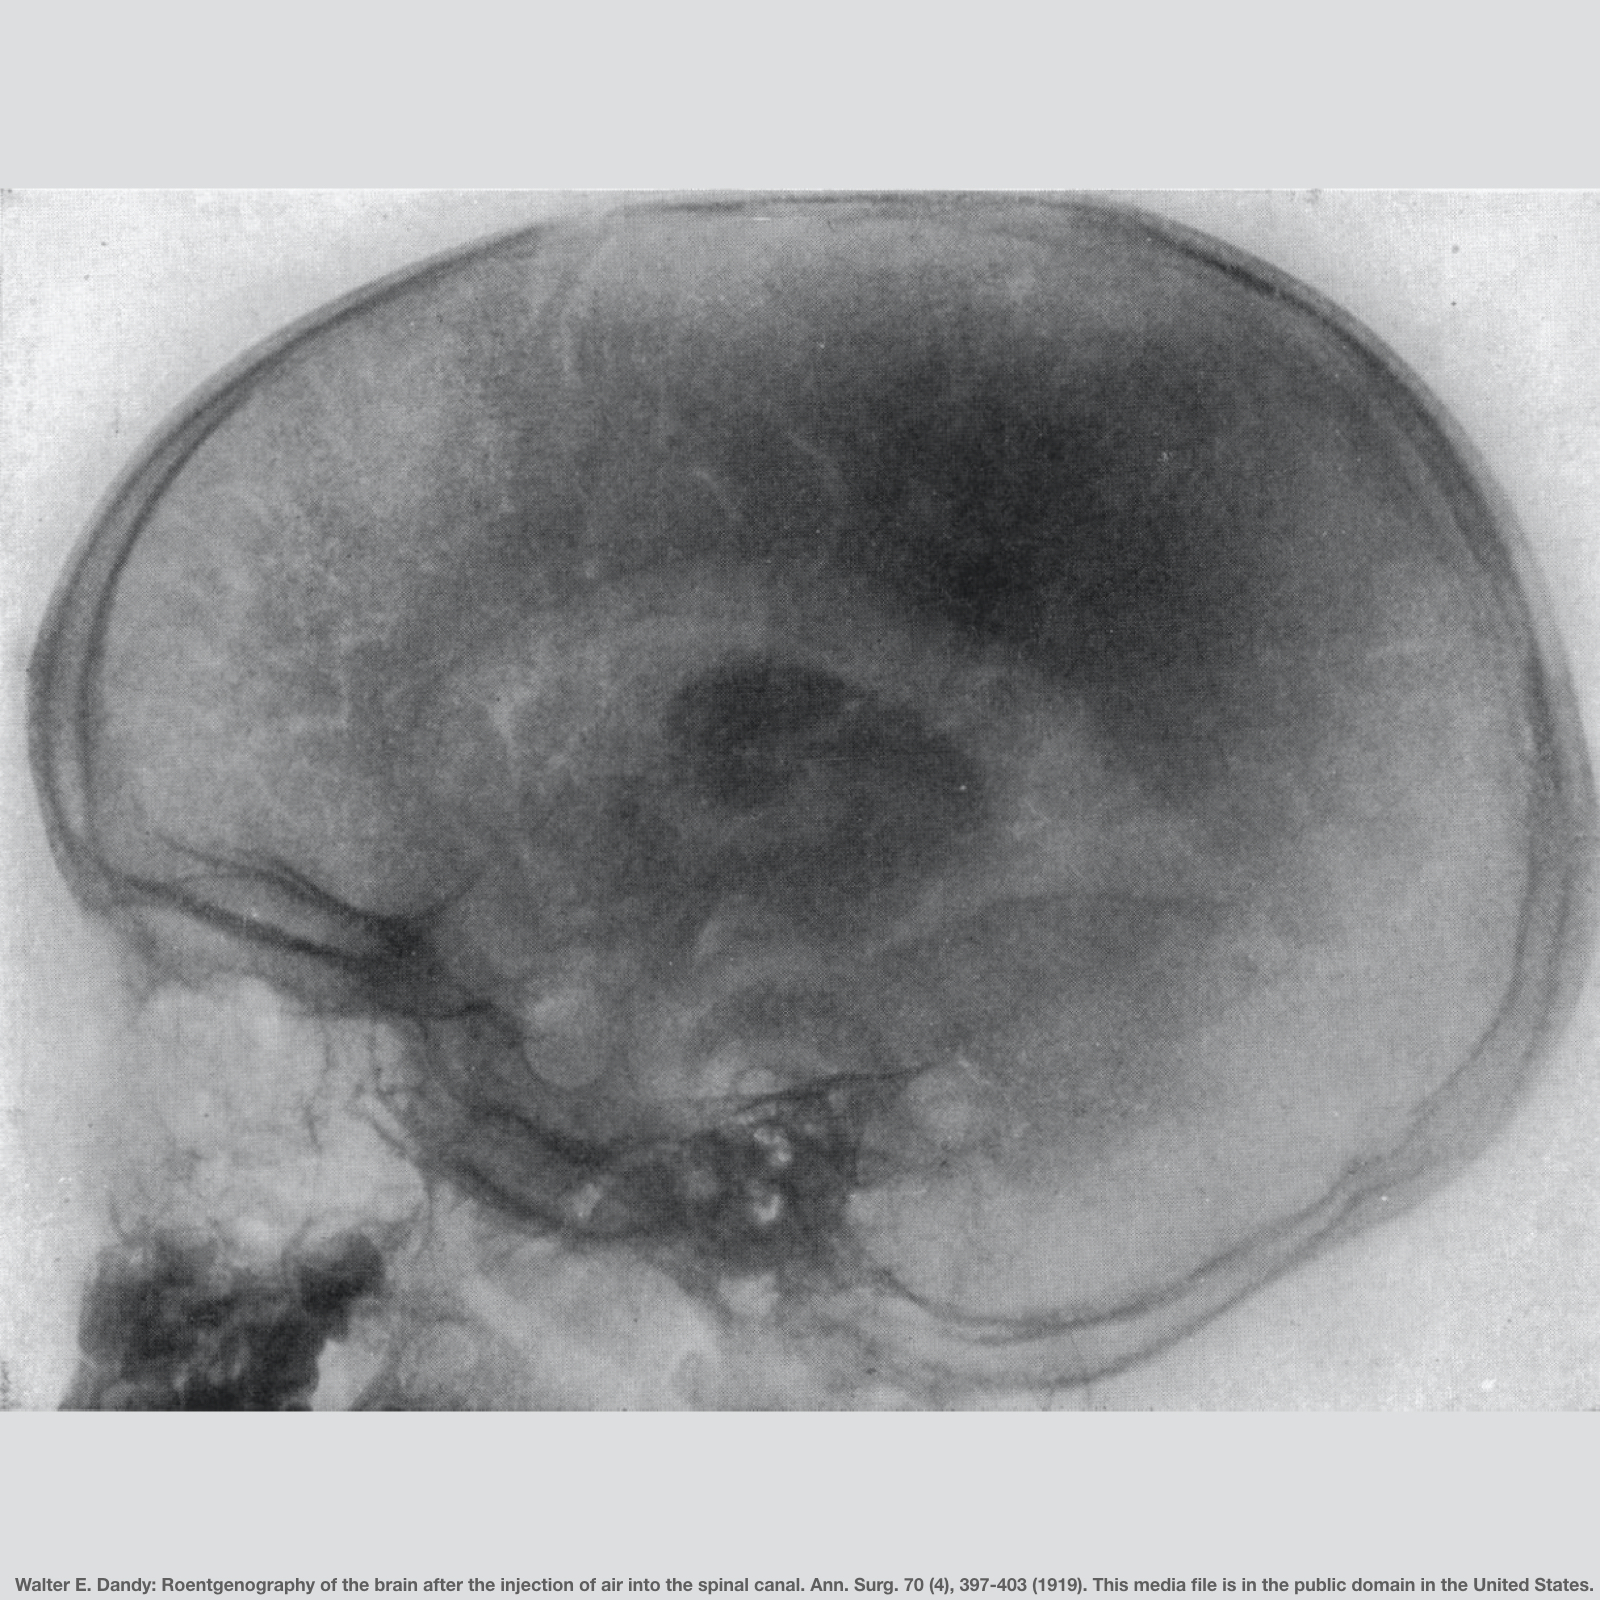 A few techniques, such as pneumoencephalography, were used to visualize the brain, but they were cumbersome, technically difficult, and exceedingly unpleasant for the patient. In pneumoencephalography, the cerebrospinal fluid was removed, air was introduced in its place, and the patient’s body position was manipulated to guide the resulting air bubble into the correct area(s). The mortality rate from pneumoencephalography was 1-3% which is unacceptably high for a technique meant to look inside the brain for diagnosis of illness.
By the 1950s and 1960s, X-ray opaque contrast dyes had replaced air as a contrast medium, but these agents did not result in much of an improvement in the quality of images, patient safety, or an understanding of neurological disease.
By the 1970s, the best neurologists had a keen understanding of localization of function and a battery of neurological tests to perform to back up that understanding.
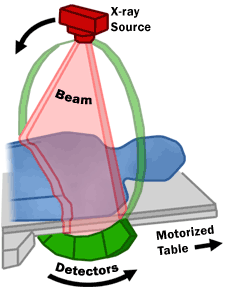 There were two major shifts in brain imaging technology that allowed neurologists and neuroradiologists to directly visualize brain tissue. The first was achieved through advances in the capability to store image data. Computerized axial tomography (CAT; later just called computed tomography, or CT) uses a series of low-dose X-rays which are passed through the head at a hundred or more different angles. A computer program then reconstructs a series of 2-dimensional images which represent the X-ray density of that plane of the brain.
About a decade later, a second revolution in imaging followed closely behind CT scanning. Called at first nuclear magnetic resonance (NMR) imaging, it was adapted from the NMR technology then in use in chemistry labs. Patients, however, balked at the word “nuclear” and so the name was changed to magnetic resonance imaging (MRI).

MRI offers a way of detecting the water content of tissue. The patient’s head is placed inside a doughnut-shaped, large, powerful magnet. A radio wave antenna is used to excite the nuclei of hydrogen atoms (i.e. a single proton) and then a radiofrequency receiver detects the signals which result from disruption in the proton’s spin states. Magnets used in an MRI detector can range up to 7 Tesla, or about 7000 times stronger than a refrigerator magnet at 0.001 Tesla. It takes about a half-hour to obtain these images, and most metallic objects cannot be used around this magnet. The reasons why are made clear in this impressive video demonstration.
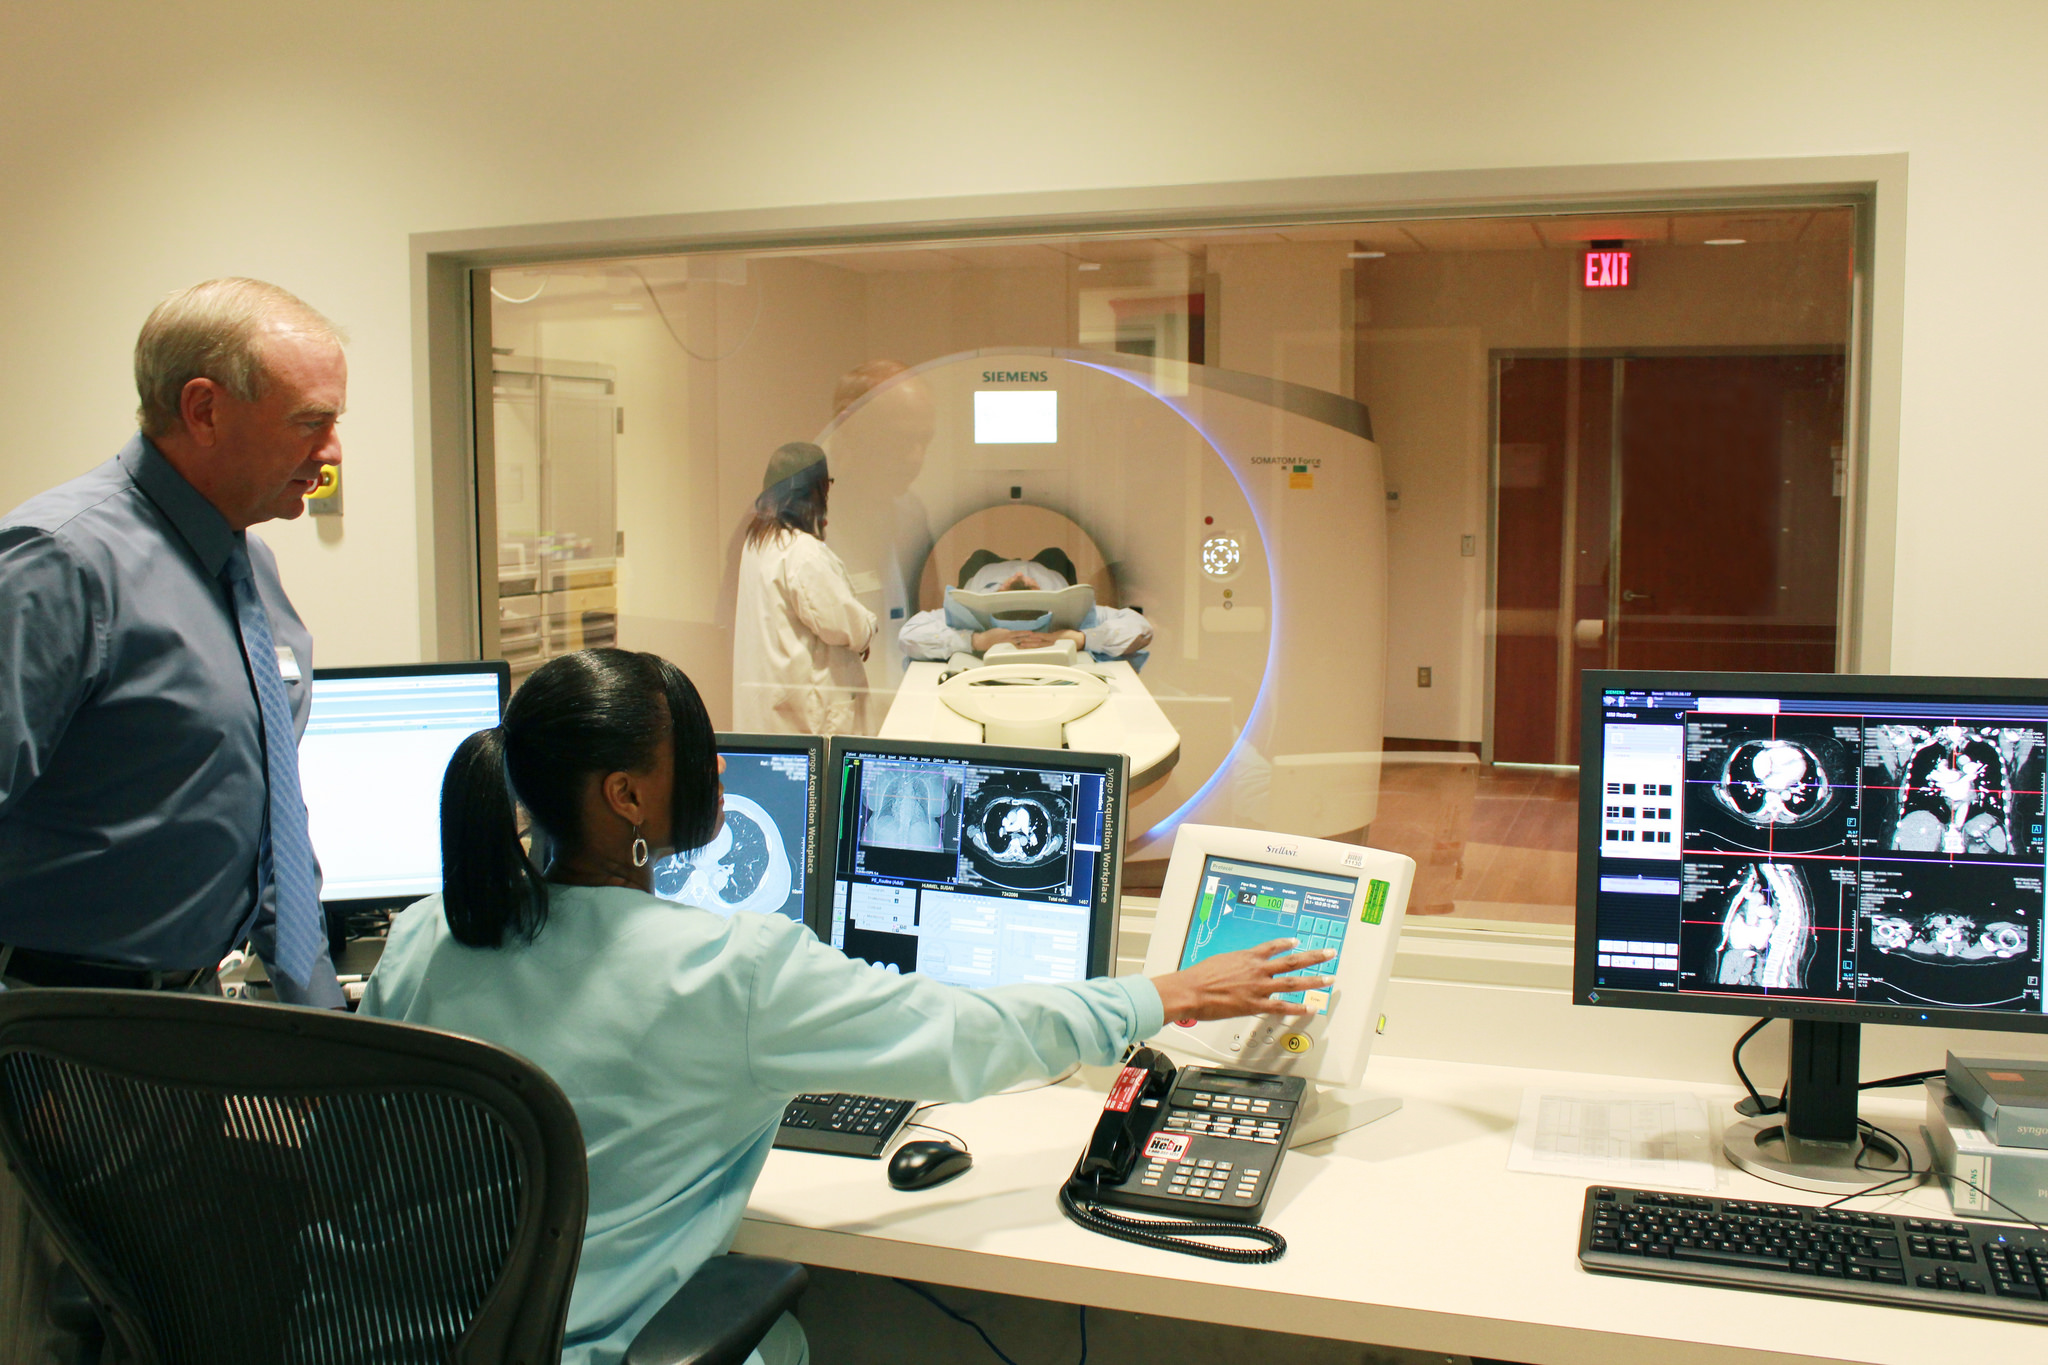 Of course, CT scans are still in use today and improvements in technology such as artificial intelligence have brought CT back to pre-eminence as an imaging technique. Data can be obtained from the patient’s body much faster in a CT scanner, and situations where “time is brain” (as in treatment of a blood clot in the brain, an embolic stroke), a half-hour vs a few minutes makes a huge difference. The cost of maintaining MRI instruments (for example, the magnet must be cooled by liquid helium) is also prohibitive for many applications.
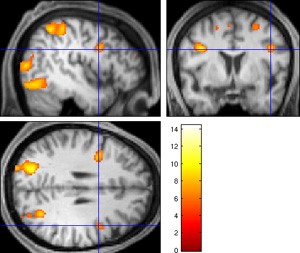 For neuroscience research, the MRI still has advantages that CT cannot match. In particular, a technique called functional MRI (fMRI) can be used to detect the changes in blood supply in the brain. In this experiment, the test subject is performing mathematical calculations while in the MRI tube. The areas of the brain with increased activity (and therefore increased blood flow) are shown in brighter colors.
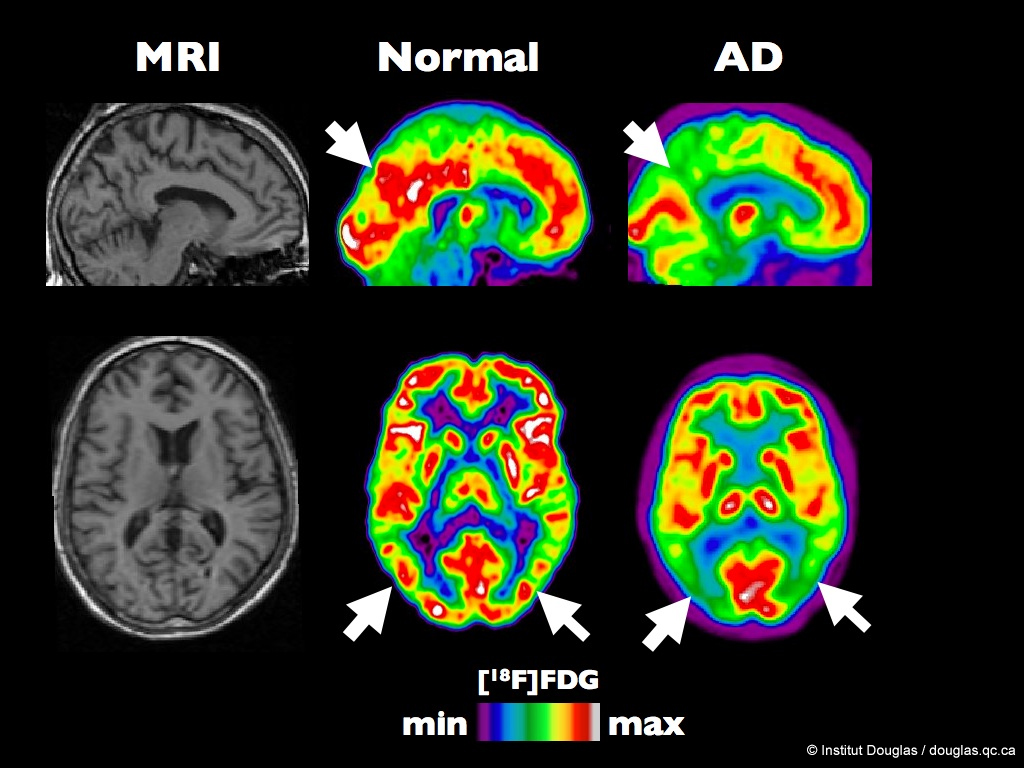
PET scan of an healthy brain compared to a brain at an early stage of Alzheimer’s disease. The figure shows MRI, and typical [18F]FDG images from a healthy volunteer and a Alzheimer Disease (AD) patient. The color scale express the rate of glucose utilization (from minimum to maximum). In these PET (Positron Emission Tomography) images (column 2 and 3), the white and red colors represent the regions of the brain with the highest glucose utilization rates while the green and blue represent the hypometabolic brain areas. The arrows show the posterior temporo-parietal junction (lower row) and the posterior cingulate gyrus (top row).One method for imaging the biochemical activity of the brain is the positron emission tomography (PET) scan. A radiopharmaceutical, 18F-fluorodeoxyglucose, which resembles glucose but emits an antimatter electron (a positron) is injected into a patient and the areas of the brain which take up the label can be visualized on a heat map. The same technology may be used to localize receptors that bind drugs for investigative or diagnostic purposes.
Media Attributions
- Pneumoencephalography © Walter E Dandy is licensed under a Public Domain license
- CT fan beam © US Food and Drug Administration is licensed under a Public Domain license
- MRI scanner © United States Navy is licensed under a Public Domain license
- CT scanner © National Institutes of Health is licensed under a CC BY-NC (Attribution NonCommercial) license
- Brain on math © Jim Hutchins and Jim Lee is licensed under a CC0 (Creative Commons Zero) license
- PET scan normal Alzheimer brain © Institut Douglas is licensed under a CC BY-NC-ND (Attribution NonCommercial NoDerivatives) license

