The Action Potential in Unmyelinated Axons
Caleb Bevan
Objective 8: Construct a model of the action potential in unmyelinated axons.
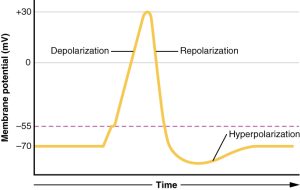
This trace shows the characteristic shape of the action potential.
Time is shown on the X-axis (abscissa, horizontal axis). Because the potential changes dynamically over time, taking up exactly the same time, we call it an action potential to distinguish it from graded potentials that have neither a characteristic shape nor time period.
Remember that the word “potential” means the same thing as “voltage”. Voltage in millivolts (mV) is shown on the Y-axis (ordinate, vertical axis).
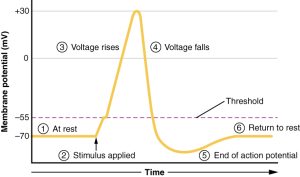
Here is the same voltage trace, but labeled so we can examine each part of the complicated waveform separately. In order:
- The neuron holds a resting potential. In this example, the resting potential is –70 mV.
- A stimulus is applied. This can be input from another neuron, from the environment, or from a scientist studying the action potential. The stimulus is small, upward (more positive) deflection in voltage.
- If the stimulus reaches threshold, there is a rapid upward (positive) deflection in membrane voltage. In this example, threshold is –55 mV.
- After a peak at about a half a millisecond, the voltage starts to drop (become more negative) as rapidly as it rose.
- At the end of the action potential, the neuron’s membrane potential goes past the resting potential. This phase is called the afterhyperpolarization or more simply, the overshoot.
- The neuron returns to resting potential.
Step 1: The Resting Potential
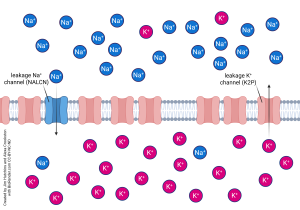
We’ve already seen, in Objective 3, how the resting potential is established. Recall that the resting potential (negative voltage, about –60 to –80 mV) depends mostly on the leakage potassium and leakage sodium channels, with a smaller contribution from transporter and pump systems.
Step 2: Threshold
We will see, in Objectives 8-12, how neurons are activated. If the activation reaches a magical value called threshold, the process becomes uncontrollable and irreversible, and an action potential results. Like everything else, the exact value of threshold varies but it’s typically about 10 or 20 mV above resting potential. It’s the value at which enough voltage-gated sodium channels are in an activated state that the membrane voltage rapidly rises (depolarizes) toward the sodium equilibrium potential.
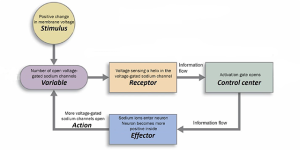
You will recognize this from Unit 1 as a positive feedback loop: once a sufficient number of voltage-gated sodium channels are opened, sodium rushes into the neuron and makes it more positive inside, which opens more voltage-gated sodium channels, which allows more sodium to rush into the neuron, making it more positive. This is only stopped by either inactivation or by reaching the equilibrium potential for sodium.
Step 3: The Rising Phase
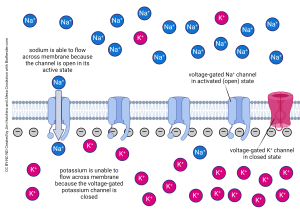
In the rising phase, a significant number of voltage-gated sodium channels are in the activated (open) state. Now sodium rushes in, and the membrane potential rises rapidly, reaching a value that is positive inside, sometimes even touching ENa at +60 mV.
Step 4: The Falling Phase
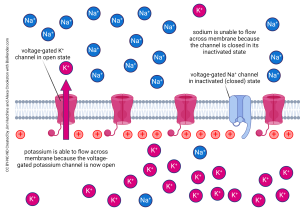
In the falling phase, there is a shift: voltage-gated sodium channels enter their third state, inactivation. At the same time, the voltage-gated potassium channels begin to open.
Now the inside of the cell is positively-charged. Remember from the discussion of Objective 3 that when the neuron is positively charged and we allow potassium to flow, potassium “wants” to leave the neuron and is pushed by both the diffusional and electrical forces.
Step 5: The Afterhyperpolarization (Overshoot)
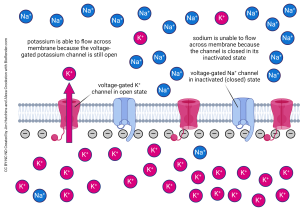
Now almost all the voltage-gated sodium channels are in their inactivated (refractory) state. A majority of the voltage-gated potassium channels are in their open state. These two factors, combined, drive the membrane voltage toward EK, somewhere near –80 mV, about 10 mV below rest. (When K+ is the only ion that can move, potassium can reach equilibrium without any opposition from sodium, and the membrane potential approaches EK.) This dip in the voltage trace is called the overshoot or afterhyperpolarization.
Step 6: Return to rest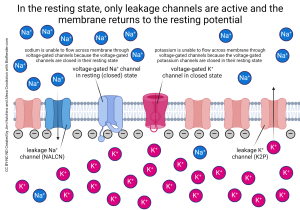
See how the voltage-gated channels are closed in this diagram? (We show two of them; any patch of neuronal membrane has hundreds or thousands.) That means the membrane can return to rest, as we saw before, with only leakage channels controlling the membrane potential:
Change in Na+ and K+ Permeability During the Action Potential
This complex shift between high Na+ permeability and high K+ permeability followed by a return to baseline is shown in this diagram.
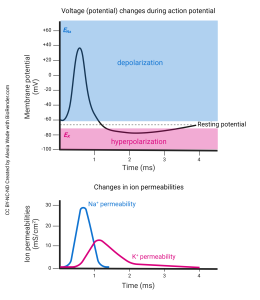 The top trace is our now-familiar view of the action potential, and the bottom trace is something new: now the Y-axis is plotting ion permeability (don’t worry about the units, they’re not important to us).
The blue curve shows the transient spike in Na+ permeability. It rises quickly, maxing out at about 0.7 msec, and then falls just as rapidly as it rose. By 1.5 msec, the neuron membrane is essentially impermeable to Na+.
The pink curve shows the transient rise in K+ permeability. It rises much more slowly, and is slower to reach its peak (at about 1.2 msec). Then it starts to fall slowly as voltage-gated K+ channels begin to close. Note that between about 1.5 and 2.5 msec, the only ion that can move across the neuronal membrane is K+; this is where the overshoot occurs and we approach EK.
Media Attributions
- Action potential © Betts, J. Gordon; Young, Kelly A.; Wise, James A.; Johnson, Eddie; Poe, Brandon; Kruse, Dean H. Korol, Oksana; Johnson, Jody E.; Womble, Mark & DeSaix, Peter is licensed under a CC BY (Attribution) license
- Action potential steps © J. Gordon Betts, Kelly A. Young, James A. Wise, Eddie Johnson, Brandon Poe, Dean H. Kruse, Oksana Korol, Jody E. Johnson, Mark Womble, & Peter DeSaix is licensed under a CC BY (Attribution) license
- Resting Neuronal Membrane Ion Distribution and Leakage Channels © Jim Hutchins and Alexa Crookston is licensed under a CC BY-NC-ND (Attribution NonCommercial NoDerivatives) license
- Threshold positive feedback loop © CCCOnline adapted by Jim Hutchins is licensed under a CC BY-NC-SA (Attribution NonCommercial ShareAlike) license
- Rising phase of action potential © Jim Hutchins and Alexa Crookston is licensed under a CC BY-NC-ND (Attribution NonCommercial NoDerivatives) license
- Falling phase of action potential © Jim Hutchins and Alexa Crookston is licensed under a CC BY-NC-ND (Attribution NonCommercial NoDerivatives) license
- Overshoot phase of action potential © Jim Hutchins and Alexa Crookston is licensed under a CC BY-NC-ND (Attribution NonCommercial NoDerivatives) license
- Resting phase of action potential © Jim Hutchins and Alexa Crookstron is licensed under a CC BY-NC-ND (Attribution NonCommercial NoDerivatives) license
- Action Potential and Ion Permeability © Alexia Wade is licensed under a CC BY-NC-ND (Attribution NonCommercial NoDerivatives) license
