Primary Visual Cortex
Jim Hutchins
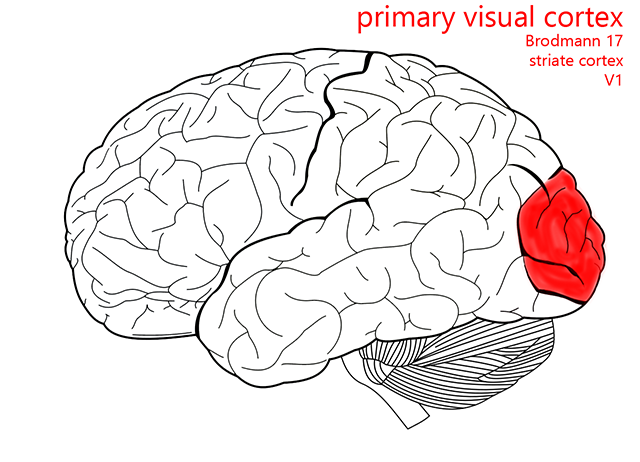
Objective 12: Recognize the location and basic cytoarchitectonic organization of visual cortex.
The cytoarchitecture of sensory and motor cortex is columnar. That is, although there are at least six layers of cortex, the cells in these layers which carry out similar functions or which represent similar areas of the visual field are stacked, just as they were in the LGN.
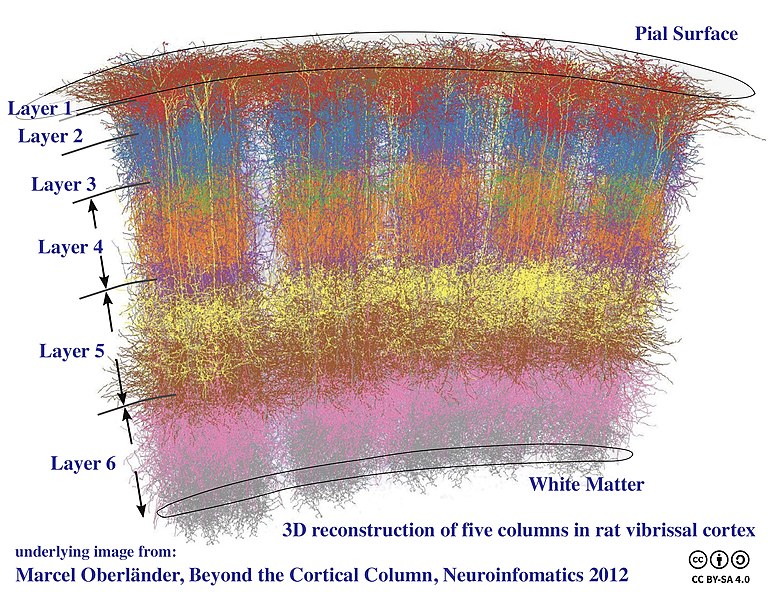
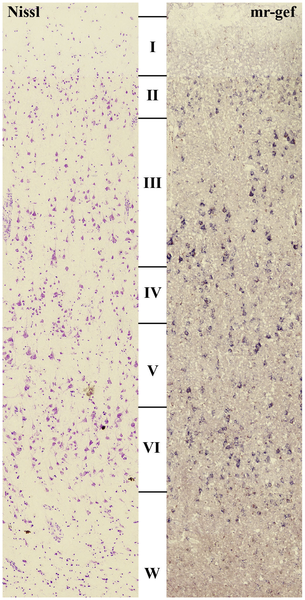 Almost all the cortex in the human brain is neocortex (“new cortex”) with six layers. The most superficial, nearest the pial surface on the outside, is called layer 1, also styled “layer I” in Roman numerals. The deepest layer, near the white matter on the inside, is called layer 6 or VI. In general, inputs to cortex arrive at layer 4 or IV. The visual cortex is so complex that this layer is subdivided. We have already seen that so many axons come into this layer that it has a visible white stripe, the stria Gennari that gives striate cortex its name.
The axons of LGN relay cells arrive in a subdivision of layer 4 called layer 4C. Magnocellular axons arrive in layer 4Cα while LGN parvocellular axons arrive in the slightly deeper layer 4cβ.
Koniocellular axons carry color information which ultimately came from retinal cones and cone bipolar cells, and passed via color-opponent ganglion cells. These koniocellular axons are extremely metabolically active and their postsynaptic target cells stain avidly for a mitochondrial enzyme called cytochrome oxidase. Because these dark-staining, metabolically-active regions looked like blobs, they are called blobs. Between the blobs are the cells that receive information from M and P pathways; these are called interblobs. Blobs are present in all cortical layers except 4.
Cells found in layer 6 send feedback to the lateral geniculate nucleus.
Media Attributions
- Primary visual cortex © Carter, Henry Vandyke adapted by Jim Hutchins and Avalon Marker is licensed under a CC BY-SA (Attribution ShareAlike) license
- Cortical Columns © Bodysurfinyon is licensed under a CC BY-SA (Attribution ShareAlike) license
- Neocórtex visual capas © Bithell A, Hsu T, Kandanearatchi A, Landau S, Everall IP, Tsuang MT, et al. is licensed under a CC BY-SA (Attribution ShareAlike) license
