Teaching Reproducibility to First Year College Students:
Reflections From an Introductory Data Science Course
Brennan Bean, Ph.D.
Abstract
Modern technology threatens traditional modes of classroom assessment by providing students with automated ways to write essays and take exams. At the same time, modern technology continues to expand the accessibility of computational tools that promise to increase the potential scope and quality of class projects. This paper presents a case study where students are asked to complete a “reproducible” final project in an introductory data science course using the R programming language. A reproducible project is one where an instructor can easily regenerate the results and conclusions from the submitted materials. Experiences in two small sections of this introductory class suggest that reproducible projects are feasible to implement with only a little increase in assessment difficulty. The sample assignment presented in this paper, along with some proposed adaptations for non-data science classes, provide a pattern for directly assessing a student’s analysis, rather than just the final results.
Keywords: data science, reproducibility, programming, assessment
1 Introduction
Academic progress relies on the ability to build upon existing knowledge. This concept is reinforced in classrooms where instructors challenge their students to demonstrate their understanding of course information in a final report, experiment, or presentation. However, effectiveness of classroom assessments is reduced when students are unable to replicate or reproduce their submitted results. Unfortunately, issues with reproducibility are common. For example, Baker (2016) reported from a survey of 1,576 scientific researchers that:
- 90% felt that there was a slight to significant “reproducibility crises” in the sciences,
- 70% have tried, and failed, to reproduce (i.e. replicate) another scientist’s experiments,
- more than 50% have failed to reproduce their own experiments.
The widespread difficulty with scientific reproducibility has resulted in multiple instances of high profile researchers building careers on falsified/altered data (Dahlberg, 2018; Kim, 2023). While Fanelli (2018) argues these reported difficulties in reproducibility fall short of a crises, these statistics and stories highlight the importance of teaching our students how to conduct analyses that can be reproduced and/or replicated by others.
The notion of reproducibility is sometimes conflated with the terms repeatability and/or replicability. The National Academies of Sciences Engineering and Medicine (NASEM, 2019) distinguish these terms as:
- Reproducibility: obtaining consistent results using the same input data; computational steps, methods and code; and conditions of analysis.
- Replicability: obtaining consistent results across studies aimed at answering the same scientific questions, each of which has obtained its own data.
The NASEM definition of reproducibility motivates a classroom-centric definition of reproducibility:
- Classroom Reproducibility: the ability of an instructor to easily regenerate the results and conclusions of a student report from the submitted materials.
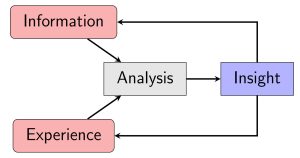
Use of the term “easily” in this definition suggests that the student has appropriately organized the submitted materials so that little manual or computational effort is required on the part of the instructor to regenerate the results. The definition implies that the instructor is able to evaluate both the final report, as well as the analysis that preceded it. The need for reproducibility in classroom assignments stems from recent technological advances that threaten traditional norms of assessment. To illustrate this, Figure 1 proposes a model of classroom assessment that is adapted from many of analysis workflows that exist in data science (Stodden, 2020; Wing, 2019; Keller et al., 2020; Boenig-Liptsin et al., 2022) and mathematical modeling literature (Doerr et al., 2017; Anhalt et al., 2018). This includes a mathematical modeling workflow in the Common Core State Standards for Mathematics (CCSSM, 2010).
Figure 1 is a workflow designed to apply across disciplines and assessment types. For example, many students use course materials (information) and feedback on previous assignments (experience) to evaluate exam question prompts (analysis) and provide final answers (insight). On term projects, students couple course materials (information) with their personal interests (experience) to propose and answer a research question (analysis) as documented in a final report (insight). Two key components of the workflow are that (1) analysis (i.e., learning) is more than a simple regurgitation of information and (2) analysis and insight are related, yet separate and distinct, steps in the workflow. Ideally, the communicated insight from the project will provide the student and others with new information and experiences that will benefit future analyses.
Most classroom assessments focus on evaluating student insight. Such assessments implicitly assume that the communicated insight is directly reflective of the analysis that preceded it. However, online resources and modern technology obscure the relationship between analysis and insight. For example, ChatGPT (openAI, 2023) has already proven to perform better than average on tests across many disciplines (Lo, 2023) and has been used to write student essays (Stokel-Walker, 2022) and scientific research papers (Stokel-Walker, 2023). While modern artificial intelligence (AI) systems may provide correct answers to assessments, those answers do not imply an understanding of the material being assessed. This fact is admitted by ChatGPT itself in a reply to the query “Do you understand the meaning of the things that you tell me?”:
When the connection between analysis and insight is lost, so is the efficacy of traditional classroom assessment. That in mind, there is evidence to suggest that AI has potential to improve learning and educational outcomes (Chen, Jensen, Albert, Gupta, & Lee, 2023). This includes the use of AI systems to teach computer programming syntax (Perkel, 2023). Rather than ban AI use in the classroom, this paper proposes modes of assessment that more directly assess a student’s analysis, rather than just the communicated insight. This paper illustrates the feasibility of this approach in an introductory data science course, where students are able to create a reproducible final project in the R programming language.
This paper proceeds with a brief history on the notion of reproducible reports along with a summary of existing software tools that facilitate the creation of such reports. This is followed by a description of a reproducible final project as administered in an introductory data science course at Utah State University (USU). This paper concludes with a reflection on the potential opportunities, adaptations, and limitations of expanding and generalizing reproducible assignments to other courses. The article demonstrates the feasibility of incorporating reproducibility into assignments with only small adjustments to traditional assessment approaches.
2 Literature
Discussions regarding computational reproducibility have been ongoing since at least the mid-1990s, when Knuth (1992) used the term literate programming to describe a combination of computer code and text as a way of making a computational analysis easier for humans to read and understand. This was followed by Buckheit and Donoho (1995), who described really reproducible research as one in which the software environment and code would be made widely available for others to inspect, modify, and apply. Gentleman and Lang (2007) built upon these ideas when they proposed the idea of a research compendium, which is a combination of data, software and dynamic documents that allow others to reproduce all research results. It is the idea of the research compendium that motivates the final project described later in this paper.
Dynamic documents contain text, code, and data that can be quickly recalculated each time the document is generated. Perhaps the most popular example of software for creating dynamic documents is Jupyter Notebooks (Jupyter, 2023). These notebooks allow users to integrate text with code from over 40 different programming languages that can be run interactively. Another popular dynamic document software is Rmarkdown (Allaire et al., 2023), which is designed to work with the Rstudio Integrated Development Environment (IDE) (Posit, 2023b) for the R programming language (R Core Team, 2023). (Please see Chapter 40 of (Irizarry, 2022) for additional details about using Rmarkdown in reproducible data analysis projects.) There are also several extensions/companions of Rmarkdown designed for creating dynamically generated slides and lecture notes for teaching (Dogucu & Çetinkaya Rundel, 2022). Continual improvements to these and other software implementations make these dynamic document generating tools increasingly accessible to larger and larger audiences. For example, Bryant et al. (2019) demonstrated the successful use of Jupyter Notebooks to teach programming to middle school students with little prior programming experience.
Modern technological advances continue to increase the accessibility of dynamic document software while simultaneously reducing the computation time necessary to render them. This increased accessibility prompted Somers (2018) to call the scientific paper “obsolete” in favor of a future world filled with dynamic documents that communicate research results interactively. Some academic journals have partially caught hold of this idea by now insisting that the results of submitted papers be reproducible (Nature, 2018; JASA, 2022; R Journal, 2023). However, a review of the literature suggests that the push for reproducibility in both research and teaching has been concentrated in statistics, data science, and computer science. This may be due to the perceived difficulty of incorporating computer programming into non-computer programming courses. Section 3 of this paper aims to illustrate that the implementation of reproducible reports in an introductory course may be more accessible to both students and instructors than might be initially perceived.
3 Case Study: Stat 1080 Final Projects
STAT 1080: Foundations of Data Science is a course that satisfies USU’s quantitative literacy (QL) general education requirement. The course is designed to be accessible to students of all majors with minimal prerequisites beyond remedial mathematics. The course uses R programming to teach key concepts of statistics and data science. The final project described in this paper has been administered to two small sections of this course—one taught in the Fall 2022 semester (eight students) and another in the Spring 2023 semester (five students). Student backgrounds have varied significantly—from first semester freshman and/or students with little programming or statistics experience, to last semester seniors with extensive statistics and/or programming experience.
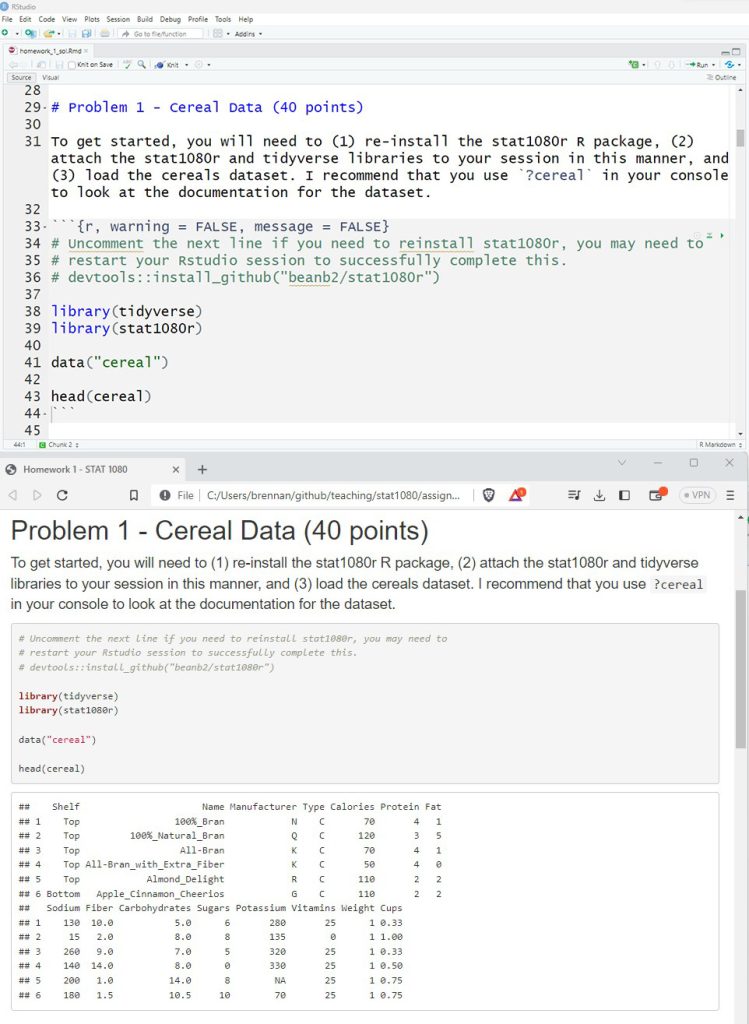
Throughout the semester, students complete four homework assignments where they demonstrate the ability to clean, shape, visualize, and analyze data. All data that are necessary to complete homework assignments are made available either in the dslabs (Irizarry & Gill, 2021) R package, available on the Comprehensive R Archive Network (CRAN, 2023), or the stat1080r package (Bean, 2022), which is a software package available at https://github.com/beanb2/stat1080r. Students install this software on their machine and answer prompts in an Rmarkdown (.Rmd) file, which renders an .html report. Figure 2 (top) shows a snippet of a .Rmd file as opened in the Rstudio IDE, while Figure 2 (bottom) shows the corresponding .html output. Notice that the computer code in Figure 2 includes comments that are preceded by a #. Code comments provide students with an opportunity to provide verbal explanations of their code or links to references where they obtained sample code. The key feature of the .Rmd file is the ability of the student to provide the code used for analysis alongside their written insight in a single document.
Students are required to submit the completed .Rmd file on Canvas, which is USU’s current Learning Management System (LMS). The instructor then downloads the .Rmd files and renders each file to its corresponding .html output prior to assessment. The rendering from .Rmd to .html by the instructor ensures that all the code submitted by each student is fully executable. Students are assessed on both the correctness of their text responses along with the validity of the executed code. For homework assignments, 10% of the assignment points are awarded based on the proper formatting and successful execution of the .Rmd document.
The biggest difference between a .Rmd submission and a more traditional Canvas submission is the need for the instructor to download and regenerate the .html report on their own computer. This prevents the instructor from using the convenient document preview features that are common in many LMSs, which may increase grading time. This potential increase in grading time is offset by the natural way that the .Rmd file gives the instructor to evaluate the work of the student, which is especially useful for partial credit assessments.
3.1 Final Project Description
The homework assignments are designed to prepare students for the reproducible final projects, which are completed in groups of 3–4 students. Students are asked to analyze an external dataset of their choosing, often found on websites such as Kaggle (https://www.kaggle.com/). Students first submit a project proposal that briefly describes their dataset along with the questions they intend to explore. The proposal ensures that students select data sources already organized in tables, with rows representing observations and columns representing variables. This avoids handling more complicated data forms, (e.g. images and sound) that tend to have much larger file sizes and require analysis techniques that fall beyond the scope of an introductory course. Students are also encouraged to analyze datasets with 10,000 observations or less in order to reduce the logistical difficulties of uploading and downloading large file sizes on the LMS. These recommendations could be relaxed in smaller, more advanced, courses with students who have prior experience with database management.
Students are encouraged to follow the general principles of a research compendium (Gentleman & Lang, 2007) using the ever-improving software tools available in R (Marwick, Boettiger, & Mullen, 2018). Students are expected to pattern their submissions after the example available at the following link:
https://github.com/beanb2/stat1080 final project example
For convenience, Figure 3 provides a screenshot of this repository. Students are encouraged, though not required, to adopt identical folder names for their projects. A brief summary of each file/folder is provided below. Note that this proposed file organization is simpler than other file organization structures proposed for use in course/workshop projects using R (Mehta & Moore, 2022; Ball et al., 2022).
- data-raw/ This folder contains all original data files relevant to the final project report. Students are discouraged from making any alterations to the original data files besides those that are scripted in the .Rmd code. For data that requires significant cleaning prior to use, students may elect to write a separate .R script that creates a clean version of the data for use in their markdown file.
- scripts/ As previously mentioned, large datasets and complicated analyses are discouraged for use in STAT 1080 projects. That in mind, there is still the possibility that students need to perform computations that take a long time to run. In more advanced courses, students may also need to write custom programming functions to accomplish tasks. The scripts folder provides a space for students to include code that is too computationally intensive to include in the .Rmd report. Any interim datasets that are created by .R files in this folder should be saved in the data-raw folder.
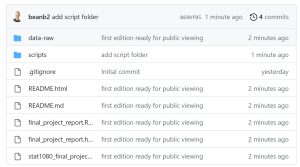
- final_project_report.Rmd/html These files constitute the final report that will be regenerated by the instructor at the time of grading. As illustrated in Figure 2, the .Rmd file contains the text and code while the .html file contains the output of the executed .Rmd file. In order for the analysis to be reproducible, the instructor should be able to run the .Rmd file and regenerate the .html without having to alter any of the files.
- stat1080 final project example.Rproj This file is for convenience in working with projects involving R code. Opening a .Rproj file creates a new R Studio IDE session with the working directory set to the location of the .Rproj file. This file is not necessary, however, as Rstudio always uses the location of the .Rmd file as the working directory when rendering the .html file.
The specification of a working directory via the .Rproj file allows for the use of relative file paths when reading and writing other files within the project. Unlike full file paths, which are unique for every computer and user, relative file paths do not need to be altered when the project is moved to another computer. For example, the R code for reading in a data file from the example project on any computer using relative file paths would simply be
read.csv("data-raw/kc_house_data.csv").
Additional details on file paths can be found in Chapter 5 of Irizarry (2022).
3.2 Final Project Assessment
Students are required to submit a compressed folder (.zip) of their final project on the LMS. The LMS restricts the file upload type to ensure that students do not only submit a single file. The instructor then completes the following steps:
- Download and decompress the submitted zip folder.
- Open the .Rproj file.
- Open the .Rmd file within the R project.
- Run an automatic check for proper code formatting using the lintr package (Hester et al., 2022).
- Render the .html file from the .Rmd file.
- Assess the .html file like any other final report.
Steps 1–5 take less than one minute to complete, making the increased grading time minimal compared to a more traditional assessment workflow that starts at Step 6. This process could be easily adapted to other dynamic document types, such as Jupyter notebooks. Proper formatting of the project and successful rendering of the code constitutes 10% of the final project grade. The submitted code, along with any errors generated when the instructor attempts to run the code, provide a record of student effort that aids the instructor when assessing the appropriateness of the analysis and drafting a detailed instructor review.
The instructor review follows the pattern used for peer-reviewed journals, where students are required to articulate what changes they made to each instructor comment using a different colored font. Students are provided with a template review response document that includes the following instructions and example:
You will be given the opportunity to resubmit your assignment for full points if you address my comments. Please include this response to review document inside of your R project when you resubmit. You should provide a response, colored in red, outlining how you addressed each comment. Here is a generic example of how this might look (this comment is not specific to any submission):
The interpretation of your p-value in your “Methods” section is not fully correct. The p-value is NOT the probability that the null hypothesis is true. Please revise.
The p-value interpretation has been revised to indicate that it represents the probability of observing something as far (or farther) away from the assumed average.
Students who sufficiently improve their project submissions based on instructor feedback and appropriately respond to review receive full points on the final project. The approach of assigning full points after a successful response to review is inspired by the “ungrading” ideas outlined in (Blum, 2020), though a full discussion of this approach to assessment falls outside the scope of this paper.
4 Reflections, Limitations, and Adaptions
So far in STAT 1080, the management and assessment of the reproducible final projects has proceeded with almost no difficulty beyond what would be typical for a regular final project report. All students have been able to successfully create reproducible final projects with little intervention on the part of the instructor. This success highlights the ability of students to effectively learn how to organize and execute a reproducible analysis. Further, the submission format for both final project and homework assignments has proven beneficial for assigning partial credit to student responses. This is because the work (i.e. computer program) underlying each answer must be provided by the student. This allows the instructor to quickly pinpoint an error in student work by interactively running portions of the submitted code. This type of interactive error checking is something that would not be possible if students only reported on the final output. However, assessment can be difficult in instances where the student’s .Rmd files fail to properly render to an .html file, as this requires the instructor to identify and remove the error-prone code before evaluating the remainder of the document.
One limitation of the reproducible final projects is the need for students to know or learn basic computer programming. That in mind, many software programs, such as SAS Enterprise Guide (Hemedinger & McDaniel, 2005), provide ways to generate computer code based on point-and-click actions taken by the user. Another potential way to circumvent this issue is to use more common software systems, such as Microsoft Excel, for analysis. The final project example described in Section 3.1 provides an example of an excel workbook in the data-raw that includes a visual similar to one of the visuals in the rendered .html file. The six steps of assessment presented in Section 3.2 would be nearly identical for an Excel submission, except that students would need to provide an already “rendered” .docx or .pdf document that copies/pastes the visuals provided in the excel file into the final report. Keep in mind that any assignment using Excel as the primary means of analysis would be at risk of the all-too-common copy/paste errors associated with point-and-click software systems (Horton, Alexander, Parker, Piekut, & Rundel, 2022; Perkel, 2022).
A third way this project could be adapted would be to have the student provide an analysis journal. An analysis journal is similar to the idea of using an electronic portfolio as a means of assessment (Buzzetto-More, 2010) and may include:
- transcripts of any ChatGPT inquiries and output related to the project,
- a step-by-step description of all changes that were made to the original data using point-and-click software,
- a daily or weekly project log where students describe key moments in their research progress over time,
- a review response document where students outline the changes they made to their final draft based on feedback from a writing tutor or peer.
The assessment of the analysis journal would be similar to assessing any other technical writing. Emphasis would be placed on writing that clearly communicates the student’s progression from initial idea to final product. Instructors may choose to relax formatting requirements for these documents as long as the formatting does not distract from the student’s articulation of their research steps. The critical element of any reproducible project adaptation is a way for the student to clearly communicate the process by which the final report was developed though the submission of secondary files.
Another potential issue with reproducible final projects is that such projects require that students and instructors use the same software versions. While many programming languages and their associated IDE’s are freely available, there is the potential for an increased burden on the part of the instructor to troubleshoot specific student installation issues. Hopefully, these issues would be concentrated in the first two weeks of the semester. One way to overcome this issue is to use cloud-based computing platforms, such as those as employed by the introductory data science class at the University of California, Berkeley (UCB, 2023). For R users, one convenient option is Posit cloud, which includes an instructor-level subscription service (Posit, 2023a).
One final limitation of reproducible final projects specific to STAT 1080 is the prevailing culture of making data science projects publicly accessible, also called open-source. While open-source projects accelerate learning and research, they also mean there are many community contributed analysis examples that students could try to copy for their final projects. One potential solution to this problem is to have students collect and use their own data, perhaps collected throughout the semester, for their final projects. For example, STAT 1080 includes a personal data collection project based on the Feltron Annual Reports (e.g. http://feltron.com/FAR13.html) that could potentially be expanded into a reproducible assessment that replaces the current final projects in the course.
5 Conclusions
Several scholars have expressed the idea that “writing is thinking” (McCullough, 2002; Mintz, 2021). This paper argues that computer programming is a form of modern writing that can be directly evaluated in reproducible assignments. This is not to suggest that all students need to be expert programmers, but simply that all students should learn basic skills in project organization, and perhaps computer programming, that allows their ideas to be reproduced and enhanced by others. Experience in STAT 1080 suggests that students can quickly capitalize on the many tools that make reproducibility feasible with minimal training. This paper has described the implementation of a final project in an introductory data science class that fosters reproducibility and proposed adaptations to the implementation to work for non-programming audiences. The proposed adaptations only require minor adjustments by the instructor for grading, namely downloading and decompressing a zip folder instead of using a LMS document preview feature. In so doing, this paper has demonstrated the feasibility with which reproducibility can be taught and assessed in undergraduate courses. It seems inevitable that the societies and economies of tomorrow will be increasingly characterized by AI, automation, and computation. No academic discipline will be immune to the increased demands for computational ability from their graduates. Small steps, such as the teaching of basic computer programming skills for the purpose of creating reproducible projects, will teach students critical skills in project organization and management that will prepare them to thrive within the computational systems shaping modern life. Further, such assignments will improve our ability to evaluate student learning in a technology-saturated world that blurs the line between output and understanding.
References
Allaire, J., Xie, Y., Dervieux, C., McPherson, J., Luraschi, J., Ushey, K., . . . Iannone, R. (2023). rmarkdown: Dynamic documents for R [Computer software manual]. Retrieved from https://github.com/rstudio/rmarkdown (R package version 2.22)
Anhalt, C. O., Cortez, R., & Bennett, A. B. (2018). The emergence of mathematical modeling competencies: An investigation of prospective secondary mathematics teachers. Mathematical Thinking and Learning, 20 (3), 202-221. Retrieved from https://doi.org/10.1080/10986065.2018.1474532
Baker, M. (2016, May 01). 1,500 scientists lift the lid on reproducibility. Nature, 533 (7604), 452-454. Retrieved from https://doi.org/10.1038/533452a
Ball, R., Medeiros, N., Bussberg, N. W., & Piekut, A. (2022). An invitation to teaching reproducible research: Lessons from a symposium. Journal of Statistics and Data Science Education, 30 (3), 209-218. Retrieved from https://doi.org/10.1080/26939169.2022.2099489
Bean, B. (2022). stat1080r: Functions and datasets for stat 1080: Foundations of data science [Computer software manual]. Retrieved from https://github.com/beanb2/stat1080r (R package version 0.1.0)
Blum, S. D. (2020). Ungrading: Why rating students undermines learning (and what to do instead). West Virginia University Press. Retrieved from https://www.wvupressonline.com/ungrading
Boenig-Liptsin, M., Tanweer, A., & Edmundson, A. (2022). Data science ethos lifecycle: Interplay of ethical thinking and data science practice. Journal of Statistics and Data Science Education, 30 (3), 228-240. Retrieved from https://doi.org/10.1080/26939169.2022.2089411
Bryant, C., Chen, Y., Chen, Z., Gilmour, J., Gumidyala, S., Herce-Hagiwara, B., . . . Rebelsky, S. A. (2019). A middle-school camp emphasizing data science and computing for social good. In Proceedings of the 50th acm technical symposium on computer science education (p. 358–364). New York, NY, USA: Association for Computing Machinery. Retrieved from https://doi.org/10.1145/3287324.3287510
Buckheit, J. B., & Donoho, D. L. (1995). Wavelab and reproducible research. In A. Antoniadis & G. Oppenheim (Eds.), Wavelets and statistics (pp. 55–81). New York, NY: Springer New York. Retrieved from https://doi.org/10.1007/978-1-4612-2544-75
Buzzetto-More, N. (2010). Assessing the efficacy and effectiveness of an e-portfolio used for summative assessment. Interdisciplinary Journal of e-Learning and Learning Objects, 6 (1), 61–85.
CCSSM. (2010). Common core state standards for mathematics. Retrieved from https://www.thecorestandards.org/Math/ (Page 72. Accessed: 6-20-2023)
Chen, Y., Jensen, S., Albert, L. J., Gupta, S., & Lee, T. (2023). Artificial intelligence (AI) student assistants in the classroom: Designing chatbots to support student success. Information Systems Frontiers, 25 (1), 161–182. Retrieved from https://doi.org/10.1007/s10796-022-10291-4
CRAN. (2023). The Comprehensive R Archive Network. Retrieved from https://cran.r-project.org/ (Accessed: 6-16-2023)
Dahlberg, B. (2018). Cornell food researcher’s downfall raises larger questions for science. Retrieved from https://www.npr.org/sections/thesalt/2018/09/26/651849441/cornell-food-researchers-downfall-raises-larger-questions-for-science (Accessed: 6-23-2023)
Doerr, H. M., Ärlebäck, J. B., & Misfeldt, M. (2017). Representations of modelling in mathematics education. Mathematical modelling and applications: Crossing and researching boundaries in mathematics education, 71–81. Retrieved from https://doi.org/ 10.1007/978-3-319-62968-1 6
Dogucu, M., & Çetinkaya Rundel, M. (2022). Tools and recommendations for reproducible teaching. Journal of Statistics and Data Science Education, 30 (3), 251-260. Retrieved from https://doi.org/10.1080/26939169.2022.2138645 doi: 10.1080/26939169.2022.2138645
Fanelli, D. (2018). Is science really facing a reproducibility crisis, and do we need it to? Proceedings of the National Academy of Sciences, 115 (11), 2628–2631. Retrieved from https://doi.org/10.1073/pnas.1708272114
Gentleman, R., & Lang, D. T. (2007). Statistical analyses and reproducible research. Journal of Computational and Graphical Statistics, 16 (1), 1-23. Retrieved from https://doi.org/10.1198/106186007X178663
Hemedinger, C., & McDaniel, S. (2005). The new world of SAS: Programming with SAS enterprise guide. In Proceedings of the thirtieth annual SAS users group international conference. Retrieved from https://support.sas.com/resources/papers/proceedings/proceedings/sugi30/050-30.pdf (Accessed: 6-16-2023)
Hester, J., Angly, F., Hyde, R., Chirico, M., Ren, K., Rosenstock, A., & Patil, I. (2022). lintr: A ’Linter’ for R code [Computer software manual]. Retrieved from https://CRAN.R-project.org/package=lintr (R package version 3.0.2)
Horton, N. J., Alexander, R., Parker, M., Piekut, A., & Rundel, C. (2022). The growing importance of reproducibility and responsible workflow in the data science and statistics curriculum. Journal of Statistics and Data Science Education, 30 (3), 207-208. Retrieved from https://doi.org/10.1080/26939169.2022.2141001
Irizarry, R. A. (2022). Introduction to data science: Data analysis and prediction algorithms with R. Retrieved from https://rafalab.dfci.harvard.edu/dsbook/ (Last Book Update: 12-05-2022)
Irizarry, R. A., & Gill, A. (2021). dslabs: Data science labs [Computer software manual]. Retrieved from https://CRAN.R-project.org/package=dslabs (R package version 0.7.4)
JASA. (2022). The JASA reproducibility guide. Retrieved from https://jasa-acs.github.io/repro-guide/ (Accessed: 6-28-2023)
Jupyter. (2023). Project Jupyter. Retrieved from https://jupyter.org/ (Accessed: 6-16-2023)
Keller, S. A., Shipp, S. S., Schroeder, A. D., & Korkmaz, G. (2020, feb 21). Doing data science: A framework and case study. Harvard Data Science Review, 2 (1). (https://hdsr.mitpress.mit.edu/pub/hnptx6lq)
Kim, J. (2023). Harvard professor who studies dishonesty is accused of falsifying data. Retrieved from https://www.npr.org/2023/06/26/1184289296/harvard-professor-dishonesty-francesca-gino (Accessed: 6-23-2023)
Knuth, D. E. (1992). Literate programming. CLSI Publications. Retrieved from https://web.stanford.edu/group/cslipublications/cslipublications/site/0937073806.shtml
Lo, C. K. (2023). What is the impact of ChatGPT on education? A rapid review of the literature. Education Sciences, 13 (4). Retrieved from https://www.mdpi.com/ 2227-7102/13/4/410
Marwick, B., Boettiger, C., & Mullen, L. (2018). Packaging data analytical work reproducibly using r (and friends). The American Statistician, 72 (1), 80-88. Retrieved from https://doi.org/10.1080/00031305.2017.1375986
McCullough, D. (2002). David McCullough quotes. Retrieved from https://www.goodreads.com/author/quotes/6281688.David McCullough (Accessed: 6-27-2023)
Mehta, C. C., & Moore, R. H. (2022). Third time’s a charm: A tripartite approach for teaching project organization to students. Journal of Statistics and Data Science Education, 30 (3), 261-265. Retrieved from https://doi.org/10.1080/26939169.2022.2118644
Mintz, S. (2021). Writing is thinking. Retrieved from https://www.insidehighered.com/blogs/higher-ed-gamma/writing-thinking (Accessed: 6-27-2023)
NASEM. (2019). Reproducibility and replicability in science. National Academies Press. Retrieved from https://nap.nationalacademies.org/catalog/25303/ reproducibility-and-replicability-in-science (Accessed: 6-28-2023)
Nature. (2018). Does your code stand up to scrutiny? Retrieved from https://www.nature.com/articles/d41586-018-02741-4 (Accessed: 6-28-2023)
openAI. (2023). Introducing ChatGPT. Retrieved from https://openai.com/blog/chatgpt (Accessed: 6-27-2023)
Perkel, J. M. (2022). Cut the tyranny of copy-and-paste with these coding tools. Nature. Retrieved from https://doi.org/10.1038/d41586-022-00563-z
Perkel, J. M. (2023, June). Six tips for better coding with ChatGPT. Nature. Retrieved from https://doi.org/10.1038/d41586-023-01833-0
Posit. (2023a). Friction free data science. Retrieved from https://posit.cloud/ (Accessed: 6-29-2023)
Posit. (2023b). RStudio IDE. Retrieved from https://posit.co/downloads/ (Accessed: 6-16-2023)
R Core Team. (2023). R: A language and environment for statistical computing [Computer software manual]. Vienna, Austria. Retrieved from https://www.R-project.org/
R Journal. (2023). How to submit your article. Retrieved from https://journal.r-project.org/submissions.html (Accessed: 6-28-2023)
Somers, J. (2018). The scientific paper is obsolete. The Atlantic. Retrieved from https://www.theatlantic.com/science/archive/2018/04/the-scientific-paper-is-obsolete/556676/ (Accessed: 6-23-2023)
Stodden, V. (2020). The data science life cycle: A disciplined approach to advancing data science as a science. Commun. ACM, 63 (7), 58–66. Retrieved from https://doi.org/10.1145/3360646
Stokel-Walker, C. (2022, December). AI bot ChatGPT writes smart essays—should professors worry? Nature. Retrieved from https://doi.org/10.1038/d41586-022-04397-7
Stokel-Walker, C. (2023, January). ChatGPT listed as author on research papers: many scientists disapprove. Nature. Retrieved from https://doi.org/10.1038/d41586-023-00107-z
UCB. (2023). Data 8: The foundations of data science. Retrieved from https://www.data8.org/ (Accessed: 6-29-2023)
Wing, J. M. (2019, July). The Data Life Cycle. Harvard Data Science Review, 1 (1). (https://hdsr.mitpress.mit.edu/pub/577rq08d)
Acknowledgement
The author would like to thank Dr. Brynja Kohler for providing some mathematical modeling literature. Further, the author would like to thank Dr. Brynja Kohler and Dr. Carrie Bala for providing comments and insights on preliminary drafts of this manuscript that improved the final version.
