Testing a Wellness Indicators Measure for People with Intellectual and Developmental Disabilities
Matthew Bogenschutz; Michael Broda; Sarah Lineberry; Parthenia Dinora; and Seb Prohn
Bogenschutz, M., Broda, M., Lineberry, S., Dinora, P., & Prohn, S. (2021). Testing a Wellness Indicators Measure for People with Intellectual and Developmental Disabilities. Developmental Disabilities Network Journal, 2(1), 20.
Testing a Wellness Indicators Measure for People with Intellectual and Developmental Disabilities PDF File
Abstract
Background and Purpose
People with intellectual and developmental disabilities (IDD) often have health and wellness issues that are not as good as people without disabilities. States are required to monitor health and wellness for people with IDD who use many disability services. However, there are few ways to monitor wellness between states or at different points in time. In this study, we share a new model that states may use to monitor wellness of people with IDD.
Methods
We used data from a survey called the National Core Indicators (NCI) to develop this model. First, we developed the model using our state’s data. Then, after we found a model that worked well, we tested that model using the National Core Indicators from the entire U.S.
Results
Our final model worked well in both our state NCI data and the national NCI data. This is important because policies at both levels can affect the services that people with disabilities can use. Our model had three parts: heart health, mental health, and behavioral wellness. These are described more in the paper. We also used statistics to test some factors that might predict outcomes related to heart health, mental health, and behavioral wellness. Age, sex, where someone lives, and level of intellectual disability were all good predictors of all three categories of wellness that we studied.
Implications
The model of wellness that we developed worked well but should be tested using data from other individual states. It is very important to know about health and wellness right now since the services people with disabilities can use are changing in many states. We think our model can help planners and advocates understand how services affect wellness in a way that is easy to compare from state to state and at different points in time.
Plain Language Summary
Background and Purpose
People with intellectual and developmental disabilities (IDD) often health and wellness that are not as good as people without disabilities. In this study, we share a new model that states may use to monitor wellness of people with IDD.
Methods
We used data from a survey called the National Core Indicators (NCI) measure health and wellness. We tested this model in Virginia and in the entire United States.
Results
Our final model worked well in both our state NCI data and the national NCI data. This is important because policies at both levels can affect the services that people with disabilities can use. Our model had three parts: heart health, mental health, and behavioral wellness.
Implications
The model of wellness that we developed worked well but should be tested using data from other states. We think our model can help planners and advocates understand how services affect wellness in a way that is easy to compare from state to state time.
The health challenges of people with intellectual and developmental disabilities (IDD) have been a focus of international attention since the early 2000s (Krahn & Fox, 2014). In 2012, two national IDD groups, The Arc and the American Association on Intellectual and Developmental Disabilities (AAIDD), produced a joint policy statement highlighting the need for policy and practice changes to address health care access and health disparities among individuals with IDD (AAIDD, 2012). As community living has replaced institutions for people with IDD, the need for community-based healthcare has increased, as has the need to monitor access to quality healthcare (Krahn et al., 2009; Krahn & Fox, 2014).
Despite the increased attention on health outcomes for people with IDD in recent years, there have been few attempts to measure wellness for people with IDD in a way that enables monitoring of system performance across time or across service systems, which vary from state to state. The current study seeks to fill this need by proposing an empirical model for measuring wellness, which was developed from National Core Indicators-In Person Survey (NCI-IPS) data at the national level and in one pilot state.
Measuring Health and Wellness Outcomes
There have been a number of attempts to measure health status and outcomes specifically for people with IDD, including the NCI-IPS and the Personal Outcome Measures (POM) from the Council on Quality and Leadership. The NCI-IPS includes objective measures of health (utilization of preventive and primary care) as well as a subjective measure (self-reported health status). The POM also incorporates subjective ratings of health, utilization of services, organizational supports, and health behaviors (Friedman et al., 2019). Aggregated data from the POM has been used as a measure of provider quality, while NCI-IPS data are typically used to monitor outcomes at the level of the state IDD system.
One commonly used way to track system performance at the state level is the NCI-IPS, which is widely used across states. Previous research using the NCI-IPS has highlighted IDD system performance on objective measures of health such as body mass index (Stancliffe et al., 2011), meeting physical activity recommendations (Stancliffe & Anderson, 2017), and accessing preventative care (Bershadsky et al, 2014).
Prior literature has identified a number of challenges to measuring state IDD system performance related to the health and wellness of people with IDD. Though we have known for some time that people with IDD experience inequitable access to services, including preventative and health promotion services (Krahn et al., 2006; Whittle et al., 2018), there has been less consensus on how to track and measure health-related outcomes systematically across states or within states over time. This may be, in part, due to the absence of high-quality, merged datasets that enable such tracking, while also accounting adequately for service costs (Bonardi et al., 2019; Dinora et al., 2020). Ecological challenges of using measures developed based on national data in individual state contexts (and vice versa) have also contributed to challenges in measuring health outcomes for people with IDD across states (Cheng et al., 2020). Additionally, use of population-based data to study health outcomes for people with IDD can be constrained by differing definitions of disability in different surveys and difficulty identifying people specifically with IDD in population-based study samples (Havercamp et al., 2019).
Physical Health
It is well established that people with IDD experience poorer physical health outcomes than people without disabilities (e.g., Anderson et al., 2013; Krahn et al., 2006; Reichard et al., 2011). Higher rates of co-occurring conditions, vulnerability to health risk behaviors, and lack of access to preventative healthcare and health promotion services contribute to shorter life expectancies and higher rates of mortality for manageable and preventable conditions (Krahn et al., 2006).
Rates of chronic conditions among people with IDD vary by study because of differing samples, methods of gathering data, and the type of data collected (Haveman, et al., 2010), but are generally reported to be equivalent to or higher than rates in the general population (Dixon-Ibarra & Horner-Johnson, 2014; Erikson et al., 2016; Haveman, et al, 2010). Analysis of the National Health Interview Survey (NHIS) from 2002 to 2011 found that adults with IDD were significantly more likely to experience diabetes, cardiovascular conditions, and respiratory conditions compared to adults without IDD (Fujiara, et al., 2018). Analysis of Medicaid claims found that 73% of beneficiaries with IDD had at least one chronic condition (Reichard et al., 2019). Compared to beneficiaries without disabilities, those with IDD had higher rates of diabetes, chronic kidney disease, chronic obstructive pulmonary disease (COPD) and cardiovascular disease (Reichard et al., 2019).
Mental Health
People with IDD often have high rates of mental health diagnoses, stress, and inadequate emotional support (Esler et al., 2019; Havercamp & Scott, 2015; Krahn et al, 2006; Scott & Havercamp, 2014). A recent analysis of NCI-IPS data found that 44.8% of respondents had at least one co-occurring psychiatric diagnosis and 53.5% were taking at least one psychotropic medication (Esler et al., 2019). Specifically, 22.9% of respondents had a mood disorder, 14.3% had an anxiety disorder, 9.8% had a psychotic disorder, and 6.1% had a different mental health diagnosis (Esler et al., 2019). These categories were not mutually exclusive, and 16.4% of respondents had two or more mental health diagnoses (Esler et al., 2019). The exact prevalence rate of co-occurring mental health diagnoses in people with IDD varies by study. For example, Reichard et al. (2019) found that 59% of Medicare beneficiaries with IDD had at least one mental health diagnosis, while Scott and Havercamp (2014) reported a prevalence rate of 36.6%.
Accurate diagnosis and effective treatment of mental health conditions may be complicated by communication challenges, atypical presentations of mental illness, and lack of access to providers with knowledge of IDD (Krahn et al., 2006). A study in Massachusetts found people with IDD were more likely than the general population to utilize the emergency department for mood and anxiety disorders, suggesting that the treatment available in the community is inadequate or inaccessible (Lauer et al., 2019). Additionally, while adequate emotional support is associated with significantly lower rates of mental health diagnoses (Scott & Havercamp, 2014), 30% of respondents to the NCI-IPS reported inadequate emotional support (Havercamp & Scott, 2015).
Behavioral Challenges
Research suggests that challenging behavior is distinct from mental health in people with IDD (McCarthy et al., 2010). Some researchers (Painter et al., 2018) have suggested that behavior may be an atypical presentation of mental illness, particularly for individuals with more significant disabilities. Other authors (Bowring et al., 2019; Davies & Oliver, 2014) have found mixed evidence for correlations between mental health and behavioral challenges and concluded that the two concepts have a complex relationship that is not yet well understood. Scott and Havercamp (2014) found that 45% of NCI-IPS respondents needed support for challenging behavior. A more recent analysis of NCI-IPS data found that 23.2% of respondents specifically needed support for self-injurious behavior (SIB) and that support for SIB is significantly associated with needing support for disruptive or destructive behavior (Bradley et al., 2018). Challenging behaviors are associated with lower levels of social support, friendship, community participation, satisfaction, choice, rights, and employment for people with IDD (Bradley et al., 2018; Scott & Havercamp, 2014). Psychotropic medications are frequently used to treat nonspecific challenging behaviors, without a formal diagnosis or behavior plan (Bradley et al., 2018; Esler et al., 2019; Krahn et al., 2006).
Study Objectives
The aim of this study was twofold: (a) to confirm a three-factor (cardiovascular, mental health, behavioral health) model of wellness in a large national random sample of people with IDD who use state-funded services, and (b) to explore the relationship among wellness indicators and socio-demographic characteristics.
Method
The methods summarized in the following sections were reviewed and approved by the Institutional Review Board at the authors’ affiliated university.
Design and Procedure
Development of the Wellness Indicators model emerged out of initial work with state-level NCI-IPS data as part of a larger study to investigate relationships between Medicaid service expenditures and outcomes for people with IDD in Virginia. For an accounting of the results of the state-level analysis, readers may refer to the authors’ open science website (Bogenschutz et al., 2021). The authors wished to design a method that could provide a more nuanced way for state IDD systems to measure wellness than had been developed previously from the IPS and found good fit with this present model, based on Virginia’s data. Subsequently, the researchers obtained the 2017-2018 NCI-IPS national dataset from its owners and tested the model against that national sample to assess fit.
Overview of State Study
Since measuring outcomes for people with IDD is often challenged by ecological issues (outcome models derived from national data often have poor statistical fit with a particular state’s data and vice versa), we wanted to create a model of wellness outcomes that would be statistically suitable for use in both national and Virginia contexts. To do this, we first decided to use our state’s NCI-IPS data to develop and test a model of wellness outcomes.
Initially, the wellness indicators were developed using the Virginia NCI-IPS data via an iterative item-selection process that accounted for the ordinal and/or categorical nature of the NCI-IPS scale items used. We started with all relevant items included and a single latent wellness factor. We then eliminated items based on low factor loadings (< .40 in standardized units) and subsequently grouped items into two and then three latent factors (cardiovascular health, mental health, and behavioral wellness), which was the solution we found that demonstrated the strongest model fit and parsimony. A full accounting of this process may be found on our project’s Open Science Framework website, which includes full output and code (Bogenschutz et al., 2021).
Data Source
Data for this study came from the NCI-IPS, a collaboration of participating states, the Human Service Research Institute, and the National Association of State Directors of Developmental Disabilities Services. NCI-IPS is a voluntary effort by public IDD agencies to measure and track their own performance; thus, the overall goal of the NCI-IPS project is to track state system-level performance, not necessarily to account for individual-level outcomes. A central component of NCI is the In-Person Survey (IPS; formerly known as the Adult Consumer Survey). The NCI-IPS is a nationally validated instrument administered face-to-face by trained interviewers to adults (18 years and older) who use at least one public IDD service (in addition to case management). The IPS gathers information about an individual’s general demographics, physical and behavioral health, and a range of personal outcomes. NCI-IPS results from the background section of the 2017-2018 survey were the basis for the analyses in this study. The background section of the IPS is completed using administrative records supplemented by information from the person’s case manager. The specific wording of questions that were used as the basis for our analyses may be found on the project’s OSF website (Bogenschutz et al., 2021).
Though not used in this study, the NCI-IPS also has two sections that are administered face-to-face with participants with IDD. Section I requires responses directly from the person with IDD and includes questions in a number of subjective domains, such as service satisfaction, safety, friendships, rights, home living, and employment choices. Section II may be answered by the person with IDD or by their proxy if needed. This section contains questions that may be answered objectively, including items about topics such as community inclusion, rights, choices, and service access.
Variables
The Wellness model was constructed from three clusters of NCI-IPS variables, all of which came from the background section of the NCI-IPS dataset from 2017-2018. The background section is completed using administrative records prior to administration of the IPS and is typically completed by a case manager. These variable clusters were selected because, based on face validity, they are indicators of basic wellness that are available in the NCI-IPS and were initially developed as factors for our model via a pilot using one state’s IPS data (Bogenschutz et al. 2021). Initially, we tested the feasibility of other variables as potential wellness indicators but found them to have poor fit with the state’s data; thus, they were removed from the final model.
Mental Health
Four variables were selected for inclusion in the mental health factor: (1) presence of mood disorder (e.g., depression, bipolar disorder, etc.), (2) presence of an anxiety disorder (e.g., obsessive disorders, panic disorders, etc.), (3) presence of a psychotic disorder (e.g., schizophrenia, etc.), and (4) presence of another mental illness or psychiatric diagnosis.
Cardiovascular Health
Similar to the mental health variables, the cardiovascular health indicators represented presence or absence of particular health conditions in the background section of the IPS. The variables that we used were: (a) presence of cardiovascular disease (e.g., coronary heart disease, angina), (b) presence of diabetes, including Type 1 and Type 2, (c) presence of high blood pressure, and (d) presence of high cholesterol.
Behavioral Wellness
Finally, a cluster of variables was used to indicate an individual’s behavioral wellness and support needs. There were six variables in this subscale: (1) noted behavioral challenges (e.g., aggression, self-injurious behaviors, pica, etc.); (2) whether the person has been prescribed medication for a behavior modification purpose (e.g., stimulant, sedative, or beta-blocker to treat ADHD, aggression, self-injurious behavior, etc.); (3) whether the individual has a current behavior plan; (4) support needs for self-injurious behavior; (5) support needs for disruptive behavior; and (6) support needs for destructive behavior. All of these variables could be addressed through the NCI-IPS background section.
Sample
In 2017-2018, a total of 25,671 people with IDD took part in the NCI-IPS, including the background section. Adults with IDD from 35 states and the District of Columbia were represented in the 2017-2018 dataset. Participating states were asked to establish a random sample that would reach a threshold of 95% confidence level and 5% margin of error which, for most states, was at least 400 individuals. Sample sizes varied from 331 (VT, WY) to 8,279 (CA). Sampling methodologies varied slightly from state to state. For example, some states used a stratified random sampling method. All states included a random sample of adults with IDD who used at least one state-funded service in addition to case management.
The mean age of respondents in the 2017-2018 national survey was 42 years and the sample was 59% male. The racial composition of the sample was predominantly White (67%) with respondents identifying as African American (16%) and Latinx (10%) also comprising a notable portion of the sample. In Virginia, sample demographics largely mirrored the national trends, based on a 2017-2018 sample size of 809.
Analysis
Data analysis for our national study included three phases, all using Mplus Version 7.11 (Muthén & Muthén, 2017). First, confirmatory factor analysis (CFA) was used to test the relative fit of a series of competing factor models of wellness. Consistent with recommended approaches for validating CFA models (e.g., Brown, 2014; Kline, 2015), we tested our preferred, three-factor model that emerged from our state-level model building (as described above) to a one-factor model that constituted a plausible alternative factor structure. We also tested several alternatives to obtain the best-fitting model for the pattern of item loadings on each factor, again in accord with methodological guidance (Brown, 2014; Kline, 2015), to obtain the model with the best balance of fit and parsimony. Data analysis was conducted using Mplus Version 7.11 (Muthén & Muthén, 2017) with the mean- and variance-adjusted weighted least squares estimator (WLSMV) for all models. This estimator allows for the use of robust standard errors to account for possible violations of the multivariate normality assumption common to most structural equation modeling (SEM) models. To explore missing data patterns, Little’s (1988) test was used to determine whether the data could be assumed missing completely at random (MCAR). The results of this test suggested that the data could not be treated as MCAR, thus requiring estimation procedures that are more robust to missing data. Overall, rates of missingness were quite low for most survey questions, with results reported for more than 90% of individuals for all items used. The lowest response rate was 92.9%, for the item pertaining to high cholesterol. To address any potential bias because of missing data, we compared the results generated by our preferred WLSMV estimator to a model that used full information maximum likelihood (FIML) via the MLR estimator in Mplus. Our results did not differ significantly in terms of magnitude or statistical significance regardless of the choice of estimator.
Assessing Model Fit and Parsimony
The mean- and variance-adjusted weighted least squares estimator (WLSMV in MPlus) and Satorra and Bentler (2001) scaled chi-square (S-B χ2) were used to examine model fit for all CFA models. In addition to the S-B χ2, we also used the comparative fit index (CFI), standardized root-mean-square residual (SRMR), and root-mean-square error of approximation (RMSEA) with a 90% confidence interval to assess model fit. We adopted Hu and Bentler’s (1999) guidelines for assessing acceptable model fit, which include CFI ≥ .95, SRMR ≤ .08, and RMSEA ≤ .06.
Results
Developing the Wellness Model: Descriptives and Correlations
Table 1 reports descriptive statistics and cross tabulations for each of the variables used in our analysis. Table 2 presents item-level polychoric correlations between all items used in this study. Polychoric correlation was used in order to determine the strength of association between the variables because all variables were ordinal in nature with two or more categories (Jöreskog, 1994; Olsson, 1979). This approach is especially preferred when conducting CFA with ordinal variables composed of less than five categories (Rhemtulla et al., 2012), which is often the case when working with NCI data.
| Variable | Category | % | n |
|---|---|---|---|
| Cardiovascular disease | 1 | 93 | 22,609 |
| 2 | 7 | 1,749 | |
| Diabetes | 1 | 88 | 21,653 |
| 2 | 12 | 2,866 | |
| High blood pressure | 1 | 78 | 18,922 |
| 2 | 22 | 5,338 | |
| High cholesterol | 1 | 81 | 19,189 |
| 2 | 19 | 4,476 | |
| Mood disorder | 1 | 68 | 16,577 |
| 2 | 32 | 7,740 | |
| Anxiety disorder | 1 | 71 | 17,229 |
| 2 | 29 | 7,028 | |
| Psychotic disorder | 1 | 69 | 16,782 |
| 2 | 31 | 7,400 | |
| Other mental illness | 1 | 90 | 21,417 |
| 2 | 10 | 2,427 | |
| Behavioral challenges | 1 | 88 | 21,482 |
| 2 | 12 | 2,801 | |
| Behavior medication | 1 | 78 | 18,472 |
| 2 | 22 | 5,281 | |
| Behavior plan | 1 | 72 | 17,588 |
| 2 | 28 | 6,737 | |
| Self-injurious behavior | 1 | 79 | 19,755 |
| 2 | 17 | 4,206 | |
| 3 | 4 | 1,105 | |
| Disruptive behavior | 1 | 59 | 14,215 |
| 2 | 31 | 7,426 | |
| 3 | 10 | 2,489 | |
| Destructive behavior | 1 | 72 | 17,413 |
| 2 | 22 | 5,263 | |
| 3 | 6 | 1,373 |
Items included in this work were initially selected from the NCI-IPS primarily based on their face validity. As demonstrated in Table 2, the items for this analysis had several distinct patterns of association, with a number of individual correlations in the .30 – .70 range. Moving from left to right in Table 2, the first four items (Cardiovascular Disease to High Blood Pressure) compose our hypothetical Cardiovascular Health construct, the next four items represent Mental Health, and the last six items represent our Behavioral Wellness construct. Within each of these clusters, higher correlations are observed, suggesting that the items may fit well into three separate but related constructs. Overall, no items demonstrated universally weak correlations below .10, and no items demonstrated universally large correlations above .80 that may hinder the detection of distinct and interpretable factors.
| Variable | 1 | 2 | 3 | 4 | 5 | 6 | 7 | 8 | 9 | 10 | 11 | 12 | 13 | 14 |
|---|---|---|---|---|---|---|---|---|---|---|---|---|---|---|
|
— | |||||||||||||
|
0.25 | — | ||||||||||||
|
0.37 | 0.53 | — | |||||||||||
|
0.32 | 0.51 | 0.62 | — | ||||||||||
|
0.10 | 0.18 | 0.16 | 0.20 | — | |||||||||
|
0.09 | 0.09 | 0.07 | 0.11 | 0.58 | — | ||||||||
|
0.01 | 0.02 | -0.03 | 0.02 | 0.47 | 0.46 | — | |||||||
|
0.10 | 0.10 | 0.09 | 0.11 | 0.44 | 0.27 | 0.45 | — | ||||||
|
0.10 | 0.16 | 0.20 | 0.20 | 0.45 | 0.34 | 0.39 | 0.44 | — | |||||
|
-0.02 | 0.01 | -0.01 | <.01 | 0.44 | 0.38 | 0.73 | 0.43 | 0.41 | — | ||||
|
0.02 | 0.04 | 0.01 | 0.04 | 0.41 | 0.34 | 0.70 | 0.30 | 0.37 | 0.66 | — | |||
|
-0.04 | -0.03 | -0.09 | -0.07 | 0.28 | 0.30 | 0.71 | 0.28 | 0.23 | 0.57 | 0.57 | — | ||
|
0.01 | 0.01 | -0.03 | 0.01 | 0.38 | 0.36 | 0.70 | 0.31 | 0.30 | 0.59 | 0.63 | 0.69 | — | |
|
-0.02 | 0.02 | -0.05 | -0.02 | 0.38 | 0.33 | 0.72 | 0.34 | 0.31 | 0.62 | 0.64 | 0.70 | 0.82 | — |
Investigating Alternative Factor Structures
Having examined the polychoric correlation matrix and found it conducive to factor analysis, we then used CFA to investigate the factor structure of the selected items. The initial working hypothesis was that the items would best be represented by three latent factors, Cardiovascular Health, Mental Health, and Behavioral Wellness, as had been confirmed in our state-level IPS analysis (described above). To confirm this, we first tested a model that included all items in one latent factor (a plausible rival hypothesis), then tested our preferred three-factor model. For each class of model, we compared a tau-equivalent model with a congeneric model in order to represent the underlying item loading patterns most accurately.
Four separate CFA models were tested. Model fit and parsimony statistics are available in Table 3. Model 4, the three-factor model with congeneric item loadings, demonstrated the best model fit and parsimony according to the guidelines suggested by Hu and Bentler (1999). In contrast, the one-factor model with tau-equivalent items demonstrated the worst fit and parsimony. Chi-square difference tests were significant for the comparisons between models 1 and 2, 2 and 3, and 3 and 4, respectively (all ps < .001). Therefore, the three-factor model with congeneric items appears to be the most accurate representation of the underlying constructs among the models we examined. This model also demonstrated excellent model fit and parsimony, with CFI, TLI, and RMSEA values all within the accepted thresholds for strong model fit. A path diagram representing model 4, the best-fitting model that was tested, can be found in Figure 1.
| Model # | Model description | S-B χ2 | df | p | CFI | TLI | RMSEA | 90% LB | 90% UB | WRMR |
|---|---|---|---|---|---|---|---|---|---|---|
| 1 | 1 Factor model w/ tau equivalent items | 49747.66 | 90 | < .001 | 0.69 | 0.69 | 0.15 | 0.15 | 0.15 | 24.35 |
| 2 | 1 Factor model w/ congeneric items | 19938.15 | 77 | < .001 | 0.88 | 0.85 | 0.10 | 0.10 | 0.10 | 12.09 |
| 3 | 3 Factor model w/ tau equivalent items | 4026.88 | 85 | < .001 | 0.98 | 0.97 | 0.04 | 0.04 | 0.04 | 6.20 |
| 4 | 3 Factor model w/ congeneric items | 2176.65 | 74 | < .001 | 0.99 | 0.98 | 0.03 | 0.03 | 0.04 | 4.27 |
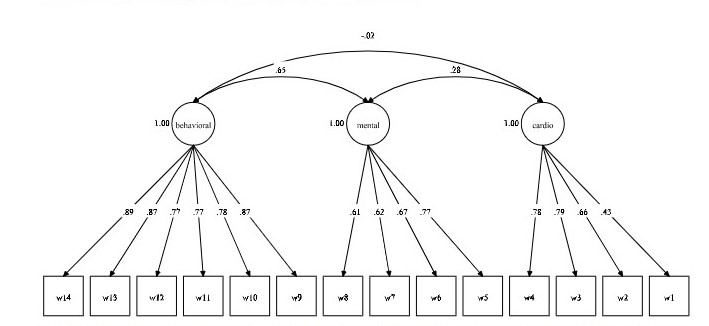 Figure 1 Wellness Confirmatory Factor Analysis for National Data
Testing the Wellness Model: Factor Correlations and Regressions
Factor Correlations
Correlations among the three wellness factors are shown in Table 4. All factors were significantly and positively correlated, however the relationships between latent factors varied in strength. The correlation between mental health difficulty and cardio health difficulty was small to medium in size using Cohen’s (1988) guidelines, while the correlations between mental health difficulty and behavioral health difficulty, and behavioral health difficulty and cardio health difficulty, were large in size.
| Measure | 1 | 2 | 3 |
|---|---|---|---|
|
1 | — | — |
|
0.295*** | 1 | — |
|
0.745*** | 0.677*** | 1 |
Personal Characteristics and Residential Contexts
We included basic personal characteristics (age, gender, severity of intellectual disability) and place of residence, as predictors of wellness in one multivariate structural equation model (SEM) that included all three wellness factors as outcomes. Complete results are displayed in Table 5.
| Mental health difficulty model | Cardio health difficulty model | Behavioral health difficulty model | ||||||||||
|---|---|---|---|---|---|---|---|---|---|---|---|---|
| Variable | B | SE | z | p | B | SE | z | p | B | SE | z | p |
| Group 4-6 | -0.171 | 0.033 | -5.139 | <.001 | -0.189 | 0.034 | -5.519 | <.001 | 0.022 | 0.028 | 0.787 | 0.432 |
| Group 7-15 | -0.161 | 0.057 | -2.797 | 0.005 | -0.103 | 0.055 | -1.88 | 0.060 | -0.224 | 0.049 | -4.597 | <.001 |
| Live w/ Fam. | -0.995 | 0.031 | -31.955 | <.001 | -0.157 | 0.033 | -4.755 | <.001 | -0.948 | 0.026 | -36.595 | <.001 |
| Live Ind. | -0.403 | 0.035 | -11.619 | <.001 | 0.093 | 0.035 | 2.67 | 0.008 | -0.554 | 0.03 | -18.717 | <.001 |
| Live w/ Host | -0.143 | 0.046 | -3.082 | 0.002 | -0.013 | 0.049 | -0.253 | 0.800 | -0.250 | 0.04 | -6.189 | <.001 |
| Age | -0.003 | 0.001 | -5.108 | <.001 | 0.033 | 0.001 | 55.12 | <.001 | -0.016 | 0.001 | -29.117 | <.001 |
| Female | 0.099 | 0.019 | 5.22 | <.001 | -0.091 | 0.019 | -4.786 | <.001 | -0.113 | 0.016 | -7.291 | <.001 |
| ID Level 2 | -0.069 | 0.022 | -3.158 | 0.002 | -0.144 | 0.022 | -6.523 | <.001 | 0.226 | 0.018 | 12.564 | <.001 |
| ID Level 3 | -0.153 | 0.029 | -5.207 | <.001 | -0.330 | 0.03 | -11.106 | <.001 | 0.466 | 0.022 | 20.73 | <.001 |
| ID Level 4 | -0.506 | 0.037 | -13.763 | <.001 | -0.516 | 0.036 | -14.255 | <.001 | 0.278 | 0.028 | 10.062 | <.001 |
Gender
Participants’ genders significantly predicted all three wellness factors. Women were associated with lower levels of cardio and behavioral difficulty and higher levels of mental health difficulty. All three of these estimates were fairly small in magnitude, with approximately .10 standard deviations difference between women and men.
Age
Most participants in the national sample ranged in age from 26 to 58 years. The youngest participants were 18 years old and the oldest was 95 years old. The SEM model found age to significantly predict all wellness factors. Older participants were associated with lower levels of mental health difficulty and behavioral difficulty but higher levels of cardio health difficulty. All three of these estimates were small in magnitude, ranging from -.003 to .033 in standard deviation units for each 1-year increase in participant age.
Level of Intellectual Disability
Disability status was associated with all three wellness outcomes. With each level of intellectual disability going from mild (ID level 1, the reference) to profound (ID level 4), mental health difficulty and cardio health difficulty decreased pointedly. Participants with moderate, severe, or profound ID were predicted to have more behavioral challenges and support needs than people with mild ID. The magnitude of these differences increased consistently from ID levels 2 to 4 for mental health and cardio health difficulty. For behavioral difficulty, moderate ID (ID level 2) was associated with the highest levels of behavioral difficulty.
Type of Residence
Residence type was found to be a relatively consistent predictor of wellness outcomes as well. Compared to those living in 2-3 bed group homes (the reference category), those living in all other settings were found to have lower levels of mental health difficulty. Further, those living in 2-3 bed group homes had higher levels of cardio difficulty compared to participants living in 4-6 bed group homes and those living with families. Participants living independently had higher levels of cardio difficulty than those living in 2-3 bed group homes. Finally, those living in 2-3 bed group homes had higher levels of behavioral difficulty compared to participants living in 7-15 bed group homes and those living with families, independently, or in sponsored residential housing.
Discussion
Extant literature suggests a longstanding pattern of poor wellness outcomes for people with IDD relative to the general U.S. population (Anderson et al., 2012; Krahn et al., 2006), yet researchers and policymakers have not previously developed a sound way to track wellness outcomes across state systems. This study developed and tested a novel three-factor model for understanding wellness for people with IDD who use Home and Community-Based Services (HCBS) waivers. The model’s development was significant in that state-level data were used to develop the model, which was then tested using the national NCI-IPS dataset, with results showing strong fit properties in both the state and national analyses. This procedure is significant, not only because it is among the first efforts to systematically measure wellness using the IPS, but also because most measures that have been developed using the IPS have relied exclusively on either state or national data, but not both. Since both state systems and federal policy help shape the lives of people with IDD, it is critical that we consider how to measure system-based outcomes at both levels.
In 2016, about 20% of the 7.37 million people with IDD used state services to support their health and community living, accounting for over 1.4 million people nationwide (Larson et al., 2018). Many of the services and supports provided through state systems are funded via Medicaid programs, including HCBS. The Centers for Medicare and Medicaid Services (CMS) requires the ongoing monitoring of wellness outcomes for people with IDD who use HCBS and other Medicaid-funded programs (CMS, n.d.). In order to meet this mandate, it is vital to have sound tools for measuring wellness at the system level. This study is among the first attempts to develop such a model that may be used to track wellness outcomes across state systems and offers the potential to be a useful tool for states to use to gain insight into how their services support the physical, mental, and behavioral wellness of people with IDD.
Tracking wellness outcomes may be particularly important at this point in time since the way in which many states are providing health and wellness supports for Medicaid beneficiaries with IDD is shifting rapidly. Notably, managed care approaches to Medicaid service management and provision are becoming more common and represent a major shift away from typical fee-for-service models of wellness service provision that have traditionally been offered to people with IDD. Having valid ways of measuring wellness will be essential for policymakers to monitor the effects of these changes and to help guide decision making about how their state systems support physical, mental, and behavioral wellness in the context of budgetary concerns. In this sense, using the wellness measures presented above may provide policymakers with a powerful new tool to use in quality assurance initiatives.
Future Directions and Limitations
While our model for measuring wellness outcomes using the NCI-IPS has strong properties based on national NCI-IPS data and the data of a representative state, it is important to note that state systems for supporting people with IDD vary. Thus, it is important to continue to test this model on individual state datasets before using it to track outcomes. While this study suggests that the model is likely to hold strong properties when applied in other state systems, checking suitability of the scale in other states and on additional sample cohorts is necessary, since sample characteristics may differ from state to state and from year to year.
Additionally, it is important to bear in mind that NCI-IPS samples are composed of people who use state-funded services, but that many people with IDD do not use any such services. We are unsure about how the model for measuring wellness that we have presented in this paper may or may not remain viable in samples of people with IDD who do not use state-funded services. Also, the variables we used to construct our model are all from the background section of the IPS, which is not based on self-response. Proxy reporting or data obtained from administrative records may have limitations, and self-reported health status may yield different results, especially for objective measures of health (Scott & Havercamp, 2019).
The wellness model is primarily intended to be used as a tool for tracking the performance of state IDD systems. In order to optimize the utility of the model, in future research and evaluation applications, we recommend that it be used in conjunction with other factors that can help policymakers make data-driven decisions about their investments on behalf of people with IDD, including service usage profiles (including residential supports and employment supports, for instance), opportunities for personal decision making, and demographic factors. Additionally, variables in the NCI do not encompass all possible indicators of mental health, cardiovascular health, and behavioral wellness, so our model is consequently bounded in nature. Future research should include other sources of data, including subjective and self-reported measures of health.
Conclusion
Psychometrically sound measurement is fundamental to meeting CMS mandates for supporting the wellness of people with IDD who use HCBS and other state-funded Medicaid services. This article presented an empirically derived model for measuring physical, mental, and behavioral wellness for people with IDD, using the widely administered NCI-IPS. The resulting model may present states with an important new way to track wellness outcomes as part of their system-level quality assurance efforts, with the goal of understanding and addressing the relatively poor health outcomes that affect millions of people with IDD.
References
American Association on Intellectual and Developmental Disabilities. (2012). Health, mental health, vision, and dental care: Joint position statement of AAIDD and the Arc. https://www.aaidd.org/news-policy/policy/position-statements/health-mental-health-vision-and-dental-care
Anderson, L. L., Humphries, K., McDermott, S., Marks, B., Sisirak, J., & Larson, S. (2013). The state of the science of health and wellness for adults with intellectual and developmental disabilities. Intellectual and Developmental Disabilities, 51(5), 385-398. http://doi.org/10.1352/1934-9556-51.5.385
Bogenschutz, M., Broda, M., Lineberry, S., Dinora, P., & Prohn, S. (2021). Testing of a wellness indicators model for people with intellectual and developmental disabilities. https://osf.io/fy3e7/?view_ only=71a10a13b9764733aa42e2aedd42d130
Bershadsky, J., Hiersteiner, D., Fay, M. L., & Bradley, V. (2014). Race/ethnicity and the use of preventative health care among adults with intellectual and developmental disabilities. Medical Care, 52 (10 Suppl 3), S25-31. http://doi.org/10.1097/MLR.0000000000000130
Bonardi, A., Lauer, E., Lulinski, A., Fay, M. L., Morris, A., Nygren, M. A., & Krahn, G. (2019). Unlocking the potential of state level data: Opportunities to monitor health and related outcomes in people with intellectual and developmental disabilities. Intellectual and Developmental Disabilities, 57(5), 390-404. http://doi.org/10.1352/1934-9556-57.5.390
Bowring, D., Painter, J., & Hastings, R. (2019). Prevalence of challenging behaviours in adults with intellectual disabilities, correlates, and association with mental health. Current Developmental Disorders Reports, 6(4), 173-181. https://doi.org/10.1007/s40474-019-00175-9
Bradley, V., Hiersteiner, D., Rotholz, D., Maloney, J., Li, H., Bonardi, A., & Bershadsky, J. (2018). Personal characteristics and outcomes of individuals with developmental disabilities who need support for self‐injurious behaviour. Journal of Intellectual Disability Research, 62(12), 1043-1057. http://doi.org/10.1111/jir.12518
Brown, T. A. (2014). Confirmatory factor analysis for applied research (2nd ed.). Guilford Publications.
Centers for Medicare and Medicaid Services. (n.d.). Home and community-based services 1915(c). https://www.medicaid.gov/medicaid/home-community-based-services/home-community-based-services-authorities/home-community-based-services-1915c/index.html
Cheng, S. L., Prohn, S., Dinora, P., Broda, M., & Bogenschutz, M. (2020). Measuring and tracking personal opportunity outcome measures over three years to guide policy and services that promote inclusive community living. Inclusion, (8)4, 335-350. https://doi.org/10.1352/2326-6988-8.4.335
Cohen, J. (1988). Statistical power analysis for the behavioral sciences (2nd ed.). Lawrence Erlbaum Associates.
Davies, L., & Oliver, C. (2014). The purported association between depression, aggression, and self-injury in people with intellectual disability: A critical review of the literature. American Journal on Intellectual and Developmental Disabilities, 119(5), 452-471. http://doi.org/10.1352/1944-7558-119.5.452
Dinora, P., Bogenschutz, M., & Broda, M. (2020). Identifying predictors for enhanced outcomes for people with intellectual and developmental disabilities. Intellectual and Developmental Disabilities, 58(2), 139-157. https://doi.org/10.1352/1934-9556-58.2.139
Dixon-Ibarra, A., & Horner-Johnson, W. (2014). Disability status as an antecedent to chronic conditions: National Health Interview survey, 2006–2012. Preventing Chronic Disease, 11. http://doi.org/ 10.5888/pcd11.130251
Erickson, S. R., Spoutz, P., Dorsch, M., & Bleske, B. (2016). Cardiovascular risk and treatment for adults with intellectual or developmental disabilities. International Journal of Cardiology, 221, 371-375. http://doi.org/10.1016/j.ijcard.2016.07.044
Esler, A., Hewitt, A., Hall-Lande, J., Pettingell, S. L., & Houseworth, J. (2019). Psychotropic medication use for adults with autism spectrum disorder who receive services and supports through adult developmental disability services in the United States. Journal of Autism and Developmental Disorders, 49(6), 2291-2303. http://doi.org/10.1007/s10803-019-03903-7
Friedman, C., Rizzolo, M. C., & Spassiani, N. A. (2019). Self‐management of health by people with intellectual and developmental disabilities. Journal of Applied Research in Intellectual Disabilities, 32(3), 600-609. http://doi.org/10.1111/jar.12554
Fujiura, G. T., Li, H., & Magaña, S. (2018). Health services use and costs for Americans with intellectual and developmental disabilities: A national analysis. Intellectual and Developmental Disabilities, 56(2), 101-118. http://doi.org/10.1352/1934-9556-56.2.101
Haveman, M., Heller, T., Lee, L., Maaskant, M., Shooshtari, S., & Strydom, A. (2010). Major health risks in aging persons with intellectual disabilities: An overview of recent studies. Journal of Policy and Practice in Intellectual Disabilities, 7(1), 59-69. http://doi.org/10.1111/j.1741-1130.2010.00248.x
Havercamp, S. M., Krahn, G. L., Larson, S. A., Fujiura, G., Goode, T. D., Kornblau, B. L., & National Health Surveillance for IDD Workgroup. (2019). Identifying people with intellectual and developmental disabilities in national population surveys. Intellectual and Developmental Disabilities, 57(5), 376-389. http://doi.org/10.1352/1934-9556-57.5.376
Havercamp, S. M., & Scott, H. M. (2015). National health surveillance of adults with disabilities, adults with intellectual and developmental disabilities, and adults with no disabilities. Disability and Health Journal, 8(2), 165-172. http://doi.org/10.1016/j.dhjo.2014.11.002
Hu, L. T., & Bentler, P. M. (1999). Cutoff criteria for fit indexes in covariance structure analysis: Conventional criteria versus new alternatives. Structural Equation Modeling: A Multidisciplinary Journal, 6(1), 1–55.https://doi.org/10.1080/10705519909540118
Joreskog, K. G. (1994). On the estimation of polychoric correlations and their asymptotic covariance matrix. Psychometrika, 59(3), 381–389.https://doi.org/10.1007/BF02296131
Kline, R. B. (2015). Principles and practice of structural equation modeling (4th ed.). Guilford Publications.
Krahn, G. L., & Fox, M. H. (2014). Health disparities of adults with intellectual disabilities: What do we know? What do we do? Journal of Applied Research in Intellectual Disabilities, 27I(5), 431-446. https://doi.org/10.1111/jar.12067.
Krahn, G. L., Fujiura, G., Drum, C. E., Cardinal, B. J., Nosek, M. A., & RRTC Expert Panel on Health Measurement. (2009). The dilemma of measuring perceived health status in the context of disability. Disability and Health Journal, 2(2), 49-56. http://doi.org/10.1016/j.dhjo.2008.12.003
Krahn, G. L., Hammond, L., & Turner, A. (2006). A cascade of disparities: Health and health care access for people with intellectual disabilities. Mental Retardation and Developmental Disabilities Research Reviews, 12(1), 70-82. http://doi.org/10.1002/mrdd.20098.
Larson S., Eschenbacher H., Anderson L., Taylor, B., Pettingell, S., Hewitt, A., Sowers, M., & Bourne, M. (2018). In-home and residential long-term supports and services for persons with intellectual or developmental disabilities: Status and trends through 2016. Minneapolis: University of Minnesota, Research and Training Center on Community Living, Institute on Community Integration.
Lauer, E., Nicola, N. D., Warsett, K., & Monterrey, R. (2019). Contributions of mental and behavioral health conditions to health service utilization among people with intellectual and developmental disabilities in Massachusetts. Inclusion, 7(3), 188-201. http://doi.org/10.1352/2326-6988-7.3.188
Little, R. J. A. (1988). A test of missing completely at random for multivariate data with missing values. Journal of the American Statistical Association, 83(404), 1198–1202. https://doi.org/10.1080/ 01621459.1988.10478722
McCarthy, J., Hemmings, C., Kravariti, E., Dworzynski, K., Holt, G., Bouras, N., & Tsakanikos, E. (2010). Challenging behavior and co-morbid psychopathology in adults with intellectual disability and autism spectrum disorders. Research in Developmental Disabilities, 31(2), 362-366. http://doi.org/10.1016/j.ridd.2009.10.009
Muthén, L. K., & Muthén, B. O. (2017). Mplus user’s guide (8th ed.). Muthén & Muthén.
Olsson, U. (1979). Maximum likelihood estimation of the polychoric correlation coefficient. Psychometrika, 44(4), 443–460. https://doi.org/10.1007/BF02296207
Painter, J., Hastings, R., Ingham, B., Trevithick, L., & Roy, A. (2018). Associations between mental health problems and challenging behavior in adults with intellectual disabilities: A test of the behavioral equivalents hypothesis. Journal of Mental Health Research in Intellectual Disabilities, 11(2), 157-172. http://doi.org/10.1080/19315864.2018.1431747
Reichard, A., Haile, E., & Morris, A. (2019). Characteristics of Medicare beneficiaries with intellectual or developmental disabilities. Intellectual and Developmental Disabilities, 57(5), 405-420. http://doi.org/10.1352/1934-9556-57.5.405
Reichard, A., Stolzle, H., & Fox, M. H. (2011). Health disparities among adults with physical disabilities or cognitive limitations compared to individuals with no disabilities in the United States. Disability and Health Journal, 4(2), 59-67. http://doi.org/10.1016/j.dhjo.2010.05.003
Rhemtulla, M., Brosseau-Liard, P. É., & Savalei, V. (2012). When can categorical variables be treated as continuous? A comparison of robust continuous and categorical SEM estimation methods under suboptimal conditions. Psychological Methods, 17(3), 354-373. https://doi.org/10.1037/ a0029315
Satorra, A., & Bentler, P. M. (2001). A scaled difference chi-square test statistic for moment structure analysis. Psychometrika, 66(4), 507–514. https://doi.org/10.1007/BF02296192
Scott, H. M., & Havercamp, S. M. (2014). Mental health for people with intellectual disability: The impact of stress and social support. American Journal on Intellectual and Developmental Disabilities, 119(6), 552-564. http://doi.org/10.1352/1944-7558-119.6.552
Scott, H. M., & Havercamp, S. M. (2018). Comparisons of self and proxy report on health‐related factors in people with intellectual disability. Journal of Applied Research in Intellectual Disabilities, 31(5), 927-936. http://doi.org/10.1111/jar.12452
Stancliffe, R. J., & Anderson, L. L. (2017). Factors associated with meeting physical activity guidelines by adults with intellectual and developmental disabilities. Research in Developmental Disabilities, 62, 1-14. http://doi.org/10.1016/j.ridd.2017.01.009
Stancliffe, R. J., Lakin, K. C., Larson, S., Engler, J., Bershadsky, J., Taub, S., Fortune, J., & Ticha, R. (2011). Overweight and obesity among adults with intellectual disabilities who use intellectual disability/ developmental disability services in 20 U.S. States. American Journal on Intellectual and Developmental Disabilities, 116(6), 401-418. http://doi.org/10.1352/1944-7558-116.6.401
Whittle, E., Fisher, K., Reppermunch, S., Lehroot, R., & Trollor, J. (2018). Barriers and enablers to accessing mental health services for people with intellectual disability: A scoping review. Journal of Mental Health Research in Intellectual Disabilities, 11(1), 69-102. http://doi.org/10.1080/19315864.2017.1408724
