5 Changing Needs of Individuals with Disabilities in the Time of COVID-19 as Observed by a Family Navigation Program in Miami, FL
Gabriella Llano; Allison Kumnick; Jean-Paul Bryant MS; Nancy Torres MS; Jeffrey Brosco MD, PhD; and Maite Schenker PhD
Llano, G., Kumnick, A., Bryant, J.-P., Torres, N., Brosco, J., & Schenker, M. (2020). Changing Needs of Individuals with Disabilities in the Time of COVID-19 as Observed by a Family Navigation Program in Miami, FL. Developmental Disabilities Network Journal, 1(2), 32–44. https://digitalcommons.usu.edu/ddnj/vol1/iss2/6/
Plain Language Summary
The Family Navigator Program (FNP) helps families of people with disabilities. The FNP is free for all people in South Florida. Families who work with the FNP are usually sent by their doctors, therapists, or friends. In this project, we looked at changes during COVID-19. Quarantine began in the middle of March in 2020. We looked at race, language, age, and disability for each family. We also looked at needs. Needs were topics that families wanted to learn more about or resources that the FNP told families about. We found no difference in age, race, or language before and after March 2020. During COVID, more families wanted help with money. More families also asked about government programs. Families asked less about school and therapy. These results help us know the problems of our clients during COVID. Families needed to focus more on money than school or therapy. This study shows how needs changed during COVID in one diverse city.
Background
Patient navigation programs—first established in the 1990s for breast cancer patients in Harlem, NY—aim to eliminate health disparities by addressing systemic barriers disproportionately affecting underserved populations (Freeman et al., 1995). Family navigation programs expanded this model to deliver services to families, including those of children and adults with intellectual and developmental disabilities (I/DD), chronic health conditions, mental health issues, and other special needs. This population of families faces unique challenges in navigating both the complex medical and disabilities services systems (King et al., 2002; Lightfoot, 2014). Barriers encountered by these families include lack of education on diagnoses and disabilities, as well as incongruities with providers’ spoken languages and cultural beliefs (Freedman & Boyer, 2000; Stahmer et al., 2019). The Family Navigator Program (FNP) at the Mailman Center for Child Development in Miami, FL., has been providing free navigation services to families in the Southeast Florida region since 2016. Funded by grants from the Taft Foundation, the FNP navigators are able to provide social support, refer families to community resources, and assist in applying for federal, state, and local programs.
The city of Miami is located in Miami-Dade County, which has a population made up of primarily Spanish-speakers, with almost 70% of families speaking Spanish in the home (Florida Legislature, Office of Economic and Demographic Research, 2020). Though these residents share a language, they represent over a dozen Spanish-speaking countries, each with their own culture. Additionally, nearly 20% of Miami-Dade County identifies as Black or African American, with a large population of Creole-speaking Haitian residents (Florida Legislature, Office of Economic and Demographic Research, 2020; Pierre, 2020). To best serve these populations necessitates cultural understanding and language proficiency. Additionally, 17% of all people and 23% of children live in poverty in Miami-Dade County (“ALICE County Profiles: Florida,” 2018; Florida Legislature, Office of Economic and Demographic Research, 2020). Families served by the FNP have varying financial, insurance, immigration documentation, and transportation needs that serve as barriers to accessing therapy and medical care. Many families rely on low-wage jobs and public assistance to care for their children. The FNP navigators are equipped to serve families in their native language to help them address social issues and improve their quality of life.
Families who are referred to the FNP go through an intake process, during which demographic information is collected. Navigators inquire about the families’ needs and concerns, which guides the next steps and individualizes this process for each family. At times, families have questions about various services that can be answered through an educational session with the navigator—these are referred to as the families’ educational components. Other times, families require direct referral to outside services and programs. The demographics, referrals, and topics on which families require education are documented in a client database, as well as dates of referral, intake, and follow-up communication. Finally, navigators record whether or not families have been connected to new resources as a result of their participation in the program. This database provides insight into the client population of the FNP; therefore, facilitating research and analysis for the sake of quality improvement. FNP client demographics and referral patterns can be monitored over time for changes, whether due to changes within the program or community circumstances.
In March 2020, the COVID-19 pandemic caused widespread unemployment, school closures, and financial strain on families in the U.S. A State of Emergency was declared in Miami-Dade County on March 12th, 2020, and by March 18th, stay-at-home orders and school closures were in effect throughout the region (Miami-Dade County Public Schools: Office of Communications and Community Engagement, 2020; Miami-Dade County Mayor’s Office, 2020). The unemployment rate in Florida rose to 13.8% in April from 4.4% in March (U.S. Bureau of Labor Statistics, 2020). Moreover, telemedicine visits rose in the U.S. by 154% by the end of March (Koonin et al., 2020). Consequently, FNP navigators began anecdotally noting changes in where families were being referred from, in addition to shifting resource requests and educational needs. In this study, we analyzed data from two independent cohorts of families served by the FNP before and during the COVID-19 crisis, specifically examining evolving demographics and family needs.
Methods
Sample and Inclusion Criteria
The study was conducted using data collected by the navigators of the FNP. Data from the 2019 and 2020 client logs were de-identified. The data were split into pre-COVID and COVID cohorts, with the pre-COVID subjects enrolled in the program from November 2019 to March 15, 2020, and the COVID subjects enrolled from March 15, 2020, until the end of September 2020. Data were utilized from families who completed all intake forms and were formally delivered services. Families found to have incomplete records were excluded from the study.
Variables for Analysis
Data were coded and uploaded to SPSS® software. The data analyzed included demographics, region of residence, referral methods, resources, and whether or not a family was successfully connected to resources.
Demographics
Demographic data collected included race/ethnicity, language of client preference, age group, and condition. All demographic values were self-reported by families, including the conditions of their children. Any value appearing only once was considered an outlier and not included in the analysis. Race was dummy-coded, and the categories included were White, Black/African American, and Hispanic/Latinx. Asymptotic significance (2-sided) was used to compare pre-COVID and COVID frequencies for each race individually, as participants may have self-identified as members of more than one racial/ethnic group. Language preferences included for comparison were English, Spanish, bilingual English/Spanish, and bilingual English/Creole. The Pearson chi-square test was used to compare pre-COVID and COVID rates for all groups. Age was identified in groups including birth to 2 years of age, 3 to 5 years, 6 to 12 years, 13 to 21 years, and greater than 21 years of age. The Pearson chi-square test was used to compare pre-COVID and COVID rates. A similar methodology was used to compare rates of conditions or diagnoses, which were reported by the family at intake. Asymptotic significance (2-sided) was used to compare pre-COVID and COVID rates. Zip codes detailing location of residence in South Florida were grouped by county name. A map was created using GIS mapping software (SAS JMP®) to visualize the neighborhoods in which clients reside.
Referral Method
Families are referred to the FNP via a variety of sources. These sources were grouped into the following categories: external agencies, family or friend, the Jackson Health System (Miami-Dade County’s largest public hospital), self-referral, or referral through any University of Miami clinic. Fisher’s exact test was used to compare pre-COVID and COVID groups. This test was implemented whenever greater than 20% of cells contained counts less than 5, as was seen when collecting referral method data.
Needs
Client needs are inferred by analyzing both the topics on which families requested education and the resources to which families were referred, as these are direct reflections of the families’ concerns at intake. The topics on which families were educated were broad; therefore, for this study, they were grouped into the following categories: Medical, School Systems, Therapy, Federal and State Programs, and Other. Education on insurance coverage, dental coverage, medical needs, and information on the pandemic itself were all grouped into the Medical category. Education on afterschool programs and exceptional student education (ESE) were included in the School Systems category. Education on certain therapy providers or types of therapies available to families was included in the Therapy category. Any sort of education on navigation of available government assistance programs for families was grouped into the Federal and State Programs category. The Other category included education on topics such as seeking legal counsel, custody agreements, assistive technologies, financial aid, and transition to adulthood.
Binary logistic regression was used to compare pre-COVID and COVID groups. Similarly, binary logistic regression was used to compare groups in terms of resources that families were referred to, which were grouped into the categories of Medical, Financial Crisis, Disability Services, Mental Health, and Federal and State Programs. Some medical resources that families were connected to include pediatric care, local hospital network care, psychiatry care, dental care, or Medicaid. A few of the resources that families were referred to in the Financial Crisis category included housing options, re-employment benefits, food stamps or similar resources, legal aid, and utility payment support. In the Disability Services resource category, families were referred to multiple therapy providers, various advocacy groups, vocational rehabilitation programs, Applied Behavioral Analysis, Parent-to-Parent of Miami, Parent-Child Interaction Therapy, and Florida’s Assistive Technology Program. The Mental Health resource category refers to any mental health options with which the FNP was able to connect families. In the Federal and State Programs resource category, families were referred to certain social programs or the Department of Children and Families. Resources were only coded into SPSS if they were used three or more times by study participants.
Connectivity to Resources
Rates of connectivity to resources were assessed based on individual demographic factors to evaluate predictors of families being connected to services. Connectivity rates between pre-COVID and COVID cohorts were compared first. Subsequently, cohorts were stratified by additional characteristics—language, age group, race, educational components, and resources— and were analyzed individually comparing connection rates pre- and during COVID. This was done using binomial logistic regression models with calculation of odds ratios and 95% confidence intervals. Models were created for each of the two cohorts in an identical fashion, and the aforementioned characteristics were analyzed as covariates.
Results
The “pre-COVID cohort” consisted of 145 families served by the FNP from November 1, 2019, to March 14, 2020. The “COVID cohort” consisted of 197 families served from March 15, 2020, to September 30, 2020.
Demographics
No statistically significant differences were found when comparing all demographic factors between the two groups. In terms of race/ethnicity, most families identified as Hispanic/ Latinx both before and during the pandemic (57% vs 60%, p = 0.556; see Table 1 and Figure 1). Preferred language in which families received services also did not change significantly from before COVID to the time during the pandemic (p = 0.156). In both groups, Spanish alone was the most common language (47% before and 43% during COVID) when compared to English alone or bilingual English/Spanish or English/Creole (Table 1).
| Demographic variable | Pre-COVID (%) | During COVID (%) | Chi square p value |
|---|---|---|---|
| Language | |||
| English | 38 | 34 | 0.156 |
| Spanish | 47 | 43 | |
| English/Spanish | 10 | 19 | |
| English/Creole | 5 | 4 | |
| Race/Ethnicity | |||
| White | 18 | 19 | 0.750 |
| Black / African American | 26 | 21 | 0.305 |
| Hispanic/Spanish/Latinx | 57 | 60 | 0.556 |
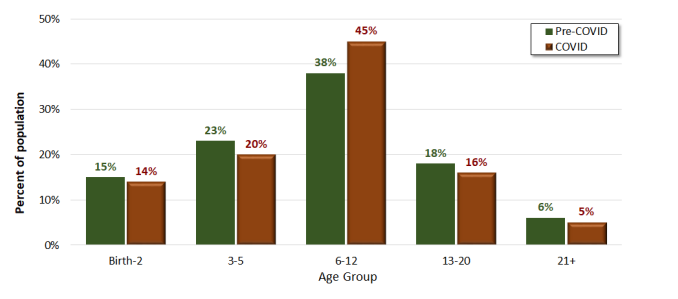
Demographic Age Data for Pre-COVID (n = 145) and During COVID (n = 197) Cohorts
The five age intervals showed no difference before or during COVID-19 (p = 0.741). In each group, the FNP mostly worked with parents of school-aged children in the age range of 6 to 12 years old (38% before and 45% during COVID). Regarding the condition or diagnosis of the family member with I/DD, it is important to note that this information was self-reported by family members and that a single individual could report multiple conditions. The most commonly reported conditions were autism spectrum disorder (ASD; 39% before COVID vs 32% during COVID), attention deficit/hyperactivity disorder (ADHD; 13% vs. 16%), global developmental delay (13% vs. 9%), and a mental health or behavioral condition (19% vs. 11%). There were no significant differences found between groups in comparing before COVID to during COVID (p = 0.211; see Figure 2).
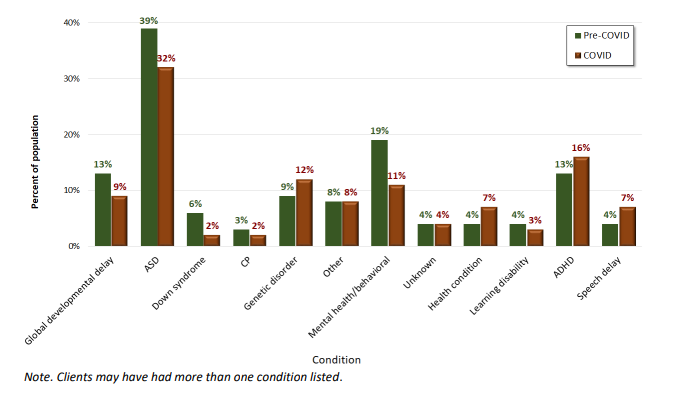
Family-Reported Conditions of Clients for Pre-COVID (n = 145) and During COVID (n = 197) Cohorts
Note. Clients may have had more than one condition listed.
GIS mapping software was utilized to visualize where families seeking services from the FNP resided both before and during the pandemic. Figure 3 demonstrates that the pre-COVID cohort resided in areas of South Florida that were further away from the Mailman Center in both north and south directions. During the pandemic, the program saw an increase in participants residing in neighborhoods that were geographically closer to the Mailman Center and were more centralized to downtown Miami, FL. This is especially true of zip codes representing Little Havana and Overtown.
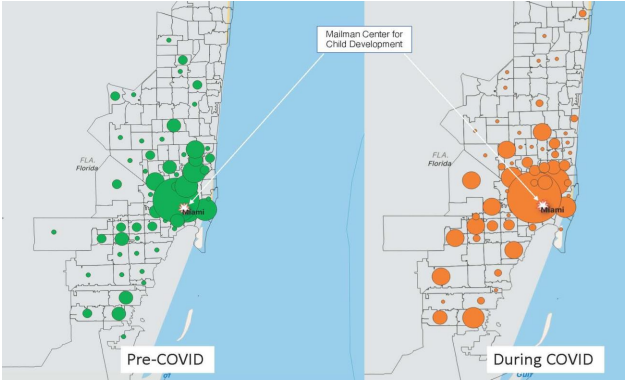
Demographic Location Data for Pre-COVID (n = 145) and during COVID (n = 197) Cohorts, Based on Family Zip Code
Note. Stars denote the location of the Mailman Center for Child Development, where the FNP is based. The regions depicted cover Miami-Dade and Broward counties in Southeast Florida, USA.
Referral Method
Five categories of referral methods were used in comparison between pre-COVID and COVID cohorts (Self-Referral, University of Miami clinics, Jackson Health system, Family or Friend, and External Agencies). The most common referral method used in both the pre-COVID and COVID cohorts was referral through the University of Miami clinics (73% before and 71% during COVID). There was no significant difference between groups (p = 0.564).
Needs of Families
Table 2 shows the results of the differences between the two cohorts regarding educational components, which consists of education provided on Medical, School, Therapy, Federal and State Programs, and Other topics. Education provided by the navigators concerning school or therapy both decreased in frequency during COVID (OR = 0.531, 95% CI [0.328-0.858] and OR = 0.534, 95% CI [0.345-0.825], respectively). Conversely, education on federal and state programs or other topics increased during the pandemic (OR = 2.156, 95% CI [1.306-3.560] and OR = 1.902, 95% CI [1.081-3.348], respectively).
| Category | OR | 95% CI | p value |
|---|---|---|---|
| Medical | 1.225 | .797-1.882 | .355 |
| School | .531 | .328-.858 | .010* |
| Therapy | .534 | .345-.825 | .005* |
| Federal/State Programs | 2.156 | 1.306-3.560 | .003* |
| Other | 1.902 | 1.081-3.348 | .026* |
Families were then referred by the navigators to resources that best fit their unique case, taking into account the families’ transportation and socioeconomic restrictions. These results are displayed in Table 3. Of the types of resources reported, including the Medical, Financial Crisis, Disability Services, Mental Health, and Federal and State Programs categories, only the Financial Crisis category changed significantly from before COVID to during COVID (OR = 3.019, 95% CI [1.445-6.308]).
| Category | OR | 95% CI | p value |
|---|---|---|---|
| Medical | 1.221 | .764-1.950 | .404 |
| Financial crisis | 3.019 | 1.445-6.308 | .003* |
| Disability services | .633 | .366-1.094 | .101 |
| Mental Health | .717 | .322-1.598 | .416 |
| Federal/state Program | .986 | .587-1.655 | .957 |
*Denotes significance (p<0.05)
Connectivity to Resources
In the context of this study, connectivity rates indicate whether or not families were successfully connected to any new resources as a result of working with the FNP. Overall, connectivity rates were consistent across the two cohorts (p = 0.676). Upon further stratification, data indicated that before COVID, Spanish (OR = 2.107, 95% CI [1.001-4.435]) or bilingual English/Spanish (OR = 5.828, 95% CI [1.2-28.293]) speakers were more likely to be successfully connected to services than families that spoke English alone (OR = 2.107, 95% CI [1.001-4.435] and OR = 5.828 CI [1.200-28.293], respectively). There were no differences between English-speaking families and bilingual English/Creole families (OR = 0.672, 95% CI [0.137-3.290]). This effect was no longer observed during COVID. Examining educational components and connectivity prior to the pandemic, families who requested education on the school system were more likely to be successfully connected than those who did not request education on this topic (OR = 2.331, 95% CI [1.049-5.178]). Conversely, families who requested education on state and federal programs during the pandemic were more likely to be connected to services compared to families who did not request education on these programs (OR = 2.546, 95% CI [1.307-4.961]). Other demographics including age group, race/ethnicity, and method of referral were never significant predictors of connection rates either before or during the pandemic.
Discussion
The aim of this study was to investigate connectivity trends among demographics and evaluate the needs of families enrolled in this FNP at the Mailman Center for Child Development before and during the COVID-19 pandemic. As the results illustrate, there were no statistically significant differences in the demographics of families who worked with the FNP before and during the pandemic. These demographic results indicate a consistency in population that were referred or self-referred for services from this program. In accordance with this observation, the methods by which families were referred did not significantly change. The largest source of referrals in both cohorts was through the University-affiliated clinics. With clinical care transferring to telemedicine platforms, both the volume and sources of referrals to our family navigation services were largely unaffected. This supports the strength of the program’s relationship with these clinics—namely the genetics and neurology clinics—after 4 years of operating together in the Mailman Center. Navigators anecdotally noted a shift in referrals, as families networked less in school or community settings; however, these effects were not captured by the broad categories used in this analysis.
In general, the FNP mostly serves those who identify as Hispanic or Latino/Latinx. This is likely attributable to the ethnic composition of South Florida, the majority of which are Latinx individuals (Florida Legislature, Office of Economic and Demographic Research, 2020). Speaking Spanish alone was more common than English alone or speaking bilingual English/Spanish or English/Creole. Of note, this demographic is representative of the language preferred by families for receiving services from the program, not based on an inquiry of languages spoken in the home. Further describing the population, we found that the FNP works mostly with families of school-aged children from 6 to 12 years of age. This is likely because of the complex needs of children with I/DD in this age group. As children age, families potentially have an improved grasp on the systems in place to support their children. Consequently, navigators hypothesized that an increase in school-aged children during COVID-19 due to school closures could occur. Data analysis demonstrated a small increase, though it was not found to be statistically significant.
Families most commonly reported the following conditions to the navigators: ASD, followed by ADD or ADHD, global developmental delay, and mental health or behavioral conditions. Regarding the area of residence of families, a more centralized radius of zip codes was observed during the pandemic compared to before the pandemic. Navigators hypothesize this is because families rely on community resources closer to their homes. Further, if families living far away were no longer seeking other services from the University of Miami network, then they were also less likely to be referred to the FNP. Perhaps families from Overtown and Little Havana, two neighborhoods with many residents of lower socioeconomic status, had few resources to turn to within their communities. Early in the pandemic, the FNP saw a drop in referrals, but they returned to previous rates after a few weeks. This is presumably due to the increased utilization of telemedicine appointments, during which providers referred families to the program.
As hypothesized, the needs of participants in the FNP did change significantly between groups. With respect to topics on which navigators educated families, significant differences were found between school systems, therapy, federal and state programs, and the category listed as “Other.” School systems and therapy were less likely to be inquired about during COVID, likely because of the closure of most schools and the decrease in likelihood that a family was encouraged to seek new therapy services. During the pandemic, federal and state programs were more likely to be inquired about—this observation is in accordance with trends in the U.S. of increased utilization of government resources (Center on Budget and Policy Priorities, 2020; Rudowitz & Hinton, 2020). Because of the pandemic, navigators began referring families to new resources. These were not previously coded in the client database; therefore, many were classified as “Other,” explaining the statistically significant increase in this category during COVID. There was no difference before and during the pandemic in terms of seeking education on medical resources, most likely because the needs before the pandemic were widely replaced by COVID-related medical education needs. It can be hypothesized that during the pandemic, families were forced to prioritize the needs of the whole family while making additional sacrifices for the child with I/DD.
Of the broad variety of resources to which families were referred directly by the navigators, only resources regarding the financial crisis changed significantly during COVID-19. This is an indication that families during this time came to the FNP to seek resources to aid with newer financial burdens. These resources included re-employment benefits, housing and utility payment support, and food stamps. Interestingly, education on federal and state programs increased during the pandemic, but referrals to such resources did not. When examining these effects, it appears that prior to COVID, families were educated on and referred to federal and state programs at similar rates (20% and 22%, respectively); however, during the pandemic, there was only an increase in education (35%) and not referral to federal and state programs (22%, unchanged). Navigator testimony leads us to believe that this trend is because of an increase in educational conversations with families surrounding their rights as outlined by the Americans with Disabilities Act (ADA; U.S. Department of Education, 2020). Navigators noted many parents were not aware of the ADA or its implications on their children’s schooling until concerns arose during the pandemic. Families were educated by the FNP on the logistics of state and federal enforcement of the ADA, as well as updates on the obligations of public-school systems during the crisis.
When assessing the changes in needs of the families, topics on which clients were educated and categories of resources to which families were referred differed significantly between pre-COVID and during COVID cohorts. Rates of connecting families to proper resources alone did not change significantly from pre-COVID participants to those families served during COVID, indicating a successful transition to virtual platforms and adequate adaptation to the families’ changing needs. However, upon further stratification some demographic factors and family needs did correlate with significant changes in connectivity. Specifically, language spoken was a significant predictor before the pandemic for connectivity rates, and this may be explained at least in part by the family navigators themselves being native Spanish speakers. This effect was not observed during the pandemic, possibly because connection to appropriate resources during a time of crisis likely naturally favors English-speaking individuals, making it more difficult for families to be adequately connected to the resources they may need. Families who sought education about their school systems were more likely to be connected compared to families who did not. This is likely indicative of already well-established school procedures with easy-to-navigate systems in place. Additionally, during COVID-19, families seeking education about federal and state programs were found to be connected significantly more often. This effect may be twofold—families were likely to follow up on referrals out of urgent necessity, and federal and state programs became more accessible because of an increase of emergency funds on local and national levels.
Conclusions and Future Directions
In consideration of the future of the FNP at the Mailman Center for Child Development in Miami, Florida, this study highlights the strength of the program despite the drastic environmental and political changes brought about by the COVID-19 pandemic. The depth of information collected in the client database provides a unique opportunity to reflect on this population and provide insight to navigators and the community. Though the demographics of the client population served by the FNP did not change significantly during the pandemic, their needs for education and referrals did. Families needed less information about school systems and therapy providers; they needed more education on state and federal systems, as well as a variety of other topics not usually addressed by the navigators. The resources to which families were referred did not change as much—families were more likely to be given referrals only to state and federal agencies. Clients were successfully connected to resources at the same frequencies during COVID as before, which is an indicator of a successful adaptation to the crisis.
Moving forward, this program intends to continue using virtual platforms and other methods elicited by the pandemic to continue to connect with families that the program serves. This makes the program more available to families with transportation limits, time constraints, or other barriers to accessing the program. In fact, the virtual protocol that exists now is more interactive and informative for families, as family navigators often utilize screen-sharing to involve family members as much as possible with their services. This increases the family’s technological capabilities and allows for greater independence when needing services in the future. Unfortunately, because of pandemic constraints, the family navigators are no longer accompanying their clients to medical visits. At present, this extends to the patients’ telehealth appointments. Therefore, navigators are entirely dependent on families to vocalize their needs and the recommendations of their clinicians. In the future, we hope to implement initiatives that allow for our program’s involvement in the telehealth sphere to further serve families in need.
The FNP at the Mailman Center is concerned about the long-term effects of the pandemic on their client population. This upheaval of families’ lives will likely lead to setbacks in the future, such as children going long periods of time without various therapies. As families are forced to budget limited funds for the needs of the entire family, lessening the priority of the individual with special needs, there is ample opportunity for hardships or hindrances to arise. Mental health and behavioral concerns, for example, may go unaddressed for months. Additionally, resources in the community may have limited capacity to serve families or be forced to shut down altogether, as many establishments are going out of business. A future study examining the long-term effects of COVID-19 on the FNP client population will allow us to elucidate these quandaries and work to neutralize any negative consequences of the pandemic on our families.
Limitations
This project is not without its limitations. The data on connectivity only include whether or not families successfully connected with any resource but does not include exactly what or how many resources each family was able to access. All conditions and diagnoses are based on family reporting; and though there is a standardized client database, navigators may record varying degrees of data. Additionally, this analysis includes families from the FNP client database, reflecting a sample of specifically referred clients from a single diverse, urban community, rather than a randomized sample.
References
ALICE County Profiles: Florida. (2018). Asset limited, income constrained, employed. https://www.unitedforalice.org/county-profiles/florida
Center on Budget and Policy Priorities. (2020). Tracking the COVID-19 recession’s effects on food, housing, and employment hardships. https://www.cbpp.org/research/poverty-and-inequality/tracking-the-covid-19-recessions-effects-on-food-housing-and
Florida Legislature, Office of Economic and Demographic Research. (2020). Miami-Dade County. http://edr.state.fl.us/content/area-profiles/county/miamidade.pdf
Freedman, R. I., & Boyer, N. C. (2000). The power to choose: Supports for families caring for individuals with developmental disabilities. Health and Social Work, 25(1), 59-68. doi:10.1093/hsw/25.1.59
Freeman, H. P., Muth, B. J., & Kerner, J. F. (1995). Expanding access to cancer screening and clinical follow-up among the medically underserved. Cancer Practice, 3(1), 19-30.
King, G., Tucker, M. A., Baldwin, P., Lowry, K., Laporta, J., & Martens, L. (2002). A life needs model of pediatric service delivery. Physical & Occupational Therapy in Pediatrics, 22(2), 53-77. doi:10.1080/J006v22n02_04
Lightfoot, E. (2014). Children and youth with disabilities in the child welfare system: An overview. Child Welfare, 93, 23-45.
Koonin, L. M., Hoots, B., Tsang, C. A., Leroy, Z., Farris, K., Jolly, B. T., Antall, P., McCabe, B., Zelis, C. B. R., Tong, I., & Harris, A. M. (2020). Trends in the use of telehealth during the emergence of the COVID-19 pandemic: United States, January–March 2020. Morbidity and Mortality Weekly Report, 69(43), 1595-1599. https://www.cdc.gov/mmwr/volumes/69/wr/mm6943a3.htm#suggested citation
Miami-Dade County Public Schools: Office of Communications and Community Engagement. (2020, March 13). M-DCPS announces districtwide school closures effective Monday, March 16, 2020. http://news.dadeschools.net/cmnc/new/29440#:~:text=M%2DDCPS%20Announces%20Districtwide%20School,Recess%2C%20will%20continue%20as%20planned
Miami-Dade County Mayor’s Office. (2020). Emergency orders. (2020). https://www.miamidade.gov/global/initiatives/coronavirus/emergency-orders.page
Pierre, J. M. (2020). 2020 Census & Haitians. https://www.miamidade.gov/economy/library/2020-census/census-task-force-2019-08-26-census-and-haitians.pdf
Rudowitz, R., & Hinton, E. (2020, May 15, 2020). Early look at Medicaid spending and enrollment trends amid COVID-19. https://www.kff.org/coronavirus-covid-19/issue-brief/early-look-at-medicaid-spending-and-enrollment-trends-amid-covid-19/
Stahmer, A. C., Vejnoska, S., Iadarola, S., Straiton, D., Segovia, F. R., Luelmo, P., Morgan, E., Lee, H., Javed, A., Bronstein, B., Hochheimer, S., Cho, E., Aranbarri, A., Mandell, D., Hassrick, E. M., Smith, T., & Kasari, C. (2019). Caregiver voices: Cross-cultural input on improving access to autism services. Journal of Racial and Ethnic Health Disparities, 6(4), 752-773. doi:10.1007/s40615-019-00575-y
U.S. Bureau of Labor Statistics. (2020). Economy at a glance: Florida. https://www.bls.gov/eag/eag.fl.htm
U.S. Department of Education. (2020). Questions and answers on providing services to children with disabilities during the coronavirus disease 2019 outbreak. https://www2.ed.gov/policy/speced/ guid/idea/memosdcltrs/qa-covid-19-03-12-2020.pdf
