9 Planning Inventory
How Much is Too Much?
Evan Barlow
Learning Objectives
- Understand the purposes for holding inventory
- Understand the trade-offs between inventory costs and service levels
- Be able to visualize inventory levels and their fluctuations over time
- Be able to use simple strategies for managing inventory
- Be able to describe inventory performance through basic metrics
Introduction: Why Inventory Matters
What is Inventory?
Imagine stepping into your favorite coffee shop early on a busy weekday morning. The aroma of freshly brewed coffee fills the air, and you eagerly await your turn to order your usual -- a latte and a blueberry muffin. But what if, just as you reach the counter, the barista regretfully tells you they're out of muffins? Or worse yet, there's no milk for your latte?
Your coffee shop, like every other business, relies on inventory -- supplies of ingredients, cups, napkins, and pastries—to ensure they can consistently meet customer demand. Simply put, inventory is any stored resource used to satisfy future demand. Without sufficient inventory, businesses risk disappointing their customers; too much inventory, however, leads to unnecessary costs. Finding the right balance is critical.
Why Companies Hold Inventory
Companies don't keep inventory because they love storage rooms or enjoy spending money upfront. Instead, businesses maintain inventory primarily for these strategic reasons:
- Buffering Against Uncertainty:
Demand for products or services often varies unexpectedly. Perhaps more customers than usual want muffins on a particular morning. Having extra muffins on hand ensures that demand spikes don't immediately translate into disappointed customers. - Ensuring Smooth Operations:
Inventory helps businesses keep their operations running smoothly. Imagine your coffee shop running out of coffee beans mid-morning rush -- employees would have nothing to brew, leading to downtime and lost sales. Inventory provides continuity, enabling businesses to operate without constant interruptions. Furthermore, inventory allows companies to adapt and change elements of their business without creating a massive shock whose ripples are felt through the entire business. - Taking Advantage of Economic Ordering:
Buying supplies or ingredients in bulk often results in significant cost savings. A coffee shop may choose to order cups or coffee beans in larger quantities to benefit from lower prices per unit, despite the need to store them. Sometimes, suppliers give limited-time discounts; and companies choose to "stock up" on necessary materials or services while they're cheap. Additionally, placing orders typically results in fixed costs that don't vary with the number of units purchased -- larger order quantities spread these fixed order costs out among more units. - Improving Customer Service:
Quick service and availability are core aspects of customer satisfaction. Maintaining adequate inventory ensures customers receive what they expect when they expect it.
Throughout this chapter, we'll follow the story of Jordan, a new operations manager at Fortune's Favorite Coffee, a popular local coffee shop. Jordan's first challenge is improving the shop’s inventory practices. The coffee shop has been struggling with periodic shortages and occasional waste from unsold baked goods, creating frustrated customers and increased costs.
As you follow Jordan's journey, you'll discover the practical importance of inventory management, learn to balance inventory costs and service levels, visualize inventory fluctuations clearly, explore simple strategies for managing inventory, and gain insights into how inventory performance can be measured and improved through basic metrics.
Types of Inventory in Business
After his first busy week at Fortune's Favorite Coffee, Jordan decided to take a detailed inventory tour with Ana, the head barista who had been there since the shop opened. Ana knew the inventory inside and out, and Jordan hoped her expertise would help him get a clear picture of what exactly Fortune's Favorite Coffee kept in stock and why. Jordan hoped that together they would be able to optimize Fortune's business performance with respect to its inventory policies.
Ana began by walking Jordan through the neatly organized storage area in the back of the shop. She explained that even a small coffee shop like theirs held several different types of inventory, each serving a distinct purpose.
Raw Materials
“Raw materials,” Ana explained, pulling open a cabinet filled with bags of coffee beans, tea leaves, sugar, and milk cartons, “are all the items we use as basic inputs to create our final products. Without these ingredients, we couldn’t brew coffee, steam milk, or blend smoothies.”
Jordan nodded. It was clear that managing these raw materials carefully would be key to keeping Fortune's Favorite Coffee running smoothly -- after all, running out of coffee beans at a coffee shop was not an option.
Work-in-Process (WIP)
Moving toward the pastry prep area, Ana gestured at a tray of partially-prepared breakfast sandwiches. "These sandwiches have been assembled, but they’re not baked yet," she said. “This is what we call ‘Work-in-Process’ inventory -- products we’ve started making but haven’t yet finished. It’s important to manage these carefully because we don't want too many prepped sandwiches that might go stale before we bake them.”
Jordan made a mental note: controlling WIP meant carefully matching preparation to expected sales.
Finished Goods
Next, they arrived at the front counter, with a glass display case filled with neatly arranged pastries, muffins, bagels, and sandwiches. Ana smiled. “These are our finished goods. They’re ready for customers to buy immediately. Having the right amount available is critical. Too few, and we’ll disappoint customers. Too many, and we’ll end up throwing away perfectly good food.”
Jordan realized immediately how critical forecasting and balancing finished goods inventory would be to avoid waste while maintaining customer satisfaction.
Maintenance, Repair, and Operating Supplies (MRO)
Finally, Ana guided Jordan toward the supply closet filled with cleaning agents, filters for coffee machines, paper towels, napkins, and other essentials that didn’t directly become part of the final product but were crucial for daily operations.
“This is what we call MRO inventory -- maintenance, repair, and operating supplies,” Ana explained. “It might not seem glamorous, but without these supplies, we couldn’t maintain hygiene, cleanliness, and the general upkeep of our equipment.”
Jordan recognized that overlooking these items could halt operations just as surely as running out of coffee beans.
Cycle Stock vs. Safety Stock
Ana then led Jordan to a neatly stacked corner of the storage room. "Here's another important distinction," she noted. "We order coffee beans every Monday morning -- enough to last exactly one week. That's our cycle stock, which we expect to use up by the next delivery."
She pointed to another smaller stack of bags nearby. "This extra supply is our safety stock. It’s here as a buffer in case deliveries are delayed or demand is unexpectedly high. Think of it as our insurance policy against uncertainty."
Jordan found himself reflecting on how each type of inventory played a crucial, distinct role. Balancing these effectively would be essential for operational efficiency, cost control, and ensuring that every customer walking into Fortune's Favorite Coffee would leave happy.
With these insights, Jordan was eager to dive deeper into managing inventory strategically, equipped with the knowledge of exactly what kinds of inventory Fortune's Favorite Coffee held and how they impacted daily operations.
Inventory Costs and Service Level Trade-offs
As Jordan settled into his role as operations manager at Fortune's Favorite Coffee, he started getting more and more experience with the delicate balancing act between inventory costs and customer service levels. One morning, while reviewing the shop’s monthly expenses, he noticed inventory costs seemed higher than he expected. Curious, Jordan scheduled a meeting with Ana to discuss how Fortune's Favorite Coffee estimated inventory costs -- and what they might do to improve.
Over coffee, Jordan asked, “Ana, our inventory spending seems quite high. Can you walk me through the main costs we’re dealing with?”
Ana nodded, pulling out her tablet. "There are a few key inventory-related costs we always keep an eye on," she began.
Costs Associated with Inventory
Ordering or Setup Costs
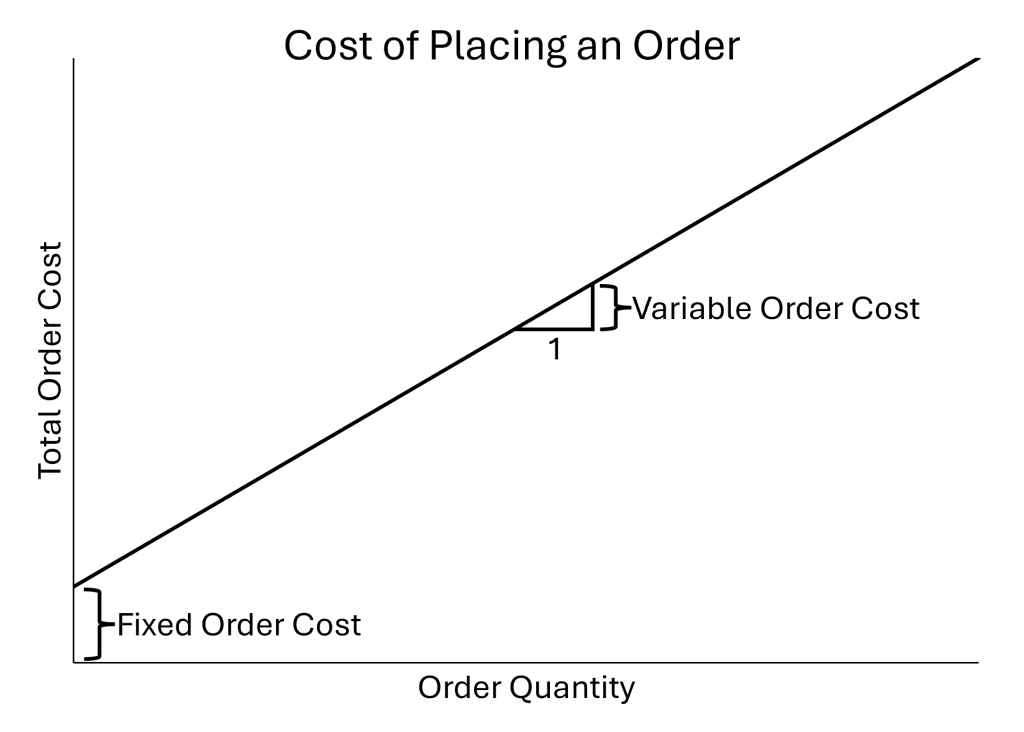
“Every time we order supplies -- coffee beans, pastries, cups, napkins -- we pay for the items AND we incur ordering costs. It might not seem like much, but the time spent placing orders, inspecting deliveries, and stocking shelves adds up,” Ana explained. "So every time we place an order for any item, we end up paying some costs regardless of the number of units we order. These are called fixed order costs and can be thought of as all of the costs we would incur if we purchased zero units from the supplier. We also have variable order costs that scale with the number of units ordered. Typically, the actual purchase cost is the dominant contributor to this cost. So the total cost for placing an order is the total of the fixed order cost and the product of the variable order cost and the quantity purchased in the order."
Jordan noticed a familiar math relationship and mental image representing the total order cost:
[latex]\text{Total Order Cost} = \text{Fixed Order Cost} + \text{Variable Order Cost} \cdot \text{Order Quantity}[/latex]
It took Jordan a few minutes to process this, but he eventually realized that there are economies of scale with order quantity: the higher the order quantity, the lower the purchase cost per unit. Jordan realized that frequent, small orders might be costing them more annually than fewer, larger orders. This was a good way to think about the purchase cost: annual order cost. Jordan realized that a simple math expression could capture this annual order cost quite well:
[latex]\begin{align*} \text{Annual Order Cost} & = \text{Total Order Cost (per order)} \cdot \text{Number of orders per year} \\ & = \text{Total Order Cost (per order)} \cdot \frac{\text{Annual Demand}}{\text{Order Quantity}} \\ & = \frac{\text{Fixed Order Cost (per order)} \cdot \text{Annual Demand}}{\text{Order Quantity}} + \text{Variable Order Cost} \cdot \text{Annual Demand} \end{align*}[/latex]
Having the number of orders per year equal the annual demand divided by the order quantity basically meant that the same annual demand was being split up evenly into a certain number of orders. So, regardless of the order quantity, the annual demand would be completely satisfied -- the only thing that would change would be the number of orders that would need to be placed to satisfy the annual demand.

Now Jordan could clearly see that the annual order cost is lower for higher order quantities.
Holding (Carrying) Costs
Ana continued, “Then we have holding costs -- expenses associated with storing inventory. Think about rent for storage space, refrigeration costs, and even wasted products that expire or go stale.”
She gestured to the pastry display case. "Every muffin or croissant we don't sell today becomes wasted inventory. And coffee beans that sit too long lose freshness and value.”
Jordan saw how critical it was to manage inventory carefully -- holding too much could quickly erode profitability.
Again, Jordan realized that a simple math expression could capture this cost:
[latex]\begin{align*}\text{Annual Holding Cost} &= \text{Unit Holding Cost} \cdot \text{Average Inventory} \\ &= \text{Purchase Cost} \cdot \text{Holding Cost Rate} \cdot \text{Average Inventory} \end{align*}[/latex]
Jordan imagined inventory changing over time with orders arriving and then inventory being depleted as orders came in. Jordan realized that the average inventory was closely related to the order quantity: if they placed orders and wait for the inventory to be nearly depleted before the next order arrives, the average inventory was about equal to one half of the order quantity. The chart below captures the image Jordan had in his head.

So the expression to describe the annual holding cost would become:
[latex]\text{Annual Holding Cost} = \text{Purchase Cost} \cdot \text{Holding Cost Rate} \cdot \frac{\text{Order Quantity}}{2}[/latex]

Stockout Costs
“And finally, there's the cost of running out -- what we call stockout costs,” Ana continued. “If a customer comes in for their favorite muffin and we're sold out, they might leave disappointed or even choose another coffee shop next time. Furthermore, if the customer buys less than they would have without a stockout, we experience the cost of lost sales. The avoidance of these stockout costs can almost be seen as a synonym for customer service.”
Jordan knew this was crucial. Losing customer loyalty due to stockouts had serious long-term implications for success at Fortune's Favorite Coffee. On top of that, every item stocked out presents the possibility of missing out on possible profits.
Balancing Inventory Costs
"How do we find the sweet spot between these costs?" Jordan asked.
Ana smiled. “Let's consider all of the trade-offs. Higher inventory levels increase holding costs but reduce stockout and ordering costs. Conversely, lower inventory levels reduce holding costs but increase the stockout and ordering costs.”
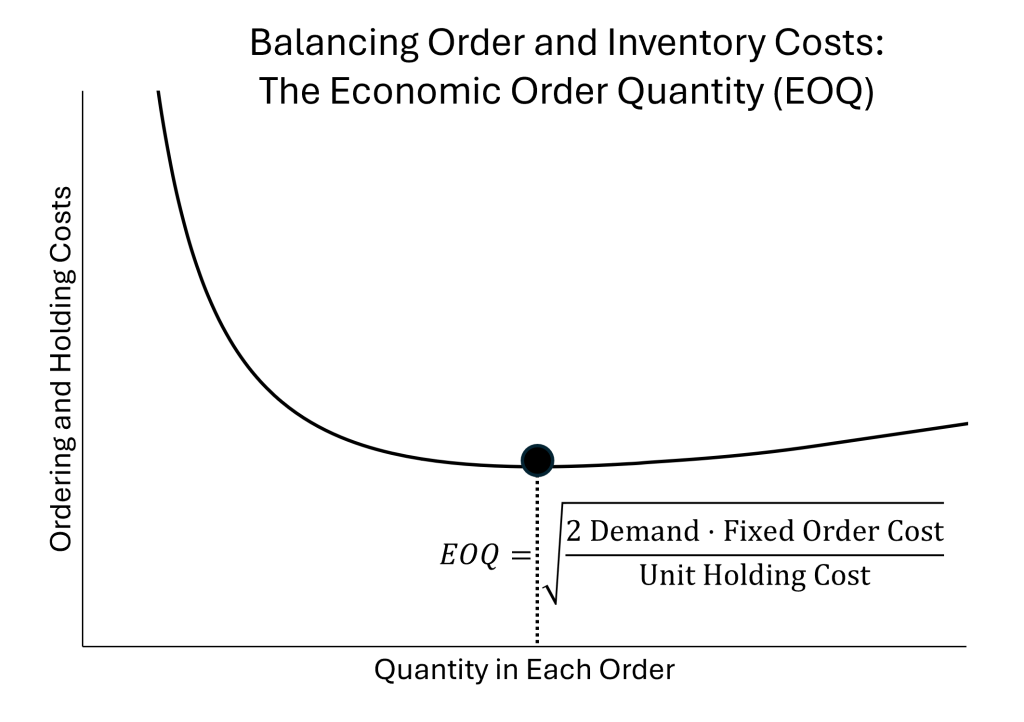
Ana continued, "Maybe the first trade-off we consider is the balance of holding costs and the ordering costs. We don't want either cost to be too high, so why not minimize the sum of the two costs." Ana did some searching on the internet and found that balancing these costs is a common approach and leads to something called the 'Economic Order Quantity.' "Look at this," she told Jordan. "It's called the Economic Order Quantity, or the EOQ. At the economic order quantity, the annual holding costs are perfectly balanced with the ordering costs. It looks like the economic order quantity relies on several assumptions that are not typically perfectly true; but it gives a really good estimate of the quantity to order to get the right inventory levels to balance holding costs and ordering costs. Here's the formula that gives the Economic Order Quantity."
[latex]\text{Economic Order Quantity} = \sqrt{\frac{2\cdot \text{Annual Demand} \cdot \text{Fixed Order Cost}}{\text{Annual Unit Holding Cost}}}[/latex]
While Jordan was relieved that they figured out how to effectively balance inventory and ordering costs, he was worried that neither the inventory nor the ordering costs seemed directly tied to customer service. He turned to Ana, "Ana, this EOQ number is great, but what about the stockout costs? What about the cost of missing out on sales, the cost of negative customer reviews, and the cost of lost customer loyalty?"
"Right," Ana said. "We need to include that as well." She thought a minute. "I got it! Let's use the EOQ for the cycle stock. Then we'll use the stockout costs when we try to figure out the right amount of safety stock."
"Great idea," Jordan replied. He thought about the relationship between customer service and safety stock levels.
- High Safety Stock Inventory Levels → Higher customer satisfaction (lower stockout costs), but higher holding costs.
- Low Safety Stock Inventory Levels → Lower holding costs, but risk dissatisfied customers (higher stockout costs).
Jordan considered the company's recent customer feedback. “So our job is to find the safety stock inventory level that keeps customers happy without breaking the budget,” he summarized.
Ana nodded, adding, “Exactly! We need enough inventory to meet expected demand, plus a bit of safety stock as a cushion.”
"Well," Jordan thought out loud, "if we add one additional unit to the safety stock and need it, we avoid the stockout cost for that unit. If we have that additional unit in the safety stock and don't need it, we have to pay the inventory cost if we can store it, and if we can store it then it's one less unit we'll have to buy next order cycle. But if we add that one additional unit to the safety stock level, then we have to pay for it, regardless of whether we need it or not."
Jordan and Ana both continued thinking. "The answer to this problem doesn't seem as easy as the others. Let's just say that we probably need to increase our safety stock levels because our stockout costs seem to be much higher right now than our holding costs on the safety stock. Let's try to get these in balance based on our perception of customer satisfaction."
Even though they hadn't figured out the perfect safety stock answer, Jordan felt good about their path forward. He realized inventory management wasn't just a set of equations -- it was about strategically choosing inventory levels to optimize costs and ensure customers consistently enjoyed their Fortune's Favorite Coffee experience.
Visualizing Inventory Levels
Motivated by his recent discussion with Ana, Jordan decided that understanding and visualizing the company’s inventory fluctuations was the next crucial step in improving the shop's inventory management practices. Jordan remembered the inventory data logs Ana had shown him. They were thorough, but hard to interpret as raw numbers. He needed a simpler way to visualize inventory levels clearly -- something that could tell an intuitive story at a glance.
Inventory Level Graphs
That afternoon, Jordan pulled together data for the company’s coffee bean inventory over the past month. Using basic spreadsheet software, he plotted the daily inventory level on a simple line graph.
Immediately, patterns became clear. Jordan saw a recurring “saw-tooth” shape:
- Inventory spiked on Monday mornings when a new shipment arrived.
- Inventory steadily declined throughout the week as beans were used.
- By Sunday afternoon, levels were always at their lowest, right before the next order arrived.

Seeing the inventory data visually made the weekly cycle clear. Jordan could now easily pinpoint days when inventory was dangerously low and when there might be excess stock sitting idle. He felt more confident identifying problems and potential improvements by simply glancing at the graph.
Understanding Lead Time
Jordan paid particular attention to another dimension of his visualization: supplier lead time. He remembered Ana mentioning that their coffee supplier typically required that orders be placed on Friday morning at the latest and that orders would typically be delivered Monday morning.
Suddenly, the reason behind their "safety stock" became crystal clear to Jordan. If they didn't have sufficient safety stock, the shop risked running out entirely -- resulting in lost sales and unhappy customers. Furthermore, they wouldn't be able to get coffee beans back in stock until Monday morning. And if the supplier had some disruption and was late in delivery, Fortune's Favorite Coffee could be unable to serve customers for days.
With this insight, Jordan recognized the critical importance of accurately tracking lead time. Properly visualizing lead time alongside inventory levels provided clarity about when Fortune's Favorite Coffee needed to reorder to avoid stockouts.
Simple Strategies for Inventory Management
Armed with the insights they had acquired already, Jordan felt ready to implement practical, straightforward inventory strategies at Fortune's Favorite Coffee. He realized the shop didn't need overly complicated methods -- just simple, effective techniques everyone could understand and follow consistently.
During their next weekly meeting, Jordan outlined four easy-to-implement strategies he believed would greatly improve the company’s inventory management practices.
Continuous Review System (Q-system)
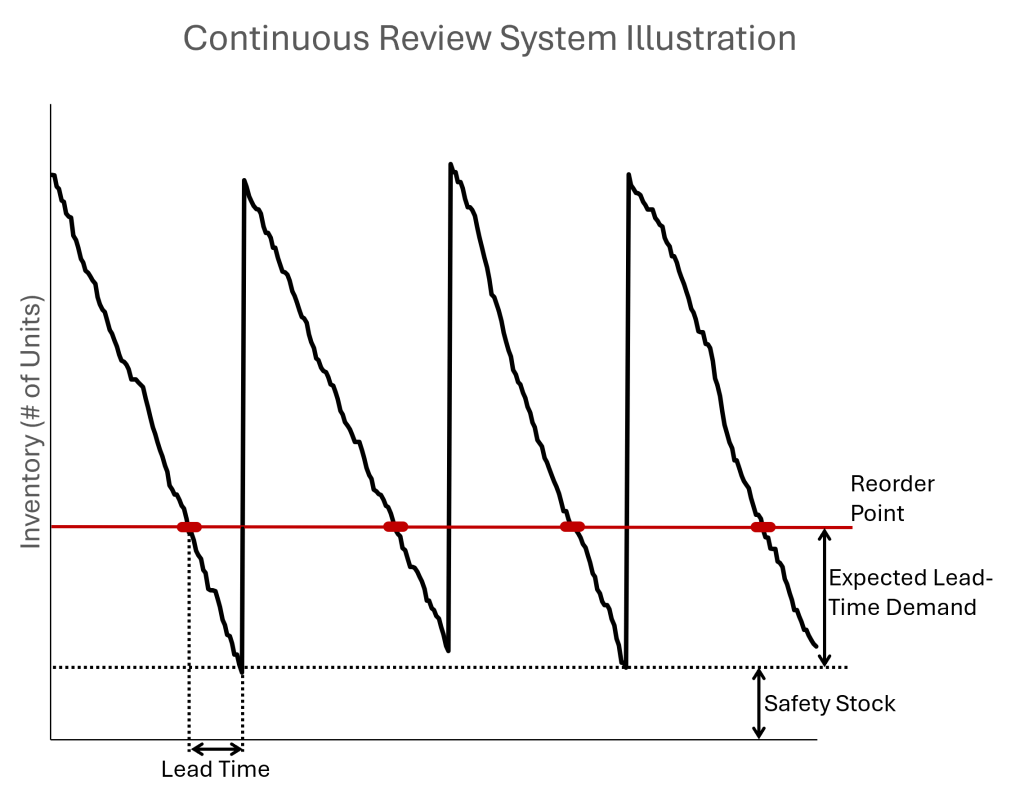
"First," Jordan began, "we should consider using what's called a Continuous Review system (or Q-system). It’s simple: we continuously track our inventory, and whenever the quantity of an item drops below a certain level -- what we'll call our reorder point (or our ROP) -- we immediately place a new order."
Ana quickly grasped the idea. "So, if we usually reorder coffee beans when we have four bags left, every time we drop to that level, we automatically order another shipment?"
"Exactly," Jordan confirmed. "This helps ensure we never run out of essential items because we're constantly monitoring and responding quickly when inventory gets low. However, our coffee bean supplier insists on deliveries only coming Monday morning with orders being placed Friday morning at the latest. They said they needed to maintain this schedule so they could make sure all of their customers have access to affordable, reliable service. So we should use a continuous review system for all critical supplies for which the supplier allows orders at any point in time."
Jordan continued, "With the continuous review system, the reorder point should equal the demand that we expect while waiting for an order to be delivered (called the lead time demand) plus the safety stock. Thinking about the reorder point in this way should help us decide the inventory level we should set as our reorder point for each item under a continuous review strategy." Jordan continued, "A decent way for us to decide the quantity of an item to include in each order is to use the economic order quantity, or EOQ, equation."
The team agreed that implementing a Q-system for their critical items like milk could be an immediate win. Jordan showed the team the step-by-step video and visualization below that helped them understand the continuous review strategy. Jordan emphasized, "In the step-by-step video and in the illustration, you can see that each block of time between consecutive order arrivals is different. Sometimes, there are several good days in a row; but if we only order once a week, a string of several consecutive good days can cause a string of several days of stockouts. With the continuous review system, we avoid this risk altogether."
Periodic Review System (P-system)
"But what about items like pastries and muffins?" Ana asked. "We bake or order those daily or every few days. And what about the items like coffee beans that have a set schedule?"
"That's a great example of when to use a Periodic Review system (or P-system)," Jordan replied. "Instead of constantly monitoring, we set regular intervals -- say, every day or every three days -- when we review inventory and replenish accordingly. It’s efficient for items with predictable usage or short shelf lives."
Ana nodded. "That would streamline our pastry ordering -- reducing waste and ensuring freshness."
Jordan replied, "For this strategy, we do what we can to start each period with the same inventory; so if we have more leftovers from the previous period, then we order fewer units for the next period. We can think about this as having an order-up-to level -- whenever we place an order, we order the quantity that is the difference between the order-up-to level and our current inventory. Look at this step-by-step video and chart below that illustrate it."

Jordan continued, "With the periodic review system, we have to set the order-up-to level. To get the order-up-to level, we simply add the expected cycle demand, the expected lead-time demand, and the safety stock."
ABC Inventory Management
Jordan continued, "We can further simplify inventory control using ABC inventory management. This approach classifies inventory based on importance and value. Our highest-value or most critical items -- category ‘A’ -- get the most attention. Less important items -- categories ‘B’ and ‘C’ -- can be managed more lightly."
He gave an example: “Coffee beans would definitely be category ‘A.’ We’ll track them daily. Pastries and fresh produce might be ‘B,’ reviewed regularly but not daily. Category ‘C’ might include napkins or stir sticks -- important but inexpensive and not worth constant attention.”
Ana smiled. "That makes perfect sense. It’ll help us focus our attention on the items that matter most."
Just-in-Time (JIT) Inventory
"Finally," Jordan said, "we might explore Just-in-Time, or JIT, inventory. The idea is that we synchronize inventory arrivals as closely as possible with when we need them. This reduces storage and waste. For example, we could order pastries so they arrive fresh every morning, just before opening."
Ana thought carefully. "That sounds ideal -- especially for perishable items -- but it does require reliable suppliers."
Jordan nodded. "Exactly. It’s effective, but only when we trust suppliers to deliver exactly when needed. For now, maybe we start by experimenting with pastries and baked goods and expand from there."
Implementing the Strategies
The Fortune's Favorite Coffee team enthusiastically discussed Jordan’s proposals, clearly seeing the practical benefits. By adopting these simple strategies -- continuous review for essentials, periodic review for perishables, ABC management for prioritization, and just-in-time ordering to reduce waste -- they could greatly improve inventory efficiency without becoming bogged down in complexity.
Jordan left the meeting energized. With these intuitive inventory management practices, he was confident that Fortune's Favorite Coffee would be better positioned to control costs, minimize waste, and consistently delight customers -- all while making daily operations smoother for the entire team.
Basic Metrics for Inventory Performance
With the company’s new inventory strategies in place, Jordan’s next step was clear: He needed straightforward, easy-to-understand metrics to evaluate how well their new inventory management system was performing. Jordan knew intuitively that to improve something, you first had to measure it -- and measuring inventory didn’t have to be complicated. Many of Jordan's metrics were inspired by the famous Little's Law:
[latex]\text{Average Inventory} = \text{Average Throughput Rate} \cdot \text{Average Time}[/latex]
or
[latex]I = R \cdot T[/latex]
During another productive meeting with Ana, Jordan introduced four basic metrics that he believed would help Fortune's Favorite Coffee manage inventory more effectively.
Inventory Turnover Ratio
"First," Jordan began, "let's look at Inventory Turnover. It tells us how often we use up and replace our inventory within a given period -- usually a month or year."
Ana seemed intrigued. "So, a higher turnover means we're using our inventory efficiently?"
"Exactly," Jordan explained. "If we go through coffee beans very quickly -- selling lots of coffee each month -- that’s good news. Low turnover would mean we have too much inventory sitting around unused."
Jordan showed a simple calculation:
[latex]\text{Inventory Turnover} = \frac{\text{Cost of Goods Sold (COGS)}}{\text{Average Inventory}}[/latex]
"At Fortune's Favorite Coffee, if our average monthly inventory cost is $3,000 and we sell $12,000 worth of goods monthly, our turnover is 4, meaning we're replenishing inventory about four times each month."
Ana quickly saw how this metric provided clarity and insight into their efficiency.
Days of Supply
Next, Jordan explained Days of Supply. "This tells us how many days our current inventory would last if we didn’t replenish it."
Ana nodded thoughtfully. Jordan continued, "It helps us understand inventory in terms of days instead of just dollar amounts."
Jordan showed her a straightforward example calculation:
[latex]\text{Days of Supply} = \frac{\text{Average Inventory}}{\text{Daily Usage}}[/latex]
"If we have 50 pounds of coffee beans on hand and we use about 10 pounds each day, we have about 5 days of supply," Jordan explained. "If that number suddenly increases or decreases, we know something has changed -- either we’re ordering too much or too little."
Ana smiled. “This will be really helpful to see quickly if we’re carrying the right amount.”
Fill Rate
"Fill rate measures our ability to fulfill customer requests," Jordan said next. "It’s essentially a measure of customer satisfaction related to our inventory management."
Jordan explained the intuitive concept:
[latex]\text{Fill Rate} = \frac{\text{Number of Customer Orders Fulfilled}}{\text{Total Customer Orders Received}}[/latex]
"If we get 100 orders for blueberry muffins in a day but we can only fulfill 90, our fill rate for muffins is 90%," Jordan explained. "A high fill rate means happier customers."
Ana nodded enthusiastically, quickly understanding how monitoring this number would directly connect inventory decisions with customer experiences.
Stockout Frequency
Finally, Jordan turned to Stockout Frequency. "This one is simple -- it measures how often we run out of a particular item."
"Every time we experience a stockout, we track it," Jordan explained. "If we run out of almond milk twice in a month, that’s two stockouts. Over time, we’ll learn what items are problematic, allowing us to adjust our ordering and safety stock levels accordingly."
Ana immediately saw how this would help Fortune's Favorite Coffee stay proactive, keeping their customers happy and their operations smooth.
Example Application of Inventory Metrics
To demonstrate these metrics in action, Jordan walked Ana through a scenario from the previous week. Fortune's Favorite Coffee had faced a surprising shortage of breakfast sandwiches, causing disappointment among customers. Jordan quickly analyzed the metrics:
- Inventory Turnover: Revealed the sandwiches had higher demand than initially planned, turning over rapidly.
- Days of Supply: Showed their planned inventory lasted fewer days than expected, indicating underestimated demand.
- Fill Rate: Dropped sharply, highlighting immediate customer dissatisfaction.
- Stockout Frequency: Increased, confirming a need to adjust inventory upward.
Ana was impressed. "These metrics clearly show exactly where the problem was -- underestimating sandwich demand -- and they’ll guide us to prevent similar issues in the future," she observed.
Jordan felt confident. These simple, intuitive metrics offered Fortune's Favorite Coffee a clear, easy way to measure and continuously improve inventory management, translating directly into better service, lower costs, and happier customers.
Chapter Summary
Over the past weeks, Jordan’s journey as operations manager at Fortune's Favorite Coffee highlighted just how important effective inventory management is -- not only for controlling costs, but also for ensuring customer satisfaction and smooth daily operations. Through collaboration, strategic planning, and practical application of inventory concepts, Jordan successfully introduced practices that transformed the company’s approach to inventory.
Key Takeaways:
- Purpose of Inventory: Inventory serves essential functions such as buffering against uncertainty, ensuring smooth operations, leveraging economic purchases, and maintaining customer satisfaction.
- Types of Inventory: Businesses typically handle raw materials, work-in-process, finished goods, and MRO supplies, each with unique management challenges and purposes.
- Cost and Service Level Trade-offs: Effective inventory management requires balancing holding costs, ordering costs, and stockout costs. High inventory reduces stockouts but raises costs, whereas lower inventory reduces costs but risks customer dissatisfaction.
- Inventory Visualization: Simple visual tools, like inventory-level graphs, clearly illustrate fluctuations, reorder points, and the importance of managing lead times and safety stock.
- Simple Inventory Strategies: Approaches such as Continuous Review (Q-system), Periodic Review (P-system), ABC analysis, and Just-in-Time (JIT) can streamline inventory management by prioritizing attention and simplifying decision-making.
- Basic Inventory Metrics: Intuitive metrics like Inventory Turnover, Days of Supply, Fill Rate, and Stockout Frequency enable businesses to quickly and clearly assess inventory performance and identify improvement opportunities.
Concluding Jordan’s Journey at Fortune's Favorite Coffee
Several months after introducing these inventory strategies, Jordan and Ana sat down together to review the company’s recent performance. Inventory turnover was significantly higher, reflecting efficient use of supplies. Days of supply metrics were stable, and customer fill rates had improved dramatically, translating directly into more satisfied customers.
As they reviewed the weekly reports, Jordan smiled. “I can't believe how much easier managing inventory has become. The whole team feels empowered knowing exactly what we have, what we need, and when to order.”
Ana agreed enthusiastically. “And customers have noticed too -- they can always count on their favorite items being available. Inventory might seem like a behind-the-scenes thing, but it's made a visible difference out front.”
Jordan realized that while inventory management initially seemed overwhelming, the practical approaches, visual tools, and simple metrics he'd implemented were now embedded into the company’s culture, leading to smoother operations, reduced costs, and happy customers. He knew the strategies would help Fortune's Favorite Coffee thrive for years to come.
Jordan’s efforts demonstrated how clear, practical inventory management strategies not only enhance internal efficiency but also directly elevate customer experience. Equipped with this knowledge, any organization -- big or small -- can effectively manage their inventory, balancing costs and delighting customers, just as Jordan and his team did at Fortune's Favorite Coffee.
Media Attributions
- Total Order Cost, Function of Order Quantity © Evan Barlow is licensed under a CC BY-NC-ND (Attribution NonCommercial NoDerivatives) license
- Annual Order Cost, Function of Order Quantity © Evan Barlow is licensed under a CC BY-NC-ND (Attribution NonCommercial NoDerivatives) license
- Average Inventory Illustrated © Evan Barlow is licensed under a CC BY-NC-ND (Attribution NonCommercial NoDerivatives) license
- Annual Holding Cost, Function of Order Quantity © Evan Barlow is licensed under a CC BY-NC-ND (Attribution NonCommercial NoDerivatives) license
- Order and Holding Cost, Function of Order Quantity, EOQ © Evan Barlow is licensed under a CC BY-NC-ND (Attribution NonCommercial NoDerivatives) license
- Inventory Level Diagram © Evan Barlow is licensed under a CC BY-NC-ND (Attribution NonCommercial NoDerivatives) license
- Continuous Review Illustration © Evan Barlow is licensed under a CC BY-NC-ND (Attribution NonCommercial NoDerivatives) license
- Periodic Review Illustration © Evan Barlow is licensed under a CC BY-NC-ND (Attribution NonCommercial NoDerivatives) license
