12 Creating Quality for the Customer
Quality Management
Evan Barlow and Shane Schvaneveldt
Learning Objectives
After completing this chapter, you will be able to:
- Define quality from three perspectives—product-based quality (grade and features), process-based quality (conformance and consistency), and customer-based quality (meeting expectations)—and explain how they combine to drive business performance
- Describe how quality functions as an integrated organizational system requiring collaboration across all business functions from top management to operations
- Understand the principle of “blame the process, not the person” and explain why 80-85% of quality problems originate in systems and processes rather than front-line employees
- Use root cause analysis techniques to systematically identify underlying causes and prevent future defects
- Explain the concepts of process variation and conformance, including specifications, process capability, and the distinction between common cause and special cause variation
Part 1: The Crisis and Why Quality Matters
THE STORY: Monday Morning, 8:47 AM
Felicity Steele’s phone wouldn’t stop buzzing. She was 28 years old, six months into her first operations manager role at SterlingSound Technologies, and she was about to lose everything.
“Felicity, we need you in the executive conference room. Now.” Her boss’s voice was tight.
SterlingSound made premium noise-canceling Bluetooth earbuds—the kind college students saved for months to buy. The Elite Pro was their flagship model at $249. Three months ago, they’d shipped 50,000 units. Now, those earbuds were coming back.
Felicity walked into a war room. Chance Sterling, the CEO, stood at the head of the table. Next to him sat Rachel from Customer Service, Marcus from Engineering, Elena from Manufacturing, and Jordan from Supplier Quality.
“Tell her,” Chance said to Rachel.
Rachel pulled up a customer video on the screen. A college student held up a pair of Elite Pros. “I saved for three months for these. They’re completely dead after just 2 weeks.” The video had 2.3 million views.
“We’re seeing a 23% return rate,” Rachel said. “The earbuds are failing after just 40 to 60 hours of use.”
“How many units?” Felicity whispered.
“We’re facing $4.2 million in direct returns,” said Sarah from Finance. “Our highest-volume retailer canceled their spring order—that’s another $8 million in lost revenue. If we can’t fix this fast, we’re looking at lawsuits and complete brand destruction.”
Chance turned to Felicity. “You’re Operations. What happened?”
“I… I don’t know,” Felicity said. “Every test showed the units were perfect.”
“Well, something is very wrong,” Chance said. “You have seventy-two hours to figure out what went wrong, how to fix it, and how to ensure this never happens again. If we can’t, the board will insist we pull the entire product line to save the brand.”
THE CONCEPT: Why Quality Matters to Business Performance
Felicity’s crisis illustrates how quality directly impacts business performance through two pathways: growing or maintaining revenue and reducing cost.
Quality Drives Revenue
High quality from the customer perspective leads to:
- Customer satisfaction and loyalty: Satisfied customers return and recommend products to others
- Market share gains: Quality reputations attract customers from competitors
- Pricing power and premium pricing: Quality products command higher prices (e.g., Toyota vehicles retain value better than competitors, even in used car markets)
When quality fails, revenue collapses. SterlingSound faces $8 million in canceled orders plus immeasurable lost future sales as customers switch to competitors.
Quality Reduces Costs
High quality from the process perspective leads to:
- Less waste, rework, and scrap: First-time-right production eliminates do-overs
- Fewer defects and customer complaints: Reduces warranty costs and service calls
- Lower liability and legal costs: Prevents lawsuits from defective products
- Reduced returns: Saves on reverse logistics and refund costs
- Higher productivity: More output from same inputs when rework is eliminated
SterlingSound’s quality failure is costing $4.2 million in direct returns—money that went into production but generated zero revenue.
Quality = Profitability
The equation is simple: More revenue + Lower costs = Higher profits. Quality isn’t just a technical concern—it’s a fundamental driver of financial performance. Companies with superior quality enjoy competitive advantages that translate directly to the bottom line.
In today’s connected world, quality failures become public instantly. That viral video represents not just one angry customer, but millions of potential buyers now avoiding SterlingSound. In competitive markets, quality is often the only sustainable differentiator.
Part 2: Defining Quality—Three Perspectives
THE STORY: Monday, 10:15 AM
Felicity gathered her team. Rachel from Customer Service had analyzed returned units.
“Every failed unit has the same problem,” Rachel said, holding up a battery under magnification. “The battery’s internal protection circuit is failing. Look at these cracked solder joints and thin traces. These batteries aren’t built to our specification.”
Jordan from Supplier Quality went pale. “I certified those shipments. I sampled five units per batch and ran 2-hour burn-in tests. Everything passed.”
“But you didn’t verify they matched what we ordered,” Felicity said.
Marcus from Engineering protested. “I specified batteries with triple-redundant protection circuits. These clearly don’t have them.”
Felicity drew three sections on the whiteboard.
“We need to understand that quality has three different meanings, and we failed at all three,” she said.
“PRODUCT-BASED QUALITY”
“This is about the grade, features, and performance we designed into the product. Are we positioning this as a basic product or high-end deluxe? Think Toyota Corolla versus Lexus, or McDonald’s versus Ruth’s Chris Steakhouse.”
She pointed to the Elite Pro specifications on the screen. “We positioned the Elite Pro as premium: $249 price point, studio-quality sound, advanced noise cancellation, 8+ hour battery life. That’s high product-based quality—we’re competing at the Lexus level, not the Corolla level.”
“PROCESS-BASED QUALITY”
“This is about conformance—how consistently does our process create outputs that match specifications without defects or rework? Even a basic product like a Toyota Corolla or McDonald’s burger should have high process-based quality, meaning they consistently turn out exactly as designed, defect-free.”
She looked at Jordan. “Our process-based quality failed. We have a specification—batteries with triple-redundant protection circuits, 95mAh capacity, 500 charge cycles. What we actually built doesn’t conform to that specification. Our process isn’t producing what we designed.”
“CUSTOMER-BASED QUALITY”
“This is the ultimate measure: how well does the product satisfy customer expectations? Customer-based quality is determined by how well product-based quality—the grade and features—and process-based quality—consistent and defect-free—combine to meet customer needs.”
She pointed to the viral video still on the screen. “Our customer-based quality is disastrous. Students expected 8+ hours of battery life based on our premium positioning. They’re getting 40 hours total before complete failure. We failed to meet expectations, and that’s destroying our brand.”
“Here’s what matters,” Felicity continued. “All three types of quality must align. We got product-based quality right—great design, premium features. We failed at process-based quality—we didn’t build what we designed. And because of that process failure, our customer-based quality collapsed.”
THE CONCEPT: Three Perspectives on Quality
Quality professionals define quality in three complementary ways:
- Product-Based Quality: The Grade and Features
Product-based quality refers to the inherent characteristics designed into the product or service:
- Grade level (basic, mid-tier, premium, luxury)
- Features and performance specifications
- Materials and components used
- Design sophistication
Examples:
- Toyota Corolla (basic, reliable transportation) vs. Lexus (luxury, advanced features)
- McDonald’s (fast, convenient, affordable) vs. Ruth’s Chris Steakhouse (premium dining experience)
Product-based quality is a strategic positioning decision. There’s nothing wrong with being a Corolla or a McDonald’s—these are appropriate quality levels for their target markets. The key is being clear about your positioning.
- Process-Based Quality: Conformance and Consistency
Process-based quality measures how consistently the production process creates outputs that conform to specifications without defects or rework:
- Conformance: Does the output match the specification?
- Consistency: Does every unit turn out the same way?
- Defect-free: Is rework and scrap minimized?
A Toyota Corolla and a Lexus should both have high process-based quality—both should be manufactured consistently to their respective specifications, even though one specification is “basic reliable car” and the other is “luxury performance vehicle.”
- Customer-Based Quality: Meeting Expectations
Customer-based quality is the ultimate measure—how well does the product or service satisfy customer expectations in actual use?
Customer-based quality depends on both:
- Product-based quality: Are the grade and features appropriate for customer needs?
- Process-based quality: Is the product consistently defect-free?
If either fails, customer-based quality suffers. A premium-positioned product (high product-based quality) that fails after two weeks (poor process-based quality) destroys customer satisfaction. Similarly, a perfectly manufactured product (high process-based quality) with inadequate features for customer needs (poor product-based quality) also fails.
Why All Three Matter
Organizations must excel at all three:
- Strategic clarity (product-based): Know your market position
- Operational excellence (process-based): Build it right consistently
- Customer satisfaction (customer-based): Deliver on promises
SterlingSound’s crisis illustrates the interdependence: excellent product-based quality (premium design) was destroyed by poor process-based quality (non-conforming batteries), resulting in catastrophic customer-based quality failure.
Part 3: The Costs of Quality
THE STORY: Monday, 2:30 PM
Sarah from Finance opened her laptop. “I’ve categorized every dollar we’re spending because of this crisis into three categories—and they tell a story about prevention versus cure.”
“Prevention Costs: $425,000” “These are investments we made trying to prevent defects before production: $180,000 on initial supplier audits, $95,000 on design reviews and prototype testing, $150,000 on quality training for our production team.”
“Appraisal Costs: $395,000” “These are expenses for inspection and testing during production: $220,000 for inspectors to test every unit, $130,000 on testing equipment and calibration, $45,000 for outside lab certification.”
“Failure Costs: $17,175,000+” “Here’s where it gets ugly. Internal failures we caught before shipping cost us $175,000—scrapped units, reworked units, production downtime. But external failures—defects customers discovered—are costing us over $17 million: $4.2 million in returns, $8 million in canceled orders, $15-20 million in lost future sales, plus legal costs, crisis response, and brand damage.”
The room went silent.
“Let me put this in perspective,” Sarah said. “We spent $820,000 on prevention and appraisal. We’re now spending $17 million on failures. Failure costs are twenty times our prevention costs.”
She looked around the table. “There’s a concept called ‘Quality is Free.’ It means that every dollar invested in prevention saves multiple dollars in failure costs. We could have spent twice as much on prevention—$850,000 instead of $425,000—and still saved over $16 million if we’d caught this problem earlier.”
“An ounce of prevention is worth a pound of cure,” Felicity said quietly. “We skimped on the ounce and now we’re paying for the pound.”
THE CONCEPT: The Costs of Quality
The Cost of Quality framework reveals the true economics of quality management. All quality-related costs fall into three categories:
- Prevention Costs
Investments made to prevent defects from occurring in the first place:
- Quality planning and design reviews
- Supplier qualification and development
- Process planning and capability studies
- Employee training on quality procedures
- Preventive equipment maintenance
- Quality improvement projects
Prevention costs occur before production. They represent proactive investment in building quality into the system.
- Appraisal Costs
Expenses for measuring, inspecting, and testing to find defects:
- Inspection and testing of materials, work-in-process, and finished goods
- Testing equipment and calibration
- Quality audits and reviews
- Laboratory testing and certification
Appraisal costs occur during production. They represent reactive efforts to catch problems before shipping.
- Failure Costs
Costs of defects, divided into two subcategories:
Internal Failure Costs (caught before reaching customers):
- Scrap (defective materials that can’t be fixed)
- Rework (labor and materials to fix defects)
- Production downtime due to quality problems
- Re-inspection of reworked items
External Failure Costs (discovered by customers):
- Returns, refunds, and warranty claims
- Product recalls and replacements
- Liability lawsuits and legal settlements
- Lost sales from damaged reputation
- Customer complaint handling
- Brand recovery costs
Quality Is Free: The Prevention Principle
Philip Crosby’s famous principle “Quality Is Free” captures a critical insight: investing in prevention actually reduces total costs.
The relationship is exponential:
- $1 spent on prevention typically saves $10-100 in failure costs
- Prevention costs are small and predictable
- Failure costs are large and unpredictable
- External failure costs are catastrophic
Smart managers shift spending leftward—from failure costs to prevention costs. This simultaneously improves quality AND reduces total costs. That’s why quality is “free”—the investment more than pays for itself.
Strategic Implications
Many organizations underspend on prevention (trying to “save money”) and end up spending exponentially more on failures. SterlingSound spent $425,000 on prevention and is now paying $17 million in failures—a 40:1 ratio.
The lesson: “An ounce of prevention is worth a pound of cure.” Every additional dollar in prevention would have saved tens or hundreds of dollars in failures.
Part 4: Quality as an Organizational System
THE STORY: Monday, 4:45 PM
The tension exploded.
“This is Engineering’s fault!” Jordan said. “You specified batteries that were too expensive!”
“That’s garbage!” Marcus shot back. “If Manufacturing had actually inspected—”
“Don’t blame Manufacturing,” Elena interrupted. “We built exactly what we received!”
“ENOUGH!” Felicity’s voice cut through the argument. “Listen to yourselves. Engineering blames Purchasing. Purchasing blames Manufacturing. Manufacturing blames Engineering. Everyone’s pointing fingers.”
She drew boxes on the whiteboard labeled with all business functions: TOP MANAGEMENT, MARKETING, FINANCE, ENGINEERING, PURCHASING, LOGISTICS, OPERATIONS.
“Quality doesn’t come from one department,” Felicity said. “Quality is a system property that depends on how well all business functions work together.”
She pointed to each box:
“Top Management establishes strategic quality objectives and leads the organization’s quality culture. Chance, you and the executive team create the systems and processes we all work within. If those systems are flawed, we get flawed results.”
“Marketing understands customer needs and satisfaction. Rachel, you’re hearing from angry customers—their voice has to flow back to Engineering and Operations.”
“Finance understands the costs of poor quality and provides necessary budget to support quality objectives. Sarah, you just showed us that underspending on prevention costs us millions in failures.”
“Engineering designs products and processes that perform well. Marcus, you designed great specifications, but did you design them knowing Manufacturing’s capabilities?”
“Purchasing identifies and works with suppliers who support quality needs. Jordan, you certified suppliers, but were you given the resources and protocols to do it right?”
“Logistics delivers materials and products on-time and in the right condition. If materials arrive damaged or late, quality suffers.”
“Operations manages and improves the processes that create quality in products and services. Elena, you run a great production line, but only if you receive conforming inputs.”
She stepped back. “Do you see it? Quality originates in the process and system. It’s determined by how well all business functions work together. When we work in silos, gaps emerge. That’s where defects slip through.”
“But here’s the other key insight,” Felicity continued, looking at Jordan. “Jordan, you ran a 2-hour test and certified the batteries. Everyone’s blaming you. But did you design that test protocol?”
“No,” Jordan said quietly. “It was the standard protocol I inherited.”
“Exactly. We need to blame the process, not the person.” Felicity wrote it on the board. “Quality experts tell us that only 15-20% of quality problems originate with front-line workers. The other 80-85% are traced back to the processes and systems that management creates.”
She looked at Chance. “This wasn’t Jordan’s failure. This was a system failure. Jordan followed procedures. The procedures were inadequate. And that’s on management—including me—to fix.”
“From now on,” Felicity said, “we work as one system. Top management takes responsibility for creating quality systems. All departments collaborate. Front-line employees are empowered to identify problems. And when problems occur, our first reaction is to examine the process, not blame the person.”
THE CONCEPT: Quality as an Integrated Organizational System
Modern quality management recognizes that quality is not the responsibility of a single department—it’s a system property that emerges from how well all organizational functions work together.
Quality Requires Total Organization Involvement
Every business function contributes to quality:
Top Management:
- Establishes strategic quality objectives
- Leads the organization’s quality culture
- Provides resources and removes barriers
- Creates the systems and processes that determine quality
Marketing:
- Understands customer needs and expectations
- Measures customer satisfaction
- Communicates customer voice throughout organization
Finance/Accounting:
- Analyzes costs of poor quality
- Provides budgets to support quality objectives
- Tracks quality’s financial impact
Engineering:
- Designs products that meet customer needs
- Designs processes capable of producing quality products
- Collaborates with other functions on quality requirements
Purchasing:
- Identifies suppliers who can support quality needs
- Develops supplier capabilities
- Ensures incoming materials meet specifications
Logistics:
- Delivers materials and products on-time and undamaged
- Maintains proper storage and handling conditions
- Ensures supply chain quality
Operations:
- Manages daily processes that create quality
- Identifies and solves quality problems
- Continuously improves processes
The Integration Principle
Quality doesn’t happen in functional silos. It requires:
- Cross-functional collaboration: All departments working together toward common quality goals
- Systems thinking: Understanding how functions interdepend
- Shared accountability: Quality is everyone’s responsibility
- Information flow: Customer feedback, process data, and supplier information flowing freely across functions
Top Management Responsibility
While quality is everyone’s responsibility, ultimate accountability rests with top management because:
- Management creates the systems and processes
- Management allocates resources
- Management establishes priorities and culture
- Management has authority to break down silos and drive change
Quality performance depends on the systems management creates. Front-line employees work within those systems but typically cannot change them independently.
Blame the Process, Not the Person
This principle recognizes a crucial fact: Most quality problems originate in systems, not individuals.
Research and experience consistently show:
- 15-20% of quality problems trace to front-line worker actions
- 80-85% of quality problems trace to processes, systems, and management decisions
When quality problems occur, managers should:
- First examine the process and system
- Ask: “What about our system allowed this problem?”
- Fix the system, not just the symptom
- Avoid blaming individuals following flawed procedures
This doesn’t mean individuals are never responsible—it means the system is the more likely culprit and should be investigated first.
Why This Matters
Organizations that blame individuals for system failures:
- Don’t fix root causes
- Create fear that prevents problem reporting
- Miss opportunities for system improvement
- Suffer recurring problems
Organizations that fix systems:
- Prevent future problems
- Encourage employee involvement in improvement
- Build cultures of continuous improvement
- Achieve lasting quality gains
SterlingSound’s crisis wasn’t Jordan’s failure—it was a system failure in testing protocols, resource allocation, and cross-functional communication. Fixing the system will prevent similar problems across all suppliers and components.
Part 5: Pareto Analysis—Finding the Vital Few
THE STORY: Tuesday, 9:00 AM
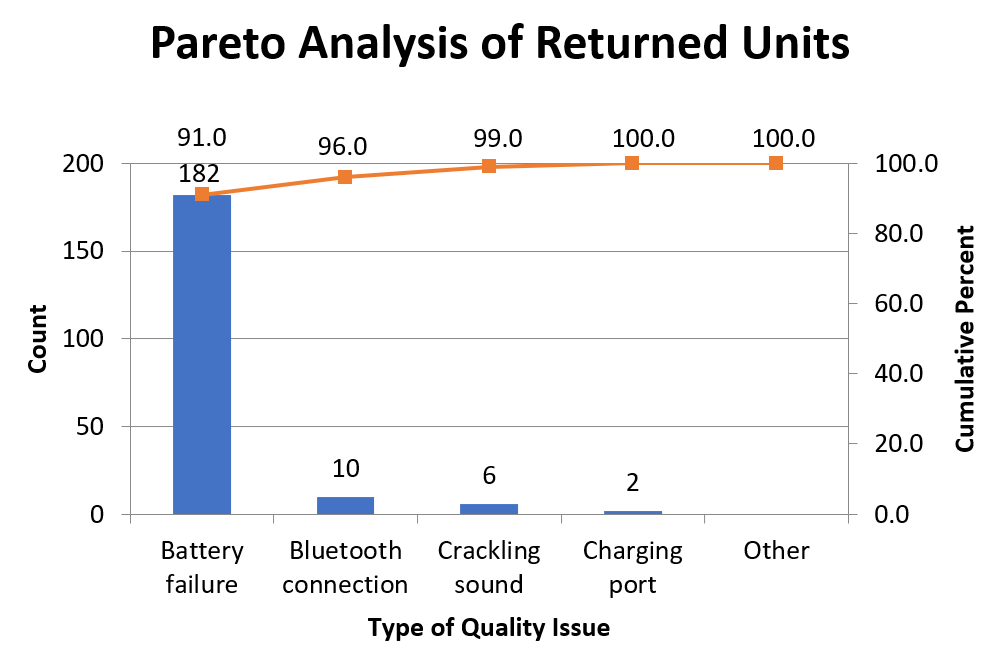
Rachel presented analysis of 200 returned units:
Battery failure: 182 units (91%)
Bluetooth connection drops: 10 units (4%)
Crackling sound: 6 units (3%)
Charging port issues: 2 units (1%)
Other defects: 0 units (<1%)
Felicity drew a Pareto chart showing descending bars with a cumulative percentage line climbing steeply.
“This Pareto Chart shows we don’t have five problems—we have ONE that matters: battery failure at 92% of all returns. This is the 80-20 rule: roughly 80% of problems come from 20% of causes. Here it’s even more extreme.”
“We have 48 hours left,” Felicity said. “If we chase all five problems, we solve none. But if we focus all our energy on battery failure—the ‘vital few’ versus the ‘trivial many’—we can actually fix the crisis.”
“Pareto analysis is about strategic focus: putting limited resources where they’ll have the biggest impact.”
THE CONCEPT: Pareto Analysis and the Vital Few
Pareto Analysis applies the principle that a small number of causes typically account for the majority of problems. Named after economist Vilfredo Pareto, this is often simplified as the 80-20 Rule:
- 80% of defects come from 20% of defect types
- 80% of complaints come from 20% of issues
- 80% of costs come from 20% of problem sources
The exact ratio varies, but the pattern is remarkably consistent: a vital few causes matter enormously, while many others matter little.
The Pareto Chart
A Pareto chart visualizes this principle:
- Bars show categories (defect types, problems) from highest to lowest frequency
- Line shows cumulative percentage, revealing how quickly you capture the total
The chart makes the vital few visually obvious. In SterlingSound’s case, battery failure towers over everything else at 92%—an unmistakable signal to focus there. Below is a generic Pareto chart for illustration purposes.
Why This Matters for Managers
Pareto analysis is fundamentally about resource allocation under constraints:
Limited Time and Money: Organizations can’t fix everything simultaneously. Focus on what matters most.
Maximum Impact: Solving one vital problem often has more impact than solving ten trivial ones.
Avoiding Diffusion: Spreading effort thinly across many problems usually means solving none of them well.
Strategic Prioritization: Fix the vital few first, measure results, then reassess. Quality management is about improvement, not perfection.
How to Apply
- Collect data on defects, complaints, or problems
- Categorize into meaningful groups
- Count frequency and calculate percentages
- Sort from highest to lowest
- Calculate cumulative percentage
- Identify vital few (usually 1-3 categories accounting for 70-90% of problems)
- Focus resources on the vital few
Cautions
Pareto analysis doesn’t mean ignore everything else. Low-frequency problems might:
- Have severe consequences (safety, legal liability)
- Be easy quick wins
- Signal emerging trends
But as a general principle: the vital few should get the vast majority of attention, especially in crisis response.
Part 6: Root Cause Analysis
THE STORY: Tuesday, 11:30 AM
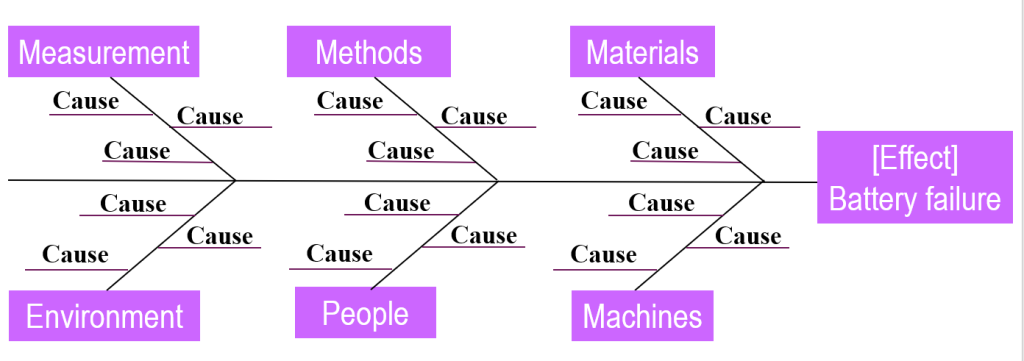
Felicity drew a fishbone diagram—a horizontal line with diagonal branches labeled “MATERIALS,” “METHODS,” “MACHINES,” “PEOPLE,” “ENVIRONMENT,” and “MEASUREMENT.”
“This Fishbone Diagram helps us brainstorm every possible cause systematically,” Felicity explained. The team filled branches: wrong battery spec, counterfeit components, inadequate testing, assembly errors, equipment problems, insufficient training, environmental conditions, short test duration.
“Now we drill down with the 5 Whys,” Felicity said, writing:
PROBLEM: Batteries failing after 40-60 hours
WHY #1: Cracked solder joints and thin traces
WHY #2: Internal construction doesn’t match specification
WHY #3: Supplier couldn’t meet spec at price, proposed “equivalent”
WHY #4: Our 2-hour test couldn’t catch 40+ hour failures
WHY #5: Testing protocol designed for production speed, not failure detection
“There’s our root cause,” Felicity said, pointing to WHY #5. “Jordan followed the protocol. The protocol was wrong. We optimized for throughput, not for catching real-world failures.”
“If we’d stopped at WHY #1 or #2, we’d blame the supplier and switch vendors. But the same problem would recur because our test still couldn’t catch it. Only by drilling to WHY #5 do we find the system flaw: our testing protocol was designed for the wrong objective.”
THE CONCEPT: Root Cause Analysis
When quality problems occur, root cause analysis determines the fundamental reason so future defects can be prevented. Two complementary tools help: the Fishbone Diagram and the 5 Whys.
The Fishbone (Cause-and-Effect) Diagram
This tool, developed by Kaoru Ishikawa, systematically brainstorms all potential causes:
Structure:
- Head (right): The problem being investigated
- Spine (horizontal): Main arrow connecting causes to effect
- Bones (diagonal): Major categories of causes
- Sub-bones: Specific potential causes within each category
Standard Categories (6 Ms):
- Materials: Raw materials, components, supplies
- Methods: Procedures, processes, policies
- Machines: Equipment, technology, tools
- People: Training, skills, communication
- Environment: Conditions, temperature, humidity, location
- Measurement: Inspection, testing, data collection
Purpose: Cast a wide net before narrowing. Consider ALL possibilities before investigating any. Prevents jumping to conclusions.
Below is a fishbone (or cause-and-effect or Ishikawa) diagram for illustrative purposes.
The 5 Whys Technique
This tool drills progressively deeper by repeatedly asking “Why?” (typically five times, though sometimes more or fewer):
Process:
- Start with clear problem statement
- Ask “Why did this happen?” → Get immediate cause
- Ask “Why did THAT happen?” → Dig deeper
- Continue asking “Why?” → Each answer becomes next question
- Stop at actionable root cause → Can fix it and prevent recurrence
Root Causes vs. Symptoms:
- Symptom: “Supplier sent bad batteries”
- NOT Root Cause: Still prompts “Why did they?” and “Why didn’t we catch it?”
- Root Cause: “Testing protocol designed for speed rather than accuracy”
Root causes typically reveal system design flaws requiring fundamental change, not individual errors requiring punishment.
Key Principles
Data Focus, Not Speculation: Each “why” should be supported by evidence. Use data, not guesses.
Gemba Approach: “Go and see” the actual problem situation. Don’t analyze from the office—observe where work happens.
Blame the Process: Root cause analysis usually reveals system failures, not individual incompetence. People typically work reasonably within flawed systems.
Prevention Focus: The goal is preventing recurrence, not assigning blame.
Why This Matters
Without root cause analysis, organizations:
- Fix symptoms, not causes
- Experience recurring problems
- Waste resources on ineffective solutions
- Never improve underlying systems
With root cause analysis, organizations:
- Fix fundamental causes
- Prevent future problems
- Improve systems permanently
- Build continuous improvement capability
SterlingSound’s analysis revealed the root cause wasn’t a bad supplier or careless inspector—it was a testing protocol optimized for the wrong goal. Fixing that system-level cause will prevent similar failures across all components.
Part 7: Process Variation and Control Charts
THE STORY: Tuesday, 6:30 PM
Elena from Manufacturing showed production data. “This chart shows battery capacity for every unit we tested during production. Most cluster around 93-94 mAh.”
“This scatter is common cause variation—the normal, natural variation inherent in any process,” Elena explained. “Even perfect processes vary because of countless small random factors: slight temperature changes, minor material variations, tiny equipment differences. It’s the background noise you can’t eliminate without fundamentally redesigning the system.”
“But look at these points,” Jordan said, pointing to spikes outside the normal range. “They jump way up or down.”
“Those are special cause variation—signals that something unusual happened,” Elena said. “Maybe a machine drifted. Maybe a batch of materials was different. These aren’t random—they’re clues that something changed.”
She overlaid the chart with three horizontal lines: one in the middle (the average) and one above and below (control limits).
“This is a control chart. The control limits are calculated from the process’s natural variation. As long as points stay within limits and bounce randomly, the process is ‘in control’—stable and predictable, showing only common cause variation.”
“But when points go outside limits, or show non-random patterns like several trending upward, that signals special cause variation. Something changed. You need to investigate.”
She circled several points outside the limits. “We had special causes showing up weeks before we shipped. We saw them and just retested those units. We treated signals as noise.”
“Here’s the critical insight,” Elena continued. “An in-control process is predictable. You know what you’re making. An out-of-control process is unpredictable. You’re shipping mystery. Even if individual units pass tests, the process itself is unstable—you don’t really know what you’re producing.”
THE CONCEPT: Process Variation and Statistical Process Control
All processes exhibit variation. Understanding and managing variation is fundamental to quality management.
Two Types of Variation
Common Cause Variation (Random Variation)
The natural, inherent variation resulting from countless small factors:
- Minor material property fluctuations
- Tiny equipment performance variations
- Small environmental changes
- Natural human variation
- Measurement system precision limits
Characteristics:
- Random (no pattern)
- Stable over time (predictable range)
- Affects all outputs similarly
- Cannot be eliminated without fundamentally changing the process (new equipment, different materials, redesigned procedures)
Special Cause Variation (Assignable Variation)
Variation from specific, identifiable factors not part of normal process:
- Equipment malfunction or miscalibration
- Operator error or inadequate training
- Defective batch of materials
- Environmental upset (power surge, temperature spike)
- Process setting drift
Characteristics:
- Non-random (shows patterns or outliers)
- Unpredictable timing
- Often affects specific outputs or time periods
- Can and should be investigated and eliminated
Statistical Process Control Charts
Control charts are the primary tool for distinguishing between common cause and special cause variation.
Structure:
- Horizontal axis: Time or sequence
- Vertical axis: Measured characteristic (dimension, temperature, capacity, etc.)
- Center line: Process average
- Control limits: Upper and lower boundaries (typically ±3 standard deviations from mean) calculated from the process’s natural variation
Reading Control Charts:
Process “In Control” (Stable):
- Points fall randomly within control limits
- No trends, cycles, or runs
- Only common cause variation present
- Process is predictable—tomorrow will look like today
Process “Out of Control” (Unstable):
- Points outside control limits
- Non-random patterns (several points trending, alternating high-low, runs of points on one side)
- Special causes present
- Process is unpredictable—can’t reliably predict what comes next
Management Response
For Common Cause Variation:
- Accept as inherent to current process
- Don’t overreact or constantly adjust
- Only reduce through fundamental process improvement
- “Tampering” (adjusting process in response to common cause) increases variation
For Special Cause Variation:
- Investigate immediately
- Find and eliminate the assignable cause
- Document findings
- Prevent recurrence
- Restore process to stable state
Conformance Quality and Specifications
Specifications define acceptable limits for product characteristics (e.g., “95 mAh ±5%”). Conformance quality means outputs fall within specifications.
Key distinction: A process can meet specifications but still be out of control. Meeting specs means individual units pass. Being in control means the process is stable and predictable.
Process Capability (covered next) addresses whether an in-control process can consistently meet specifications.
Why This Matters
Understanding variation helps managers:
- Distinguish “the process working normally” from “something went wrong”
- Avoid overreacting to common cause (tampering)
- Avoid underreacting to special cause (missing problems)
- Make processes predictable and manageable
SterlingSound had special causes (supplier variation) but treated them as common cause (random noise). Control charts would have signaled problems weeks before shipping.
Part 8: Process Capability
THE STORY: Wednesday, 10:00 AM
Marcus showed two overlapping bell curves: “OUR PROCESS” centered at 93.5 mAh and “SPECIFICATION” with limits at 90.25 and 99.75 mAh.
“Even when we eliminate special causes and get in control, we have another problem,” Marcus explained. “Our process is centered at 93.5, but the specification center is 95. We’re systematically producing batteries that average 1.5 mAh too low.”
He pointed to where the process curve extended below the lower specification limit. “Because of normal variation around our average, about 15-20% of batteries fall below 90.25 mAh—outside the specification. They’re defective.”
“So even a perfectly stable process can consistently produce defects?” Felicity asked.
“Yes,” Marcus said. “There’s a critical distinction between two questions:”
He wrote on the board:
“Question 1: Is the process IN CONTROL (stable)?” “A process is in control when it’s predictable, showing only common cause variation. Control charts tell us this.”
“Question 2: Is the process CAPABLE (adequate)?” “A process is capable when its natural variation is narrow enough that virtually all outputs fall within specification limits. A process can be in control but not capable—perfectly stable but consistently producing defects.”
“Our situation exactly,” Marcus continued. “To become capable, we need to either shift our process average up by 1.5 mAh AND/OR reduce variation, or work with our supplier to achieve both.”
“Getting in control solves the immediate crisis—it stops the special cause variation bricking batteries randomly. But getting capable solves the long-term problem—it ensures we consistently deliver what customers need.”
THE CONCEPT: Process Capability
Process Capability addresses whether a process, when stable (in control), can consistently meet customer specifications.
Two Separate Questions
Managers must ask both:
- Is the process in control? (Stable and predictable?)
- Is the process capable? (Good enough to meet specifications?)
These are independent questions with different answers.
Understanding Capability
Capability compares:
- Process spread: The natural width of variation (common cause)
- Specification width: The range customers will accept
Visual Understanding: Imagine a bell curve (process distribution) and specification limits (vertical lines):
- Capable: Bell curve is narrow and centered within specification limits
- Not Capable: Bell curve too wide or off-center—tails extend beyond limits
Three Capability Problems:
- Too much variation: Process spread wider than specification range
- Off-center: Process average not aligned with specification center
- Both: Wide spread AND off-center
The Four States
A process can be:
- In control AND capable: Ideal—stable and consistently meets specs
- In control but NOT capable: Stable but produces defects (SterlingSound’s situation)
- Out of control but capable: Has potential but currently unstable
- Out of control AND NOT capable: Disaster—unstable and inadequate
Different Problems, Different Solutions
To Achieve Control (eliminate special causes):
- Investigate and fix assignable causes
- Standardize procedures
- Maintain equipment properly
- Train operators
- Use control charts to monitor
To Improve Capability (reduce common cause variation or re-center):
- Upgrade equipment or technology
- Use better materials or suppliers
- Redesign the process
- Adjust process parameters (temperature, speed, pressure)
- Work with suppliers to improve their processes
- Switch to suppliers with more capable processes
Sequential Improvement
Effective managers:
- First, achieve control: Eliminate special causes, stabilize the process
- Then, assess capability: Determine if stable is good enough
- Finally, improve capability if needed: Make fundamental process improvements
You need a stable baseline before improving capability.
Why Both Matter
- Without control: Process is unpredictable—fighting fires, can’t predict costs or defects
- Without capability: Process consistently disappoints—know what you’ll produce, and it’s not good enough
- With both: Process is predictable AND adequate—can reliably deliver quality
SterlingSound must achieve control (eliminate supplier variation) AND capability (correct process average or switch suppliers) to solve both immediate and long-term quality problems.
Part 9: Prevention Over Inspection
THE STORY: Wednesday, 11:30 AM
“I’ve been thinking about our whole approach,” Felicity said to the team. “We spent $395,000 on appraisal—testing every single unit that came off the line. And we still shipped 50,000 defective units.”
“Good quality cannot be inspected into a product,” she continued. “We can’t rely on catching defects after they’re created. We have to build quality in from the beginning.”
She drew a flow from left to right: DESIGN → SUPPLIERS → PRODUCTION → CUSTOMER
“Quality has to be designed and built in at every stage:
Design: Marcus, your team must design products that meet customer needs AND are manufacturable to specification.
Suppliers: Jordan, we must work with suppliers to ensure they have capable processes BEFORE we order components, not inspect afterward hoping to catch problems.
Production: Elena, your processes must be in control and capable, preventing defects rather than detecting them.
At every stage, every function, quality must be built in. Prevention, not inspection.”
“That’s why we’re redesigning our entire approach,” Felicity said. “New supplier qualification focusing on process capability. New testing protocols that actually match real-world usage. New design reviews involving all functions. We’re building a system that prevents defects, not one that hopes to catch them.”
THE CONCEPT: Prevention Over Inspection
A fundamental principle of modern quality management: Good quality cannot be inspected into a product or service. Quality must be designed and built in.
Why Inspection Fails
Inspection has inherent limitations:
- Reactive: Finds problems after they occur, when value is already lost
- Incomplete: No inspection catches 100% of defects
- Expensive: Requires inspectors, equipment, time, and facilities
- Non-value-adding: Inspection doesn’t improve the product, just sorts good from bad
- Creates waste: Defective units must be scrapped or reworked
Most critically: Inspection accepts that defects will occur and tries to catch them. It doesn’t prevent them.
The Prevention Approach
Prevention means building quality into products and processes from the beginning:
Design Stage:
- Design products that meet customer needs
- Design for manufacturability (easy to build correctly)
- Design robust products (tolerant of variation)
- Involve all functions in design reviews
Supplier Stage:
- Qualify suppliers based on process capability
- Develop supplier processes before production
- Partner with suppliers on quality improvement
- Verify supplier processes, not just outputs
Production Stage:
- Design processes capable of meeting specifications
- Achieve process control (eliminate special causes)
- Use mistake-proofing (poka-yoke) to prevent errors
- Empower workers to stop processes when problems occur
- Build in quality checks at each step (quality at the source)
Each Stage, Each Function
Prevention requires that quality be built in:
- At each stage of the value chain
- By each business function
- Through each process step
When every function and stage focuses on prevention, defects become rare rather than routine.
Prevention vs. Inspection Investment
Recall the Cost of Quality framework:
- Prevention costs (before production): Small investments
- Appraisal costs (during production): Moderate expenses
- Failure costs (after defects occur): Catastrophic losses
Prevention-focused organizations:
- Invest more in prevention and less in inspection
- Catch problems early when they’re cheap to fix
- Reduce total costs while improving quality
- Build continuous improvement capabilities
Inspection-focused organizations:
- Spend heavily on appraisal trying to catch defects
- Suffer high failure costs when inspection misses problems
- Fight recurring fires
- Never address root causes
The Strategic Shift
Moving from inspection to prevention requires:
- Management commitment to prevention investment
- Cross-functional collaboration on quality
- Process improvement capabilities
- Cultural change from “find and fix” to “prevent”
- Long-term thinking over short-term cost cutting
This shift is fundamental to modern quality management. Organizations cannot inspect their way to quality—they must build it in.
Part 10: The Path Forward – DMAIC
THE STORY: Wednesday, 1:00 PM – The Board Meeting
Felicity stood before twelve executives. Chance Sterling sat at the far end. She had fifteen minutes.
“Seventy-two hours ago, we faced a catastrophic quality crisis. Today, we understand what went wrong and have a structured plan to fix it using DMAIC—a five-phase quality improvement methodology.”
“PHASE 1: DEFINE”
“We defined the problem precisely: battery failures causing 23% returns at $17M+ cost. We defined the goal: reduce returns to under 2% industry standard and restore customer trust. We defined the team: cross-functional collaboration across all business functions, led by Operations.”
“PHASE 2: MEASURE”
“We measured current state systematically: 23% return rate, $17M in failure costs versus $820K in prevention and appraisal. We measured defect patterns: failures at 40-60 hours. We measured process performance: control charts showing special causes, capability analysis showing process off-center from specification.”
“PHASE 3: ANALYZE”
“We used Pareto analysis to focus on the vital few: battery failure represents 92% of returns—one problem, not eight. We used fishbone diagrams to brainstorm all potential causes systematically. We used 5 Whys to drill to root cause: testing protocol designed for production speed rather than failure detection. We analyzed variation: process out of control with special causes. We assessed capability: even when stable, process not capable of meeting specifications.”
“PHASE 4: IMPROVE”
“Now we implement solutions:
Immediate (2 weeks):
- New 72-hour burn-in testing protocol matching real-world usage
- Enhanced supplier verification of internal construction and process capability
- Proactive replacement program for affected customers
Short-term (2 months):
- Dual-source battery suppliers with demonstrated capability
- Real-time control charts across all critical components
- Cross-functional quality reviews for all products
- Updated testing protocols for all components
Long-term (6 months):
- Supplier development program improving partner processes
- Process capability studies ensuring control AND capability
- Integrated quality management system across all functions
- Prevention-focused culture with employee involvement”
“PHASE 5: CONTROL”
“Finally, we sustain improvements permanently:
- Real-time statistical process control charts
- Monthly cross-functional quality reviews
- Supplier scorecards tracking capability and performance
- Customer feedback loops for early problem detection
- Continuous improvement culture: every problem triggers root cause analysis
- Top management accountability for quality systems”
Felicity clicked to her final slide:
“Investment and Return”
“We’re requesting $1.5M in quality investment—83% more than before. This includes enhanced prevention activities, supplier development, testing equipment, and training.”
“But this investment will save $15-20M in external failure costs. More importantly, it transforms us from a company that inspects quality to one that builds it in. From reactive firefighting to proactive prevention. From functional silos to integrated system.”
“Quality drives revenue through customer satisfaction and pricing power. Quality reduces costs through waste elimination and efficiency. Quality equals profitability and competitive survival.”
“We’re not asking you to fund a recovery plan. We’re asking you to fund a transformation into a quality-focused organization.”
Chance leaned forward. “You’re confident this will work?”
“I’m confident we now understand quality management as a system,” Felicity said. “We know quality requires three aligned perspectives: product-based, process-based, and customer-based. We know prevention beats inspection. We know quality originates in systems created by management. We know we must blame processes, not people. We know how to focus on vital few problems. We know how to find root causes. We know how to distinguish and manage variation. We know we need both control and capability. And we know DMAIC provides structure to make improvements stick.”
“Three days ago, we didn’t know any of this. We do now.”
The board approved.
THE CONCEPT: DMAIC Framework
DMAIC is a structured, data-driven methodology for quality improvement that provides discipline and rigor to problem-solving.
The Five Phases
DEFINE: Clearly articulate problem, scope, goals, and team
- What is the specific quality problem?
- What is the scope (products, processes, time periods)?
- What are measurable goals?
- Who needs to be involved?
- What is the business impact?
MEASURE: Quantify current state with data
- Measure baseline performance (defect rates, costs, capability)
- Measure defect patterns (when, where, frequency)
- Measure process performance (control charts, capability)
- Measure costs of quality
- Validate measurement systems
ANALYZE: Identify root causes
- Pareto analysis: Find vital few causes
- Fishbone diagrams: Brainstorm potential causes systematically
- 5 Whys: Drill to root causes
- Control charts: Distinguish common from special cause
- Capability studies: Assess if process is adequate
- Test hypotheses with data
IMPROVE: Implement solutions to eliminate root causes
- Generate solution alternatives
- Evaluate solutions (cost, feasibility, impact)
- Pilot on small scale
- Implement full-scale
- Verify improvements with data
CONTROL: Sustain improvements over time
- Document new procedures
- Train employees on changes
- Implement ongoing monitoring (control charts, audits)
- Create response plans for problems
- Hand off to process owners
- Continue measuring key metrics
Why DMAIC Works
Structured: Prevents jumping to conclusions or skipping steps
Data-Driven: Every phase relies on evidence, not opinions
Root Cause Focus: Analysis ensures fixing causes, not symptoms
Measurable: Baseline and verification prove impact
Sustainable: Control phase prevents backsliding
Systematic: Transforms firefighting into disciplined improvement
Management Implications
DMAIC represents a fundamental shift:
- From reactive crisis response → proactive problem-solving
- From opinion-based decisions → data-driven decisions
- From quick fixes → root cause solutions
- From temporary improvements → sustainable change
Organizations that embed DMAIC develop continuous improvement capabilities that drive competitive advantage.
Conclusion: Quality Management as a System
Six months later, SterlingSound’s Elite Pro 2.0 launched with a 1.3% return rate and 94% customer satisfaction. All critical processes were both in control and capable. Real-time control charts monitored quality continuously. The cross-functional team met weekly, collaborating on quality improvements.
Felicity had learned that quality management isn’t about perfection—it’s about building systems that prevent defects, understand variation, identify root causes, and continuously improve. It’s about all functions working together, top management taking responsibility, and blaming processes rather than people.
Most importantly, quality equals profitability: higher revenue from satisfied customers and pricing power, lower costs from prevention and efficiency, competitive advantage from reputation and performance.
Key Principles Summary
- Three Perspectives on Quality
- Product-based quality: Grade, features, positioning (Corolla vs. Lexus)
- Process-based quality: Conformance and consistency (defect-free production)
- Customer-based quality: Meeting expectations (combination of product and process quality)
- Quality Drives Business Performance
- Revenue: Customer satisfaction, market share, pricing power
- Costs: Reduced waste, rework, defects, complaints, returns
- Profitability: More revenue + lower costs = competitive advantage
- Costs of Quality
- Prevention costs: Investments before production
- Appraisal costs: Inspection and testing during production
- Failure costs: Internal (before shipping) and external (after shipping)
- Quality is Free: Prevention investment saves multiples in failure costs
- Quality as Organizational System
- Requires all business functions working together
- Top management creates systems and leads quality culture
- Marketing, Finance, Engineering, Purchasing, Logistics, Operations all contribute
- Cross-functional collaboration breaks down silos
- Blame the Process, Not the Person
- 80-85% of quality problems originate in systems/processes
- Only 15-20% originate with front-line workers
- Fix systems, not symptoms
- Management accountable for creating quality-enabling systems
- Prevention Over Inspection
- Quality cannot be inspected in—must be built in
- Design, supplier selection, and production all require prevention focus
- Build quality in at each stage, by each function
- Pareto Analysis
- 80% of problems from 20% of causes
- Focus on vital few for maximum impact
- Strategic resource allocation under constraints
- Root Cause Analysis
- Fishbone diagram: Systematic brainstorming of potential causes
- 5 Whys: Drill down to fundamental system causes
- Data focus and gemba (go and see) approach
- Prevent recurrence by fixing root causes
- Understanding Variation
- Common cause: Normal random variation inherent to process
- Special cause: Assignable variation signaling something changed
- Control charts distinguish between them
- Respond appropriately: improve system for common cause, investigate and fix special cause
- Process Capability
- In control: Stable and predictable (only common cause variation)
- Capable: Natural variation fits within specifications
- Need both control AND capability
- Different problems require different solutions
- DMAIC Structure
- Define: Problem, scope, goals, team
- Measure: Baseline performance and patterns
- Analyze: Root causes with systematic tools
- Improve: Implement and verify solutions
- Control: Sustain improvements permanently
Quality management transforms organizations from reactive to proactive, siloed to collaborative, inspection-focused to prevention-focused. These aren’t academic theories—they’re practical tools managers use to build competitive advantage through operational excellence.
Companies that master quality management thrive. Those that don’t become case studies in what happens when quality fails.
Key Terms
Quality Perspectives: Product-Based Quality, Process-Based Quality, Customer-Based Quality
Business Impact: Revenue Growth, Cost Reduction, Pricing Power, Market Share
Costs of Quality: Prevention Costs, Appraisal Costs, Internal Failure Costs, External Failure Costs, Quality is Free
System Concepts: Quality as System Property, Total Organization Involvement, Top Management Responsibility, Cross-Functional Collaboration, Blame the Process Not the Person, Prevention Over Inspection
Analysis Tools: Pareto Analysis (80-20 Rule), Vital Few vs. Trivial Many, Fishbone (Cause-and-Effect) Diagram, 5 Whys, Root Cause Analysis, Gemba
Variation: Common Cause Variation, Special Cause Variation, Statistical Process Control, Control Chart, In Control, Out of Control
Conformance: Specifications, Conformance Quality, Process Capability, Capable Process
Improvement: DMAIC (Define, Measure, Analyze, Improve, Control)
Media Attributions
- Pareto-chart-Returned-Units © Shane Schvaneveldt is licensed under a CC BY-NC-ND (Attribution NonCommercial NoDerivatives) license
- cause-effect-diagram-Battery-failure © Shane Schvaneveldt is licensed under a CC BY-NC-ND (Attribution NonCommercial NoDerivatives) license
