14 Managing Risks
What Could Go Wrong
Francois Carrier
Learning Objectives
Identify common sources and types of business risk, including financial, geopolitical, environmental, and reputational risks.
Explain how risk factors impact business performance regarding price and brand, product selection and availability, and product innovation.
Assess the vulnerability of a supply chain using heat maps and bow-tie diagrams.
Describe the role of visibility, redundancy, and responsiveness in managing hard-to-quantify risks.
What Could Go Wrong: Understanding Risk
“Anything that can go wrong, will go wrong.” This principle, known as Murphy’s Law, has entered popular culture and is often used humorously to explain various mishaps: for instance, why your buttered toast landed butter-side down, why a surprise quiz occurred in the class you skipped, or why you woke up with a pimple on picture day.
However, the law had a significant and practical meaning for Edward A. Murphy Jr., who coined it. Ed Murphy was a safety engineer at the beginning of the space age, where the stakes were incredibly high—failure could lead to loss of life. In such high-pressure situations, it was crucial for Ed and his team to assume that failure was a possibility and to take every precaution to prevent or mitigate even the most unlikely risks of equipment failure or human error.
While most of us do not face life-threatening challenges like those encountered by pioneering astronauts, risks are still present in our daily lives. This is due to the uncertainty that surrounds us. We don’t know if we will get along with our new roommate, how much financial aid we will receive, or what grade we will get on our final exam. Perhaps the only certainty is that uncertainty never completely goes away. And that’s okay: not knowing what’s ahead adds a thrilling twist to our lives. For instance, think about missing your favorite team’s championship game and later watching the replay while already knowing the final score. It just wouldn’t be the same.
Uncertainty isn’t only about having incomplete information. Even when we have good information and things appear the same, outcomes can still surprise us. Those surprises can happen because of tiny changes in the environment, or imperceptible variations in how the work gets done.
Additionally, some situations — especially those involving human interactions — are inherently ambiguous, leading to more uncertainty and risk. For example, consider a group project where the roles, deadlines, and expectations from the professor are unclear. Such lapses in communication can cause great confusion. In the end, uncertainty comes in many forms, and it definitely brings its share of risks.
A risk is a chance that something bad or unexpected might happen. Risks can vary in size — like feeling a bit nervous about asking a question in a big class (a very small risk), or taking a leap of faith by turning down a stable job to follow a passion. We often find ourselves facing risks when making decisions, whether in school, sports, or business. As you step into your future career, you’ll encounter plenty of decisions that come with their own level of risk — and nobody wants to be the person who leads their team astray! That’s why it’s important you understand common business risks and their effects. This knowledge will help you plan ahead, protect yourself, and navigate any bumps in the road. That’s what this chapter is about.
Common Types of Business Risks
If you’ve had any experience with business, you know that business is about people. We set up plants, distribution centers, and retail outlets in communities that support us and benefit from what we do. We source supplies from vendors and hire employees who help create products and services for our customers. We proudly pay dividends to our shareholders and contribute taxes that support essential public services like safety, education, health, and transportation. No matter your role—whether you’re an employee, a leader, or a business owner—you’re really in the people business. That’s one of the reasons why business, as an academic discipline, is considered a social science.
Many factors cause uncertainty and risk in life, but for Ed Murphy, people were the main source of risk. People are amazing—they’re creative, empathetic, and remarkably adaptable and resilient. However, they are also unreliable. Sometimes they forget things, feel tired or emotional, get distracted, or make mistakes. This human element is a key risk factor in business. But that’s not all! There are many other factors that add to and even increase business risks. Let’s explore some of them:
Globalization: Globalization has opened up exciting opportunities for businesses around the world! Thanks to affordable ocean transportation, international trade agreements, and the Internet, even small companies in rural America can tap into global markets. Along with these opportunities come some challenges. Companies may face additional supply chain disruptions due to geopolitical events or global economic shifts. Moreover, longer trade routes can lead to a higher chance of incidents happening while goods are in transit. Balancing these opportunities and risks is all part of the journey in today’s interconnected world.
Outsourcing: As competition intensifies, many companies find it necessary to concentrate on their core competencies—the things they do better than anyone else—while outsourcing other functions. As companies outsource more, they become increasingly dependent on their supply chain partners. By abandoning control over a portion of the supply chain, companies also lose the ability to manage crises that arise in those areas, leaving them vulnerable to the companies they have outsourced to.
Lean: Just-in-time (JIT) strategies involve delivering products in small quantities to the exact location and at the precise time they are needed. These strategies have significantly improved efficiency by drastically reducing work-in-process inventories and lead times. That’s why they are so popular. The down side is that, while lean inventories perform well in stable environments, they do not adequately protect companies from sudden supply shortages. This vulnerability was highlighted during the COVID-19 pandemic, when companies with more inventories fared better than those with less.
Climate change: The weather is a common source of uncertainty and risk. Rising temperatures are aggravating various weather conditions and climate extremes across the globe[1]. Extreme weather events wreak havoc on the transportation and energy infrastructures, and paralyze the affected regions. The production and distribution of goods is impaired, leading to delivery delays and, in some cases, the cancellation of orders, which creates a ripple effect throughout the supply chain.
Technology: Rapid technological innovations are changing how business is conducted. These innovations include Agentic and Generative AI, robotics, and autonomous systems. The pace of innovation is so rapid and widespread that it is very difficult to predict where the next innovation will come from, and how it will impact a given industry. For existing businesses, this situation increases the risk that their products will become obsolete.
Clearly, no part of the business is immune from risks, and risks are becoming more prevalent. Whether you work in finance, operations, marketing, HR, or in another field, you need to be aware of and understand the types of the risks your company faces. Table 13.1 provides a classification of common business risks. The classification is organized around six categories often referred to as the PESTEL dimensions[2] used to analyze business operations and develop strategic plans. The PESTEL dimensions can help ensure you are including all pertinent aspects of the business situation you are studying:
- Political: Government instability, trade restrictions, or sudden regulatory shifts can lead to compliance risks, operational disruptions, or difficulties in accessing critical resources and markets.
- Economic: Fluctuations in exchange rates, inflation, or interest rates expose companies to financial risks, market uncertainty, and supply and demand imbalances.
- Social: Evolving social norms, changing demographics, or shifting consumer preferences may create reputational risks, labor force mismatches, and demand uncertainty.
- Technological: Rapid innovation or technological obsolescence can trigger competitive risk, cybersecurity threats, or failure to adapt to changing market expectations.
- Environmental: Natural disasters, climate change, and stricter environmental regulations can cause supply chain disruptions, and pose physical as well as regulatory compliance risks.
- Legal: Shifting labor laws, intellectual property disputes, or antitrust regulations can result in litigation risk, penalties, or erosion of market position.
The PESTEL dimensions sometimes overlap with each other, making it difficult to unambiguously distinguish among risk factors. For example, a cybersecurity risk (Technological) may result from an employee breaking the law (Legal); a reputational risk (Social) may aggravate market risks (Economic). Nevertheless, the above classification demonstrates the breadth of an organization’s risk exposure, and strongly suggests that risk management should be integrated into every business decision.
| PESTEL Dimensions | Examples of Business Risks |
|---|---|
| Political | Attacks of commercial ships in the Red Sea reduce to a trickle the traffic through the Suez Canal, a major waterway connecting Europe and Asia.
Hefty tariffs are imposed on goods traveling through a busy international trade route. Customers boycott products from a country to protest against the policies of its government. |
| Economic | Interest rates go up sharply as central banks respond to rising inflation.
A global shortage of semiconductor chips prevents the final assembly and shipment of millions of vehicles. |
| Social | A large supplier is mired in a forced labor scandal.
A union of dockworkers negotiates a new labor contract with port authorities, and threatens to strike. Rapid population growth in our strongest market invites a competitor to enter. |
| Technological | A new technology threatens to render a top selling product obsolete.
A customer database is compromised, and sensitive information about thousands of customers leaks. |
| Environmental | A blizzard stops all traffic in and out of a busy distribution center.
A new study finds that a commonly used chemical is linked to cancer leading the government to ban its use. |
| Legal | A company is fined for violating customer privacy rules.
Counterfeit products infringe on the company’s product offering. A new regulation forces companies to trace all product components back to their points of origin. |
Risk management belongs to the ENGAGE process of the SCOR model discussed in Chapter 2. By proactively managing risks, supply chain professinals improve their ability to source, make, deliver, and return products and services with minimal interruptions. As products and information flow smoothly, the business can continue to fulfill its mission, and create value for the company’s customers and other stakeholders.
Conversely, a risk can quickly disrupt the company’s operations, preventing it from delivering the value promised to customers. Revisiting Table 13.1., it is not hard to see how each risk example directly impacts the dimensions of the company’s customer value proposition: product innovation; product selection and availability; price and brand; value-added services; or relationships and experiences (see Chapter 2). While risks typically impact multiple dimensions of customer value, for simplicity of exposition only one dimension is portrayed in Table 13.2.
| Business Risks | Possible Performance Impacts |
|---|---|
| Reduced traffic through the Suez Canal | Product selection and availability: Delivery delays impact product availability and may limit customer choice. |
| Hefty tariffs are imposed | Price and brand: The cost of tariffs is such that it must be passed down to customers in the form of higher prices. |
| Customer boycotts | Relationships and experiences: The relationships with foreign customers are strained by the political tensions between the two countries. |
| Rising interest rates | Value-added services: As the cost of capital rises, the company must focus on its core business; non essential value-added services are cancelled. |
| Global shortage of semiconductor chips | Product selection and availability: Product final assembly is delayed. Customers can’t be served. |
| Forced labor scandal at a supplier | Relationships and experiences: The reputation of the company and its products is marred by the scandal affecting its supplier. |
| Port strike | Product selection and availability: While port operations are on hold, nothing moves. Customers will just have to wait. |
| Competitor enters market | Price and brand: The company is forced into a price war with the new competitor. |
| Technology obsolescence | Product innovation: The company’s products are perceived as outdated relative to the competition. |
| Compromised customer database | Relationships and experiences: Customers feel betrayed and angry that their personal information was not safeguarded. |
| Blizzard | Product selection and availability: It will take days or weeks before the distribution center can once again send and receive goods. |
| Ban on commonly used chemical | Price and brand: The ban forces the company to turn to another, more expensive chemical. This change puts pressure on already thin margins. |
| Violation of customer privacy rules | Price and brand: More than the cost of the fine, the damage to the company’s reputation irreparably hurts the brand. |
| Counterfeit products | Product innovation: The availability of counterfeit products undermines the company’s ability to fund the development and marketing of truly unique products. |
| New traceability regulation | Price and brand: The cost of complying with the new regulation is high, which erodes the company’s margins. |
A Framework for Measuring and Assessing Risks
When we talk about risks, we are really concerned about the downside of an unknown factor or outcome. In general, you don’t need to worry about upside risks. Just enjoy them when they come.
The existence of a risk doesn’t mean something will go wrong — it just means there’s a possibility or chance that a negative event will occur. The rigorous and systematic study of chance outcomes belongs to the field of probabilities. Learning probability theory is beyond the scope of this book, although basic concepts are introduced in Chapter 4. As you pursue your studies, you will learn more about probabilities and the related field of statistics. This will improve your ability to understand and manage business risks.
At this point, all you need to know is that some risks are easy to quantify while others are not. Table 13.3 lists some examples of quantifiable and hard-to-quantify risks. You know something about quantifiable risks. These risks are common enough and sufficiently documented that data about their likelihood and intensity is available. For example, you may be able to estimate a range of possible outcomes, or what the most or least likely outcomes might be. You may even be able to plot a histogram of possible outcomes. (In probability theory, this is called a probability distribution.) Quantifiable risks are sometimes called the known unknown because even though they are not known with certainty, we do know something about their uncertainty.
Knowing the probability distribution of a known unknown, we can use mathematical models to manage the associated risks. For example, knowing the distribution of outcomes, you could determine if the expected costs are worth the expected benefits. Or, given past sales data, a supply chain manager could calculate the average demand and the variability of demand for a product, and design an inventory system to manage the risk of stocking out.
Insurance companies are in the business of protecting their customers against known unknowns. They rely on large, real-world datasets, and advanced mathematical models to estimate the financial impacts of common risks, and design contracts to protect against them, a discipline known as actuarial science.
| Quantifiable Risks
Known unknowns |
Forecast error
Manufacturing problems Product shortages Transportation delays Supplier performance Market risks |
|---|---|
| Hard-to-Quantify Risks
Unknown unknowns |
Terrorist attacks
Pandemics Geopolitical crises Natural disasters Government regulations |
As illustrated in Table 13.3., some risks are very difficult to quantify. When the COVID-19 epidemic erupted in 2019, it had been more than 100 years since the last global viral outbreak. No one could remember what it was like, but even if someone did, the world had changed so much, and had become so complex that it was impossible to predict how the virus would spread. There was no template to follow, no insurance company to turn to for protection. Terrorist attacks, armed conflicts and natural disasters also fall in the category of hard-to-quantify risks. To describe risks about which very little is known, we use the term “unknown unknown,” an expression coined by Donald Rumsfeld, who served as U.S. Secretary of Defense during the 9/11 terrorist attacks.
Dealing with the known unknown is hard enough; when dealing with the unknown unknown, you may be tempted to throw up your hands in despair, and give up. Please, don’t. We will explore strategies for dealing with the unknown unknown in the next section. For now, let’s continue our examination of the known unknown by considering two simple framework for assessing and managing risks: (1) Heat maps and (2) Bow-tie diagrams.
Heat Maps
As we’ve seen, not all risks are created equal. A professional’s limited time cannot be absorbed with managing inconsequential risks. A simple framework that helps to identify and prioritize risks would be very helpful, especially one that does not require any knowledge of probability theory or complex mathematical calculations. A heat map provides such a framework.
A heat map visually and concisely presents the results of a risk assessment exercise. To manage risks effectively, one needs to identify and be able to quantify the risks so they can be compared as to their importance. Specifically, when managing risks, one needs to distinguish between the likelihood of the risk (i.e., its probability of occurrence), and the impact of the risk, which is how extensive the damage would be if the risk materialized. For example, there is a possibility that an electric malfunction will cause a house fire while you’re away. Fortunately, the risk of losing your home to a fire is low, but the consequences would be devastating. There is a much greater chance that you will forget to turn in your homework, and get a bad grade. Although frustrating, getting a bad grade is not as bad as losing your home. Comparing risks with very different impact and probability profiles is not a straightforward task, but the following risk assessment exercise can help.
The process for conducting a risk assessment follows four steps:
- Identify all relevant risks
- Assess each risk for its impact and likelihood
- Prioritize the risks
- Develop risk mitigation plans
In Step 1, it’s helpful to enlist the help of a cross-functional team in the identification of all relevant risks. Bringing together subject matter experts from engineering, marketing, supply chain, finance, IT or legal can broaden your perspective on risks and eliminate potential blind spots. The team comes together to brainstorm and identify all relevant risks, perhaps using the PESTEL framework introduced earlier. Using your favorite Generative AI in the brainstorming can help ensure all bases are covered. Mapping out the supply chain is also helpful in identifying risk. As you systematically review the activities involved in sourcing, making, delivering and returning products, list the relevant risk objects. A risk object is defined as an entity or asset (tangible and intangible) that is vulnerable to risks. Risk objects include facilities, business units, teams, processes, products, etc. For each risk object, list all common, quantifiable risks that come to mind.
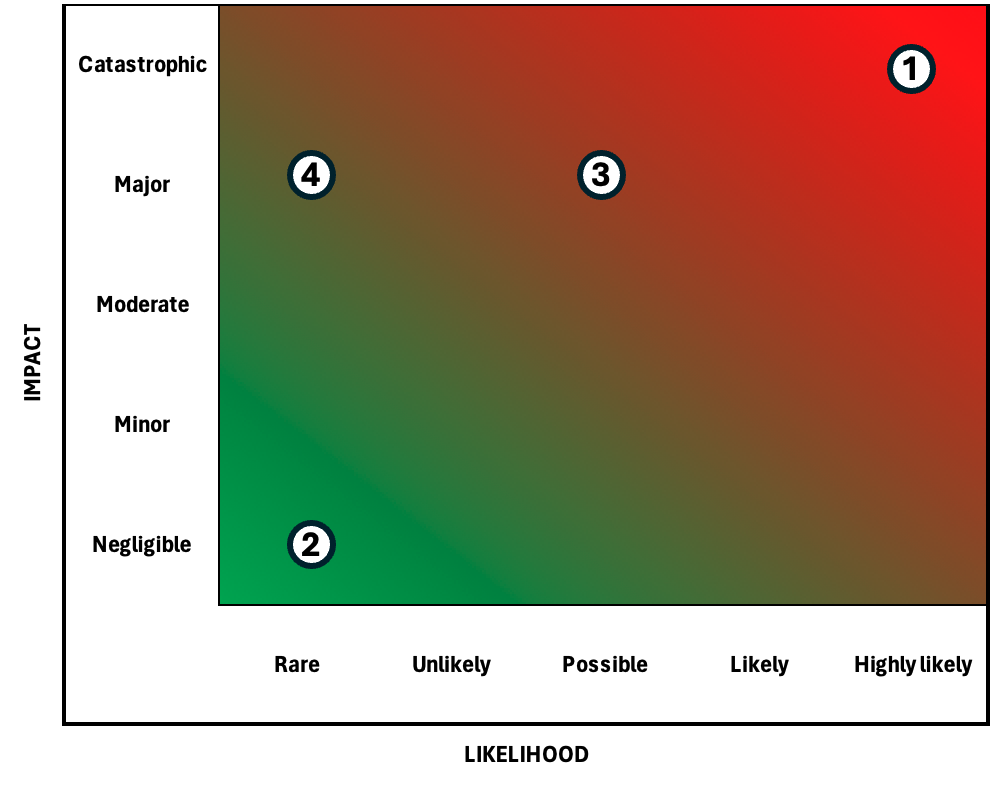
In Step 2, each risk is then assessed for impact and likelihood. We know that some risks are hard to quantify. Even for quantifiable risks, it may be difficult to come up with a reliable evaluation of the risk impact, let alone a precise financial estimate of damages. Fortunately, such an estimate is not necessary. It is enough to classify each risk using categorical scales. For impact, the categories range from Negligible to Minor, Moderate, Major and Catastrophic as illustrated in Figure 13.1. We do the same for the risk likelihood. Here, the categories are: Rare, Unlikely, Possible, Likely, and Highly likely.
To prioritize risks in Step 3, we simply position them on the risk map (see Figure 13.1) using the information gathered in Step 2. This allows us to combine impact and likelihood in the prioritization of risks. A risk characterized by high impact and high likelihood will appear in the upper righthand corner of the map (see Risk 1 in the red zone), indicating that the risk should be given maximum priority. Conversely, a rare risk with negligible impact will be positioned in the lower lefthand corner (see Risk 2 in the green zone).
Ideally, we would like to have a plan for every risk identified in Step 1. If this isn’t practical, we should start with the risks with highest priority (red zone), and develop mitigation plans for them. To mitigate a risk means we are working to reduce the potential negative consequences of the risk by taking actions to reduce its impact or likelihood. Note that some mitigation actions can address multiple risks. For example, when you buy auto insurance, you get coverage for a broad range of risks that arise from owning a car, each with its own risk profile: accidents, breakdowns, weather-related damages, theft, etc.
As we discussed in an earlier chapter, running out of a product is a common business risk that qualifies as a known unknown. Depending on your situation, the risk is at least “possible” or “likely.” If the product is your top-selling item, the damage to your business in terms of lost sales and reputation could be “major,” if not “catastrophic.” This puts the risk in the red zone (see Risk 3 on Figure 13.1). Carrying some safety stock is a typical strategy for mitigating such a risk. While it may be difficult to reduce the impact of the stockout, you can reduce its likelihood by carrying a larger safety stock. In a way, the money invested in safety stock can be seen as insurance against the risk of stocking out. As you increase the safety stock, the stockout risk moves from “possible” to “rare,” or from the red zone toward the green one (Risk 3 gets downgraded to Risk 4).
Consistent with the Pareto principle, you should expect to spend more time developing mitigation plans for high priority risks. While the heat map tells you which risks are high priority, it does not tell you how to deal with these risks. This is where the Bow-Tie Risk Analysis Method becomes useful.
Bow-Tie Risk Analysis Method
High priority risks have the potential to cause serious damage. When facing high priority risks, it’s natural to focus on protecting yourself from catastrophic impact. People buy insurance to protect their homes and cars because they can’t afford to lose either.
However, focusing only on mitigating impacts is not enough and can even have unintended consequences. For example, research suggests that insured people tend to behave more recklessly than uninsured people because they know the insurance company will pay for damages if they get in an accident. A responsible risk management approach should also seek to reduce the likelihood of risks. That’s what the Bow-Tie Risk Analysis Method[3]does. It integrates impact and likelihood mitigation into a single framework as illustrated in Figure 13.2. Looking at Figure 13.2, it’s easy to see why it’s called the Bow-Tie method.
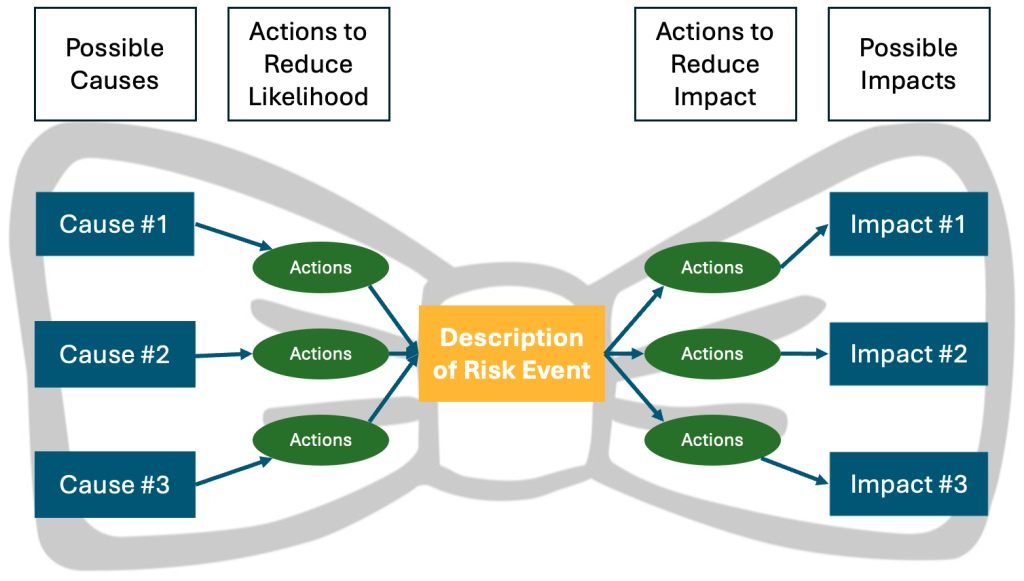
The method is repeated for every risk event under consideration. Drawing on root cause analysis, the method invites you to identify what causes the risk, and to propose actions to reduce the likelihood of each cause. This process is represented on the left side of Figure 13.2. Simultaneously, you should also list all possible impacts, and develop actions to reduct the effect of each possible impact.
Now, you know how to evaluate the vulnerability of a business using simple risk assessment tools.
Managing the Unknown Unknown
When dealing with known unknowns, you can leverage the information you have to manage the risks. There exist many probabilistic models to cope with different kinds of known unknowns. You can learn about them in advanced courses in operations & supply chain management, business analytics, or finance. Unfortunately, these quantitative approaches won’t work with unknown unknowns. What is needed in situations of high uncertainty is to make the supply chain much more flexible, or agile, so that it can adapt to changing circumstances that are difficult to predict. By flexible we mean “the ability to respond to change without increasing operational and supply chain costs and with little or no delay in response time.”[4]. To manage the unknown unknown, flexibility is perhaps the ultimate capability.
Next we review a few simple strategies that make supply chains more agile and help deal with unknown unknowns. These strategies have proven useful in turbulent environments as the following stories illustrate[5]:
- Invest in capacity redundancy
- Invest in visibility, sensing, and responding
- Create and nurture a flexible supply chain community
Invest in Capacity Redundancy
Capacity — like buildings, vehicles, machines and people used in production — is expensive. Having too much of it can really weigh down the business. That’s why companies are always trying to optimize their capacity investments. Whenever possible, they will get rid of unnecessary assets to free up cash, and improve profitability.
Consider for example a consumer packaged goods company that has grown organically and through acquisition over many years. The company now operates 30 plants serving customers all over the world. With each acquisition, the company increased its global footprint, but also added complexity, redundancies and other inefficiencies in the production network. In an effort to save money, management commissioned a study to rationalize the manufacturing network by closing down unproductive and redundant plants, and transferring production from less productive plants to highly productive ones. The study recommended closing half of the plants (15), including all plants in the company’s largest markets of North America and Europe. Under this plan, production would be realized exclusively in low cost countries. Despite higher transportation costs to serve North American and European customers from afar, the new optimal configuration would save the company $30 million a year, and improve the bottomline by the same amount. The study also found that closing 13 plants (instead of 15), and keeping one plant in North America, and one in Europe, increases total systemwide costs by about $1.5 million a year (a 5% increase in costs compared to the optimal solution).
In the optimal configuration, the company would save $30 million a year. Such a configuration maximizes the utilization of capacity by eliminating all capacity redundancies. The alternative configuration saves the company $28.5 million a year, which is $1.5 million less than the optimal. By keeping one plant in North America and one in Europe, the alternative configuration provides some redundancy in high value markets, which can help the company respond to unknown unknowns. While more expensive, the alternative configuration is also more flexible. Which configuration would you choose?
The answer lies in the relative importance of the $1.5 million invested in redundant capacity compared to the potential losses if something goes wrong. While $1.5 million may seem like a lot of money, it only represents 5% of the potential savings. In many cases, relatively small investments in capacity redundancy will be worth the costs (especially if you believe in Murphy’s law). The bottomline: Resist the tendency to eliminate all redundancies. Having some extra capacity can make the company more resilient to unknown unknown risks.
Invest in Visibility, Sensing, and Responding
Another approach to managing the unknown unknown is to increase visibility and speed in sensing and responding to sudden changes in the supply chain, as the following story illustrates[6].
You may be too young to remember, but before Apple’s iPhone, Nokia (a Finnish company) was the world’s leading cellphone manufacturer. Ericsson, a Swedish company, also operated in that space. In 2000, a fire at a Philips plant in New Mexico disrupted the supply of specialized microchips to both Nokia and Ericsson. The two companies responded in strikingly different manners:
Nokia had its finger on the pulse of the supply chain. When notified about the incident, it quickly mobilized a cross-functional team to investigate the situation and analyze the risks. Unconvinced by Philips reassurances, the team secured alternative sources of supply in a timely manner, and completely avoided any production losses. The impact on Nokia was minimal.
Compare that to Ericsson’s response. It took Ericsson weeks to react and when it did, it underestimated the risks. By that time, alternative sources of microchips were no longer available. As a result, Ericsson suffered major setbacks, including $400 million in lost revenue and delays in launching new products. Nokia’s proactive supply chain management and risk response allowed it to maintain its market leadership, while Ericsson was forced to exit the handset manufacturing market altogether. This case highlights the importance of supply chain visibility, and proactive and agile crisis response in managing hard-to-predict supply chain disruptions. To protect against unknown unknowns, increase the company’s ability to detect crises, and when they happen, act quickly and decisively.
Create and Nurture a Flexible Supply Chain Community
Lastly, consider the following story[7]:
In 1997, a fire at Aisin Seiki, Toyota’s sole supplier of a critical brake part (known as a P-valve), threatened to halt production at Toyota. Sole sourcing and the JIT practice of carrying only the minimum amount of inventory meant that within two or three days, vehicle final assembly would be forced to stop indefinitely throughout the Toyota Group. When the accident happened, external observers predicted the end of JIT. What happened instead was quite remarkable: Toyota’s network of suppliers mobilized quickly to restore production as fast as possible. Over years of collaboration, these suppliers had learned and practiced joint problem solving. Although the scale was much bigger, this was, for them, just another problem to solve.
More than 200 suppliers, guided by mutual trust, long-term collaboration, and decentralized coordination, averted disaster by returning the entire Toyota Group to full production within a week. This rapid recovery highlighted the strength of Toyota’s supplier partnerships and embedded problem-solving culture. The incident underscores how tightly integrated supplier networks, built on trust and shared capabilities, can foster flexibility, and resilience, and allow the company to manage the unknown unknown. The lesson here is to make collaborative problem-solving with supply chain partners a habit. When disaster strikes, the company’s partners will spontaneously spring into action to manage the crisis.
Conclusion
As you embark on your professional career, remember Murphy’s law. Perhaps the only certainty is that risks never completely go away. In fact, rapid technological and societal trends including the rise and decline of globalization, Agentic and Generative AI, autonomous systems, and mis- or disinformation are upending the world as we know it. In an increasingly complex and volatile business environment, risk management should be integrated into every business strategy. But risk management should not be the prerogative of specialists only. Simple strategies exist to manage risks whether they are easily quantifiable or not.
Discussion Questions
-
Think about an upcoming group project in this (or another) class. What are three risks that could derail the project? Which risk should be given highest priority? Why?
- About the group project identified in the previous question: List one cause and one impact of the highest priority risk. What actions could you take to reduce the risk?
- What risk strategy could your current employer or favorite sport team use better?
Media Attributions
- A Heat Map Example © François Carrier is licensed under a CC0 (Creative Commons Zero) license
- Bow-tie diagram © François Carrier is licensed under a CC0 (Creative Commons Zero) license
- For details, see the Climate Change 2023 Synthesis Report from the Intergovernmental Panel on Climate Change ↵
- The PESTEL framework is an adaptation of Harvard Professor Francis Aguilar's PEST framework for operations and strategic planning published in 1967. ↵
- A best practice recommended by the Supply Chain Risk Leadership Council, http://www.scrlc.com/ ↵
- Simchi-Levi, D. (2013). Operations rules: delivering customer value through flexible operations. MIT Press. pp. 13-14 ↵
- Ibid. ↵
- Walker, R., & Wilson, J. (2017). Nokia's supply chain management. Kellogg School of Management Cases, 1-8. ↵
- Nishiguchi, T., & Beaudet, A. (1998). The Toyota group and the Aisin fire. MIT Sloan Management Review. ↵
