13 Getting Products to Customers
Understanding Supply Chain Logistics
Ben Neve
Getting Products to Customers: The Magic of Logistics
Learning Objectives
- Understand the benefits and downsides of the different transportation modes
- Understand the different roles of distribution facilities
- Calculate and analyses basic logistics KPIs
- Illustrate/diagram a supply chain logistics network for a given supply chain strategy
- Research and find regional providers of logistics services (transportation, warehousing, 3PL, etc.)
This chapter focuses on the logistics of getting products to customers in a wide variety of industries. We begin with a deep dive of Amazon’s logistics network, and then discuss the types of facilities, transportation modes, strategies, technologies, and performance metrics commonly found in modern supply chains.
Logistics at Amazon
Have you ever purchased a product from Amazon that arrived within hours of when you placed the order? If it made you think you are special, you are! /s
And yet, over 50% of all Amazon orders arrive within one day or on the same day [1]. Amazon is an impressive example of how logistics activities can be optimized to get a HUGE variety of products to customers FAST.
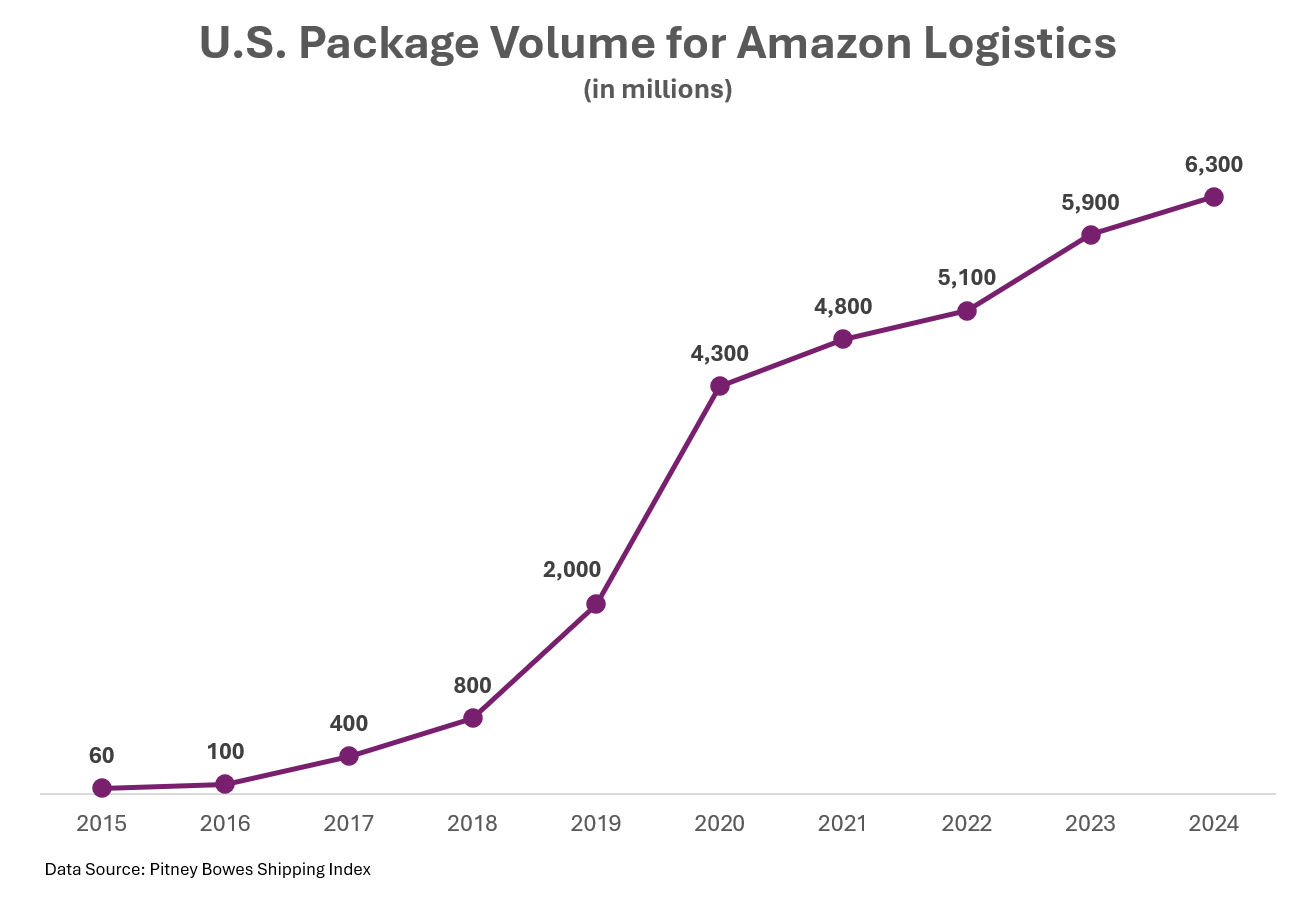
Twenty years ago, it took 2-3 weeks to get some college textbooks shipped from Amazon (speaking from personal experience). The number of packages shipped by Amazon annually has increased by more than 1000 times in twenty years, and yet their shipment times have fallen drastically.
The chart below shows how Amazon was shipping 60 Million packages in 2015 and grew its logistics capabilities to deliver 6.3 Billion packages in 2024.
 [1]
[1]
How does Amazon manage to deliver 6.3 BILLION packages in a single year (that’s about 200 packages delivered every SECOND)? The answer is Amazon’s Logistics and Fulfillment Network.
Amazon Logistics and Fulfillment Network
by the numbers in 2025 [1], [2], [3], [7], [8]:
Amazon fulfills orders through two major channels, the “Fulfillment by Amazon” (FBA) logistics network, which is solely operated by Amazon, and the “Fulfillment by Merchant” (FBM) channel which places fulfillment responsibility with the individual product sellers. The numbers below represent all of Amazon’s logistics network, mainly focused on the FBA fulfillment channel.
PEOPLE
1,556,000 Employees (1.1 Million in the U.S.). This 1.1 Million includes drivers, warehouse pickers, executives, IT personnel, supply chain leaders, logistics managers, accountants, marketers, lawyers, HR staff, and everyone else who works for Amazon within the United States.
FACILITIES
Amazon owns or leases more than 24 square miles of warehouse space (that’s more than 600 Million square feet!). A list of the types of facilities is given below:
|
Facility Type |
Global Count |
Primary Role/Notes |
|---|---|---|
|
Pime Air gateways/hubs |
≈30 |
Cargo plane loading & trans-shipment |
|
Inbound cross-docks (IXD) |
≈45 |
National & regional replenishment hubs to SC and FC |
|
Sortation Centers (SC) |
≈180 |
Regional “middle-mile” sort, palletize by ZIP to FC and DS |
|
Fulfillment Centers (FC) |
≈350 (≈150 in US) |
Core pick-pack-ship nodes to DS and individual customers |
|
Last-mile delivery stations (DS) |
≈550 |
Service 45-mile radii to individual customers |
|
Total Logistics Sites |
≈1200 (≈600 in US) |
Includes all facilities, Air, IXD, SC, FC, and DS |
Observation: The facilities listed in the table have been sorted in ascending order by number facilities. The closer the products get to the customer in the logistics network, the more facilities are needed to reach the customer within a reasonable time frame. That’s why Amazon only uses about 45 national and regional level cross-docks but then needs 350 fulfillment centers and 550 different last-mile delivery stations.
ROBOTS
Over 1 Million robots help to sort, lift, and carry packages in Amazon fulfilment and sorting centers (750,000+ robots support 75% of U.S. orders).
TRANSPORTATION
Amazon deploys a huge variety of transportation methods, with some of these assets known, while others have not been disclosed. Overall, Amazon employs over 390,000 drivers for these fleets. Each of these fleets are listed in the table below:
|
Transportation Type |
Global Count |
Primary Role/Notes |
|---|---|---|
|
Airplanes |
≈100 |
In Active use: |
|
Drones |
12+ |
Newly designed MK30 drone currently operating in Texas for customers within 7 miles of Fulfillment center |
|
Semi-Trucks |
≈40,000 |
Bulk shipping in LTL, FTL, or intermodal container |
|
Trailers |
≈60,000 |
Bulk shipping in LTL or FTL format |
|
Delivery Vans |
30,000+ |
Last-mile delivery to customers, includes 15,000 Rivian electric vans |
|
Heavy-Duty Electric Trucks |
≈50 |
Experimental but functional network of FTL/LTL shipping in Southern California |
|
53’ Intermodal Containers |
5,000+ |
Used for intermodal shipping on Barges, Railways, and Semi-trucks, with a recent increase in railway usage |
|
Ocean Container Ships |
Unknown |
Amazon increased barge use to manage COVID pandemic needs, and has continued and increased use |
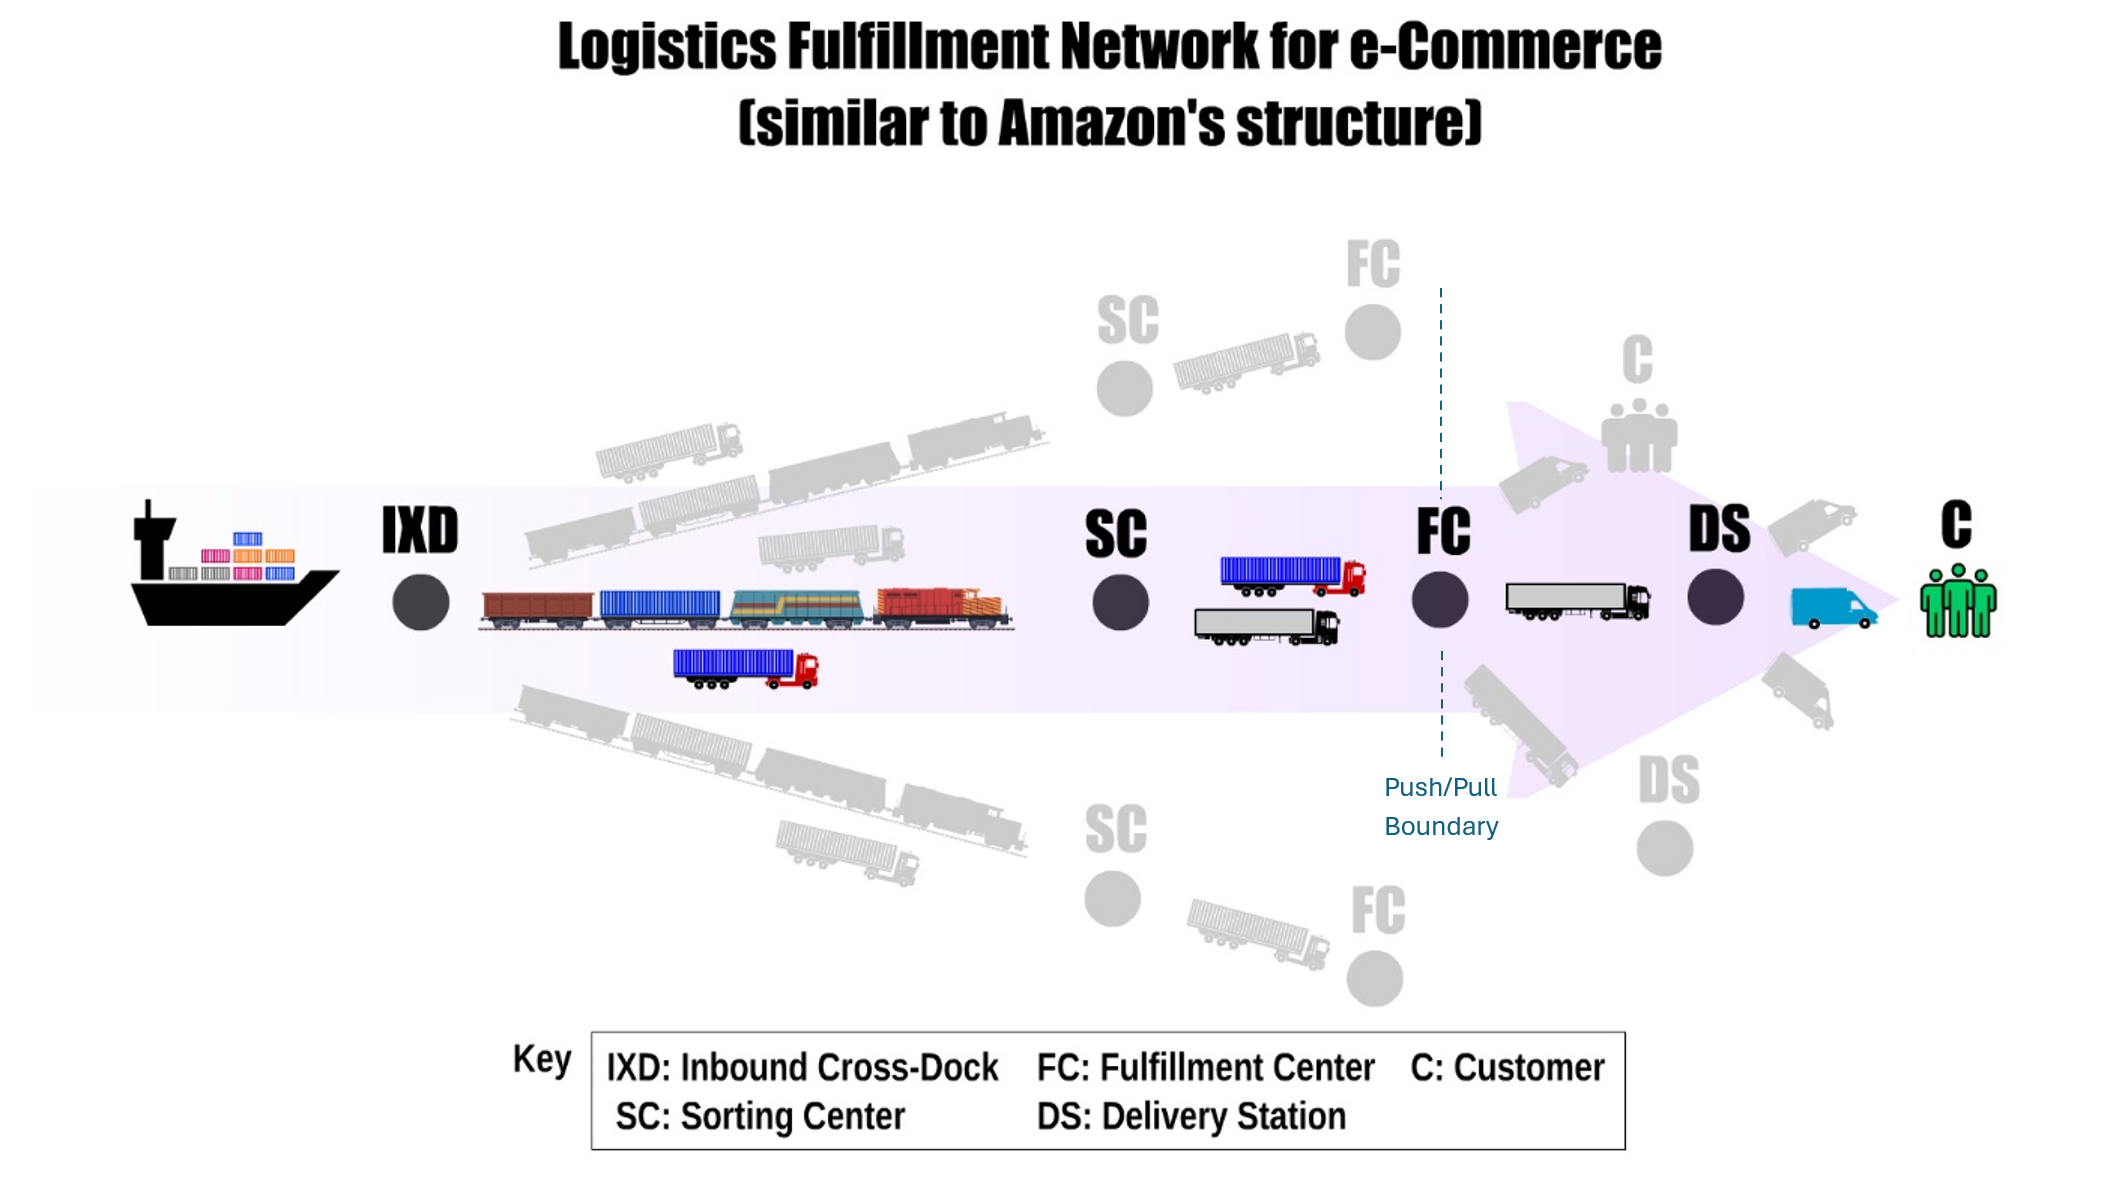
The following is a rough diagram of Amazon’s logistics and fulfillment network, where the container ship on the far-left side of the diagram represents what occurs in step 7 of the hypothetical journey described below.
The part of the diagram that is shaded in gray shows that the logistics network stretches farther than what is shown in the image. The colored portion demonstrates a single path through the logistics network from the imported goods at the ocean port to the end customer.
FIGURE 1 – Logistics Fulfillment Network Diagram
Because Amazon is one of the world’s largest logistics networks, their logistics operation includes most of what a logistics network might contain. Still, they are lacking in some areas. For instance, Amazon does not operate any pipelines, such as for oil, chemicals, or other liquids or gases. Amazon does not operate any manufacturing facilities, either, as it is primarily a retail supply chain.
As a result, Amazon does not deal with many raw materials such as steel, minerals, unprocessed agricultural products, or other bulk-ship raw commodities. Instead, Amazon deals largely with finished goods logistics for its global e-commerce retail supply chain.
The Secret Behind Amazon’s Fast Shipping
Even with all of Amazon’s immense warehousing space, shipping fleets, and fulfillment centers, there is no guarantee a package will arrive fast. Think of how long it would take to ship a phone charger from an overseas Amazon supplier to a doorstep, say, in Kenosha, Wisconsin. The journey would start at the finished goods inventory pile at the phone charger manufacturer and follow these steps (or some variation):
- Pack the freshly assembled phone charger into a case of 48 chargers
- Stack 100 cases of chargers onto a standard pallet
- Load 26 pallets of phone chargers into an intermodal 53’ shipping container
- Travel by Semi Truck to the ocean port
- Load the container onto a barge at the ocean port
- The barge travels across the ocean to a west-coast US port
- Container is off-loaded from the barge onto a rail car
- Rail car ships to one of Amazon’s Inbound Cross Docks where the container is loaded onto a Semi Truck
- The Semi Truck travels with the container to an Amazon Sorting Center
- The container is unloaded at the sorting center, with one pallet each going onto 26 different LTL Semi Truck shipments
- One of the LTL Semi Truck shipments travels to a Fulfillment center in Wisconsin, where all of the pallets are unloaded and stored for efficient picking
- A case of phone chargers is opened and placed on a pick rack for robots and people to pick and pack individual customer orders as they arrive in the system
- ——————————- Push/Pull Boundary ———————————–
- Customer in Kenosha, WI places order for the phone charger, and the order is automatically added to the pick/pack system
- Robots and humans work together to pick the phone charger from the shelf and package it into a box for the individual order
- Packaged individual orders are loaded onto a Semi Truck full of individual orders
- The Semi Truck travels to a Last-Mile delivery station in North Chicago, where the orders are unloaded, and sorted to Amazon delivery van staging areas
- The delivery van assigned to the route for the phone charger order, picks up the latest pile of customer packages at the staging area
- That day, the order with the phone charger is dropped on the doorstep of the customer’s home in Kenosha, Wisconsin.
It is impossible for these steps to happen in less than four hours, as the ocean barge shipping, alone, could take two weeks. And yet, the package arrives within 4 hours of placing the order.
So, what’s the secret?
Amazon uses advanced analytics (such as machine learning and artificial intelligence) to predict where the phone chargers will most-likely be ordered next. Then, the phone chargers are positioned at the fulfillment centers closest to the delivery stations where these orders are likely to occur.
Planning for your phone charger shipment probably happens weeks before you actually place the order, with the charger already staged nearby at an Amazon facility.
Vocabulary: Push/Pull Boundary
The point of the supply chain where products wait for customer orders is sometimes referred to as the push/pull boundary. All the logistics and distribution efforts up to that point have ‘pushed’ inventory towards potential customers, with no guarantee that customers will actually order the product. The inventory waits until a customer order requests that specific inventory item, and then the logistics network ‘pulls’ the product to the customer.
When you do place the order, Amazon robots or employees simply load a freshly packaged order onto the next Fulfillment Center outbound trailer headed to the Delivery Station facility (within minutes of placing the order). It may only take thirty minutes to ship to the delivery station, where they unload and stage the orders for each shipping route within 45 minutes of the delivery station.
When the driver assigned to your neighborhood drops by the delivery station for their afternoon pickup, your order from an hour earlier is waiting for them. They load it into their electric delivery van, and drive along the loop of their route, reaching your house within the next hour or two, and you have a fresh phone charger that was manufactured on the other side of the planet, less than four hours after you placed the order online. You are special!
Building Logistics Networks
Very few companies have logistics networks as massive and as capable as Amazon’s – though, UPS, Walmart, FedEx, and DHL are all also enormous, and may even support some of Amazon’s logistics operations. To build a logistics network, supply chain decision makers need to consider 1) the types of facilities and their locations, 2) the modes of transportation, 3) the technologies and IT systems, 4) the strategies they wish to deploy, and 5) the performance metrics necessary to measure success.
1) Facility Types and Choosing Good Locations
The basic functions of logistics facilities include product storage, sortation, consolidation, and/or shipping to the next facility or customer. Logistics networks also utilize other, less well-known functions as well, such as processing returned goods, minor assembly and packaging, and product inspection. The table below summarizes the different types of logistics facilities but should not be considered an exhaustive list, as new innovations and operations are being developed all the time as supply chains evolve. Also, other supply chain facilities such as raw material mining, product manufacturing, and service centers are not included in the list.
|
Facility Type |
Supply Chain Role |
Common Industries |
|---|---|---|
|
Warehouses and Bulk-storage terminals |
Short- or long-term Storage of raw materials, work in process, finished goods, and/or operating supplies. May ship to other facilities or to customers. |
Common across many industries, but especially in manufacturing, bulk commodities, agriculture, mining, and pharmaceuticals. |
|
Bonded Warehouses |
Store goods during the import process, especially while waiting customs clearance or duty payment, with potential for assembly, inspection, labeling/packaging, or other value-added processes. Ships to other facilities. |
Used often for global logistics with international trade components or specialized goods such as tobacco, alcohol, or luxury goods. |
|
Container Yards/ Intermodal Facilities |
Short-term storage and transfer of shipping containers between different modes of transport (barge, rail, truck). Ships to other facilities. |
Used with most global shipping and import/export operations, but especially common for automotive and electronics industries. |
|
Cross-Dock |
Quickly process incoming materials onto outbound shipments with little to no storage, often with sorting and/or consolidating functions. Usually ships to other logistics facilities. |
Especially common to fast-moving supply chains, such as food and beverage, retail, and other perishable goods. |
|
Regional/Local Hubs |
Intermediate facilities focused on aggregation and redistribution of products, may reduce overall supply chain transportation costs. May operate like Cross-Docks or Warehouses. Ships to other facilities. |
Very common in retail supply chains, e-commerce, and parcel delivery networks. |
|
Fulfillment Centers |
Picking, packing, and shipping centers focused on individual customer orders and fast turnaround times. Ships to the end customer or to last-mile facilities. |
Very common with e-commerce and other direct-to-consumer operations. |
|
Parcel Sortation Centers |
Similar to fulfillment centers but focused on last-mile operations and often downstream from a fulfillment center. Commonly uses automation and robotics for high-speed, high-volume processing. Ships to the end customer. |
Common to parcel logistics (UPS, DHL, Amazon, etc.) and public postal service operations. |
|
Returns/Reverse Logistics Centers |
Where companies inspect, refurbish, recycle, or disposal of returned products. Includes repair and repackaging operations, as well as salvage and disposal. Often processes return payments as well. Ships to other facilities or scrap/recycling centers, sometimes embedded within warehouses or other facilities. |
Consumer goods supply chains, as well as some business-to-business industries. |
|
Value-Added Services (VAS) Facilities |
A stopping point for unfinished or near-finished products to allow for customization, kitting, assembly, or other value-added services. |
Commonly utilized in apparel and promotional goods supply chains, as well as electronics and retail, especially with postponement strategies. |
|
Cold Chain Facilities |
Any of the above facilities may need to operate within the “cold chain”, where certain industries require specific cold temperatures to maintain the quality of their products. These facilities operate as enormous freezers or refrigerators often the size of large warehouses, where even the trucks going to and from these facilities use refrigerated trailers. |
The perishable products supply chains utilize cold chain facilities of varying types, especially for pharmaceuticals, agriculture, food and beverage, biotech, and even some chemicals. |
Supply chain decision makers consider a wide variety of variables before adding a new facility to a supply chain’s logistics network. The costs of building, buying, or renting the facilities, as well as the costs for related on-site equipment and automation are very important, as is the physical location of the facility. The location determines the transportation costs, tax costs, and how easily inbound and outbound shipping can connect to interstates and other time-saving roadways, railways, airports, inland ports, and ocean ports. Lastly, the availability of both skilled and unskilled labor workforce also helps to determine where to build the needed facilities.
To capture all these factors in a single decision, we can use weighted factor analysis, also called multi-criteria decision-making (MCDM), to determine an ideal location. Other techniques for choosing good locations include heuristic models, center-of-gravity models, or minimized load-distance models.
You can learn more about location optimization in a dedicated logistics course or math modeling course, but in this text we will focus on the weighted factor rating approach.
Example: Using weighted factor analysis to locate a last-mile parcel sortation center.
Consider a fictitious household goods company, Homie Home, Inc., that seeks to expand their logistics network in a growing region near Austin, Texas. Homie Home, Inc. ships common household goods such as cleaning supplies, pet supplies, water softeners, batteries, detergent, prepackaged foods and beverages, towels, bedding, and some apparel to subscription member customers as often as once per week.
Currently, Homie Home, Inc. has a large warehouse San Antonio (about an hour from Austin), to store pallets of products and to pick, pack, and ship orders to individual customers via third-party shipping.
With new subscription membership growth near Austin, the shipping costs for third-party logistics have been increasing drastically. So, Homie Home, Inc. intends to locate a new last-mile parcel sortation center. They are considering purchasing a suitable facility at one of three potential sites, in Wells Branch, South Austin, or Mueller. The purchased facility will serve the last-mile shipping needs for all of their customers within the Austin metropolis.
Important Factors
To choose an ideal location, Homie Home, Inc. wants to prioritize the cost of launching at each location, the availability of labor, access to major roadways, exterior space for truck and van movement, and age of the existing building’s infrastructure.
Meeting as a team of logistics and supply chain decision makers, Homie Home, Inc. decide that Cost is the highest priority, followed by labor availability, roadway access, exterior space, and finally the age of the facility. The weights for each factor are shown in the Weights column in the table below.
After choosing factor weights that align with strategy, the members of the location decision team rate each site on each factor. The table below shows the ratings for each site (1 to 5, 5 being excellent and 1 being poor).
Using a weighted factor calculation, weighted scores are computed for each site by multiplying the site scores with the related factor weights, and then computing the sum. For the Wells Branch location, for example, the weighted score calculation is: (4*0.30)+(5*0.25)+(2*0.20)+(3*0.15)+(1*0.10) = 3.4
|
Factor |
Weights |
Wells Branch |
South Austin |
Mueller |
|---|---|---|---|---|
|
Cost |
0.30 |
4 |
5 |
4 |
|
Labor |
0.25 |
5 |
3 |
4 |
|
Access |
0.20 |
2 |
2 |
5 |
|
Space |
0.15 |
3 |
4 |
3 |
|
Age |
0.10 |
1 |
4 |
5 |
|
Total Weighted Scores: |
3.40 |
3.65 |
4.15 |
|
After calculating the weighted scores, the Meuller site had the highest weighted score at 4.15. Using this approach would suggest that Homie Home, Inc. choose to locate their parcel sortation center at the Mueller site near Austin.
2) Modes of Transportation
Between all supply chain nodes, the different modes of transportation form the connecting bonds that allow products to flow from suppliers to manufacturers to distributors to customers, and back again. Choosing the best transportation mode depends on the type of product being moved, the speed required to meet customer needs, and the economics of the associated costs and revenues across the supply chain.
Imagine if a pizza restaurant used air cargo to transport a freshly made pizza to its customers. The pizzas would arrive cold, or they would have to be shipped in consistently warmed containers at great expense. Furthermore, rarely do people have airport runways near enough to their homes to make airplane-delivered pizza even feasible, requiring a second shipping method from the airport to customers’ homes. It would be a bad shipping choice, to be sure. Pizza delivery is much better when using a courier or delivery driver.
Despite the extreme example, the point is clear: supply chains use the modes of transportation best suited to their needs.
The table below summarizes the different modes of transportation common to modern supply chains:
|
Transportation Mode |
Uses |
Pros |
Cons |
|---|---|---|---|
|
Road
|
Versatile uses, including B2B and B2C, in bulk or individual products, broad cargo types |
|
|
|
Rail
|
Great for raw materials, chemicals, automobiles, and intermodal containers. Connects ports to industrial areas. |
|
|
|
Maritime (oceans and waterways)
|
Ideal for heavy or bulky shipments over long, intercontinental distances. Usually for shipping containers, oil, minerals, automobiles, commodities, and machinery. |
|
|
|
Air
|
Best used for high-value or time-sensitive shipments, especially express or emergency shipping. |
|
|
|
Pipeline
|
Mainly energy commodities and chemicals in continuous flow. |
|
|
|
Intermodal
|
For optimizing international shipping, especially containerized shipping. |
|
|
|
Specialized
|
Small, high-value, or urgent shipments, especially for last-mile flexibility and speed. |
|
|
3) Technology and IT Systems
The coordination of supply chain logistics networks requires fast, accurate communication between the various partners and facilities working to deliver products to customers. In the case of Amazon’s 6.3 Billion packages delivered in 2024, phone calls and emails just wouldn’t cut it.
Logistics software and IT systems have advanced to the point where they can take in information about weather, road closures, stock availability, real-time shipment tracking, and customer orders. Using this information, these systems can provide intelligent recommendations for travel routes, product positioning, and shipping schedules. Some of the common types of software systems used in logistics include:
- Transportation Management Systems (TMS)
- Provides a platform for planning and optimizing the physical movement of goods across the logistics network.
- Warehouse Management Systems (WMS)
- Allows for the management and control of daily warehouse operations, including receiving, picking, packing, and shipping of products.
- Enterprise Resource Planning Systems (ERP Systems)
- Centralized business system that include a suite of tools for finance, procurement, inventory, and order management.
- Customer Relationship Management systems (CRM Systems)
- Provides a tool for the management of customer interactions for sales, service requests, and relationship development.
There are some overlaps in what the software systems can do, but each provide specialized tools to enable and improve the performance of the supply chain in each area .
Beyond software, automation through robotics, artificial intelligence, and agentic AI allow for intelligent systems to take action without the intervention of human workers. As labor costs rise and available labor becomes scarce, automation provides a means where supply chains can continue operating effectively despite challenges.
Interesting video about Amazon Robotics and AI: Robot Video Link.
4) Supply Chain Strategies and Logistics Network Design
It almost goes without saying that different types of supply chains use different types of logistics networks. For instance, a car manufacturer, such as General Motors (GM), would not be packaging cars into small boxes to be delivered at the customer’s door like a retail supply chain like Amazon or Walmart.
Instead, GM’s logistics network feeds raw materials, car parts, and various sub-assemblies to their manufacturing centers from the supply side, where they design and build unique automobiles. On the customer side, GM’s completed cars are shipped by car transport carrier to the various holding lots and dealerships across the US and the world. It’s no wonder that GM’s logistics network looks very different from Amazon’s.
An organization’s logistics network should be designed to fit their needs, and to help them accomplish their strategic goals.
Walmart, known as a low-cost leader, makes logistics decisions that enable them to keep prices low, sometimes at the expense of quality. With enormous warehouses, they can purchase huge quantities of identical products at low prices. Their stores are usually located in low-cost areas, away from city centers and expensive real estate, and focus on utility, rather than aesthetic, in designing the customer’s shopping experience.
Ferrari, on the other hand, spares no expense to ensure their luxury sports cars are second to none. The Ferrari logistics network is a small, white-glove affair, where sometimes millions of dollars are exchanged for a one-of-a-kind, custom-built car delivered with enormous care to an exotic location.
A great question for logistics leaders to ask is “Does the design of our logistics network align with our strategic goals?” If not, a redesign may be needed to ensure that the supply chain can accomplish what it set out to do.
Some common structures for specific types of supply chains include: the hub-and-spoke model for e-commerce and retail supply chains, multi-echelon networks for manufacturing-oriented supply chains such as General Motors, and cold-chain networks with smaller warehouses close to customer consumption points for food and grocery supply chains.
5) Performance Metrics: Are we successful?
Looking at a functioning logistics network, how can you tell if it is successfully accomplishing the company’s strategic goals? How can you tell if customer expectations are being met?
Start by putting yourself in your customers’ shoes. What do you expect when you place an order with Amazon? Or, when you purchase something at Walmart? Or, more likely, when they deliver your new Ferrari to your 7th-generation family vineyard?
All orders should arrive:
- To the right customer
- With the right product
- In the right quantity
- At the right time
- In the right place
- In the right condition
- With the right cost
These “rights” are often referred to as the 7 “Rights” of logistics. Many organizations convert these “rights” into performance metrics that can indicate whether their customers are receiving what they expect. Some example metrics include perfect order rate, customer return rate, backorder rate, on-time delivery rate, and shipping accuracy.
Additionally, supply chains might also monitor outbound freight costs, order cycle times, GHG emissions, energy and/or water consumed, and waste generated.
These metrics reflect how performance is influenced (helped or hurt) by the types and locations of the logistics facilities, the transportation modes used, the effectiveness of the technologies and IT systems, and the strategies deployed across the supply chain.
You should be familiar with, and be able to compute, the following key logistics metrics:
- Perfect Order Rate: the percentage of orders delivered on-time, complete, damage-free, and with accurate documentation.
- ([# of perfect orders]/[total # of orders]) * 100%
- On-Time Delivery Rate: the percentage of orders delivered on time.
- ([# of on-time deliveries]/[total # of orders])*100%
- Order Cycle Time: the average actual cycle time, in days, achieved to fulfill customer orders, where cycle time starts when the order is received, and ends when customer accepts the order. Sometimes, this is referred to as customer order lead time, and can be used to give customers estimates
- ([sum of actual cycle times, in days, for all orders delivered]/[total number of orders delivered])
- Shipping Accuracy: the percentage of orders that are delivered with the right product in the right quantity.
- ([# of accurate orders delivered]/[total # of orders delivered])*100%
EXAMPLE: Computing Metrics
Using customer orders from the week of July 21-25 to determine logistics performance (Available in Excel here – Order Metrics Example Data):
|
Order # |
Date Ordered |
Date Promised |
# Ordered |
# Shipped |
Date Received |
Document Accuracy |
Damage Reported |
|---|---|---|---|---|---|---|---|
|
001 |
7/21/25 |
7/28/25 |
10 |
10 |
7/25/25 |
Yes |
No |
|
002 |
7/22/25 |
7/29/25 |
15 |
15 |
7/29/25 |
Yes |
No |
|
003 |
7/22/25 |
7/29/25 |
12 |
12 |
7/27/25 |
Yes |
No |
|
004 |
7/23/25 |
7/30/25 |
7 |
5 |
7/29/25 |
Yes |
No |
|
005 |
7/24/25 |
7/31/25 |
15 |
15 |
8/2/25 |
No |
No |
|
006 |
7/24/25 |
7/31/25 |
15 |
15 |
7/30/25 |
Yes |
No |
|
007 |
7/25/25 |
8/1/25 |
10 |
10 |
8/2/25 |
Yes |
Yes |
|
008 |
7/25/25 |
8/1/25 |
7 |
7 |
8/1/25 |
Yes |
No |
The data shows 8 customers orders from a week in late July, 2025, for a fictitious company the sells a single type of product. We can use this kind of data to calculate the metrics for perfect order rate, on-time delivery rate, order cycle time, and shipping accuracy.
Defining the data for each column:
- Order #: the customer order ID #, automatically generated by the ERP system
- Date Ordered: the date the customer placed the order, also called “order receipt”
- Date Promised: the promised date the customer should receive their order, policy in this company is to promise delivery within 7 days of when the order is placed
- # Ordered: the number of products ordered by the customer
- # Shipped: the number of products shipped to the customer
- Date Received: the date the customer received the order
- Document Accuracy: whether the ordering and shipping documents were accurate
- Damage Reported: whether product damage was reported by the customer
We will need to use Excel to compute some preliminary data for our performance metrics, namely:
- Order Cycle Time: # of days between Date Ordered and Date Received
- Lateness: whether the Date Received occurred after the Date Promised
- Accuracy: the percentage of # Shipped vs. # Ordered for each order
- Perfect Order: whether the order shipped on-time, in the right quantity, with the right documentation, and with no damage reported
With these columns calculated in Excel, we have everything we need to compute four Key Logistics Metrics.
- Perfect Order Rate: 62.5% of orders were perfectly executed
- On-Time Delivery Rate: 75.0% of orders arrived on or before the promised date
- Shipping Accuracy: 87.5% of orders shipped the right quantity
- Order Cycle Time: 6.5 days of average customer order cycle time
With a perfect order rate of 62.5%, we see that the logistics performance for customer orders from that week were not satisfactory. Digging down further, only 75% of the orders arrived on time, and 87.5% were shipped with the right quantity of products.
The order cycle time average of 6.5 days is below the promised 7-day delivery policy, but we still delivered 25% of the orders late.
Going forward, these metrics will become the performance baseline, showing the logistics leaders where to focus their improvement efforts, as well as monitoring how well (or how poorly) the improvements are impacting performance.
There are many more metrics that help to monitor the performance of a supply chain’s logistics network, and the Association for Supply Chain Management (ASCM) provides a comprehensive resource to guide logistics and supply chain professionals in using metrics. The ASCM Supply Chain Operations Reference: Digital Standard (SCOR DS) performance metrics repository can be found online at this link: SCOR DS Online Link.
The ASCM SCOR site offers several layers of metrics that can provide valuable insights into how well the logistics organization is delivering products to its customers, as well as how well the supply chain is performing overall.
Finding Regional and Local Logistics Providers
Instead of building a logistics network, many supply chain organizations will outsource some or all of their logistics to third parties. This includes warehousing, domestic transportation, global shipping, and even some manufacturing and customer services.
There is an entire economy built around 3PLs, or third-party logistics providers, who provide everything from basic shipping options to full-scale warehousing and fulfillment services. Some of the larger logistics companies listed previously provide these services on a global scale, such as UPS, DHL, and FedEx.
While not exhaustive, there are some online resources listed below to help find regional logistics service providers, beyond the large firms.
- 3PL Finder
- Allows users to search the US for warehouses and regional 3PL providers
- DAT Freight & Analytics
- Self-described as the largest truckload market place in North America, allows for trucking companies and supply chains to post and find potential shipping partners.
- Americas Driving Force
- Though focused on helping drivers find potential work, it can also be used to find trucking companies within a region of the US.
- Partner Carrier
- Focused on trucking brokerages in the US and Canada
- extensiv
- extensiv is an example of a logistics software company that provides a marketplace search option for supply chains to connect to 3PLs (while trying to sell their software).
There are great resources to help supply chains connect with logistics service providers online, and with the help of generative AI, filtering through all of the options is now easier than it has ever been.
Choosing the right logistics partner is critical, as many will not have the same goals or quality standards as your own supply chain. Building business relationships based on trust will ensure that goals align, and both firms will see progress towards goals that they individually value while supporting the other firm.
- Source: “Amazon Logistics Statistics” CapitalOne Shopping Research, July 23, 2025. URL: https://capitaloneshopping.com/research/amazon-logistics-statistics/, Accessed July 25, 2025
- How Many Amazon Warehouses Are There? (Updated for 2025), by Red Stag Fulfillment in 2025. URL: https://redstagfulfillment.com/how-many-amazon-warehouses-are-there/#:~:text=By%3A%20Colt%20Agar%20%E2%80%A2%20Fact,Checked, Accessed July 25, 2025.
- Amazon’s Growing Fleet of Cargo Ships: Impact on Global Shipping – Ship Universe, by Ship Universe, January 29, 2025. URL: https://www.shipuniverse.com/news/amazons-growing-fleet-of-cargo-ships-impact-on-global-shipping/ , Accessed July 25, 2025.
- How Amazon reworked its fulfillment network to meet customer demand – Amazon Science, By Amazon Science, July 24, 2023. URL: https://www.amazon.science/news-and-features/how-amazon-reworked-its-fulfillment-network-to-meet-customer-demand, Accessed July 25, 2025
- 50 Amazon Statistics You Should Know in 2025, By Shuai Guan at Thunderbit, June 8, 2025. URL: https://thunderbit.com/blog/amazon-stats, Accessed July 25, 2025
- Top 10: Logistics Brands | Supply Chain Magazine, By Libby Hargreaves for Supply Chain Digital. URL: https://supplychaindigital.com/top10/top-10-logistics-companies, Accessed July 25, 2025.
- Amazon Prime Air Fleet Details and History, by Planespotters.Net, updated July 21, 2025. URL: https://www.planespotters.net/airline/Amazon-Prime-Air, accesses July 25, 2025.
- How Many Amazon Trucks Are There? Explore 2025 Data, by Abdullah Faraz for Max Dispatch Service on April 21, 2025. URL: https://maxdispatchservice.com/amazon-fleet-stats/, accessed on July 25, 2025.
- The Secrets Behind Amazon‘s Lightning-Fast Shipping: A Deep Dive for the Savvy Shopper – Marketing Scoop, by Tom Wells for Marketing Scoop, April 19, 2024. URL: https://www.marketingscoop.com/consumer/how-does-amazon-ship-so-fast/, Accessed July 29, 2025.
Image attributions:
<a href=”https://www.vecteezy.com/free-vector/vehicle”>Vehicle Vectors by Vecteezy</a>
Discussion Questions
- Referring to Figure 1, suppose Amazon wanted to move its push/pull boundary even closer to customers. What would that look like, and how might costs change for Amazon’s logistics network?
- With same-day home delivery of products available in local retail locations, how does Walmart’s logistics fulfillment network differ from Amazon’s?
- Looking at the key logistics metrics discussed in the chapter, do think any key metrics are missing? In other words, what other logistics metrics might provide important insights into the success, efficiency, or effectiveness of a logistics network?
Practice Exercises
- Using information available through web searches or generative AI, draw and label a logistics network diagram for one of the following organizations:
- FedEx
- DHL
- UPS
- USPS
-
- Include the diagram, labels, and sources for your information
-
- Using information available through web searches or generative AI, draw and label a logistics network diagram for one of the following organizations:
- Nucor Steel
- US Steel
- Voith Hydro
- American Hydro
-
- Include the diagram, labels, and sources for your information
-
- Using Zillow, or some other real estate listings website, select 3 or 4 different home listings for a potential bed and breakfast location, assuming the B&B provides a daily breakfast for guests and arranges travel to nearby tourist locations, as well as to and from the airport. You will need to define criteria, assign appropriate weights, and then score the homes you selected based on those criteria. In the end, you should calculate weighted scores, and then select a home as the best listing for a potential bed and breakfast.
- Remember to include links for each home, justification or reasoning behind your selected criteria, the weights you assigned, and the scores for each property. Include the weighted score calculations and discuss whether the final selected property is the best option for a bed and breakfast.
- After selecting an ideal site, discuss the logistics for guest travel and how the B&B employee(s) will source ingredients for daily breakfast.
- Using the Order Data in the following spreadsheet (Order Data (40 orders)), calculate the key logistics performance metrics listed below for the first 20 orders, and then the same metrics for the last 20 orders. Compare and contrast how their logistics performance changed from the first 20 orders to the last 20 orders.
- Key Logistics Metrics
- On-Time Delivery Rate (%)
- Shipping Accuracy Rate (%)
- Perfect Order Rate (%)
- Order Cycle Time (average)
- Key Logistics Metrics
Media Attributions
- Logisitcs Package Volume by Year © Benjamin Neve is licensed under a CC BY (Attribution) license
