“It’s Not Always Poor Decisions”:
Shifts in Business Student's Attitudes Toward Poverty After Completing 'Spent'
Jessica Parks, Ph.D.
Abstract
This Scholarship of Teaching and Learning (SoTL) study examined whether undergraduate business students reported having different attitudes towards poverty after completing SPENT. SPENT is an open-access, digital poverty simulation offered through Urban Ministries of Durham. The author used the Reflexive Thematic Analysis approach (Braun & Clarke, 2006) to analyze 17 student reflection papers. The students were enrolled in an introductory finance course at a small teaching institution in the Southwest. The student reflection paper prompts were based on the four-phase Experiential Learning Model (Kolb, 1984). The author constructed four themes about the students’ attitudes toward poverty: (1) laziness and poor decisions, (2) multiple causes, (3) low wages, and (4) importance of education. This research offers implications for college instructors who use simulations and those who teach about poverty.
Keywords: poverty, business education, poverty simulations, SPENT, attitudes toward poverty
Introduction
According to Columbia University’s Center on Poverty and Social Policy (2022), an estimated 14.3 % of U.S. households in October 2022 lived in poverty. This was partially due to the ongoing COVID-19 pandemic, which drastically altered the USA’s economy leading to mass unemployment and high inflation (Mutikani, 2022). While Americans are generally sympathetic to those living in poverty (Ekins, 2019), they have different beliefs about the underlying causes of poverty. Even though poverty is caused by both internal and structural factors, college students are more likely to hold that internal causes (e.g., laziness, welfare dependency) are solely responsible for poverty (Hernández-Ramos et al., 2019; Hunt, 2004). Efforts to align business students with the lived realities of poverty are worthy of consideration. The SPENT poverty simulation is a pedological tool used to teach college students about poverty (Hernández-Ramos et al., 2019; Smith et al., 2016, 2017).
SPENT Poverty Simulation
SPENT is a free platform that is operated by the Urban Ministries of Durham (UMD). It was formed in collaboration with UMD and McKinney in February 2011 (McKinney, 2011). The simulation was based on the real-world experiences of their clients who encountered homelessness and poverty. SPENT players begin the “month” with only $1,000, no job, no apartment, and no savings (Hernández-Ramos et al., 2019). Participants make three important choices at the beginning of the simulation: (1) job choice, (2) health insurance, and (3) housing. The participants choose between three jobs: (1) restaurant server, (2) office temp, and (3) warehouse worker with varying hourly wages and work schedules. Next, the students choose between three health insurance plans with varying co-pays and monthly premiums. Lastly, students chose their residence. As noted in the simulation, student participants who choose to live closer to their jobs will have a higher rental obligation than their counterparts. After making these three selections, participants completed the rest of the simulation, making other day-to-day decisions. The goal of the simulation was to last until the end of the month with money remaining.
Scholarship of Teaching of Learning (SoTL)
The purpose of this Scholarship of Teaching and Learning (SoTL) study was to explore whether the SPENT poverty simulation caused a shift in students’ attitudes towards poverty. SoTL work is intended to encourage reflexivity in teaching, foster new learning about teaching, and ensure teaching effectiveness (Chick, 2018). Therefore, this research offers the author and readers the chance to reflect on the value of a SPENT poverty simulation in various higher education classroom settings. The author used Reflexive Thematic Analysis (Braun & Clarke, 2006) to analyze 17 student reflection papers across two sections of an Introduction to Managerial Finance course at a small, public teaching institution in the Southwest.
This research addressed three gaps in the literature. First, it added to the body of literature on the use of the SPENT poverty simulations in higher education studies. To date, few studies (e.g., Hernández-Ramos et al., 2019; Smith et al., 2016, 2017) have used the SPENT poverty simulation. Second, few articles, if any, emanate from business programs since the studies are more concentrated in pharmacy and healthcare-oriented classrooms (Smith et al., 2016, 2017). There is merit to introducing poverty simulations to business programs since experiential learning approaches can be more efficient than class lecture alone (Gierach & Nesiba, 2018). Lastly, even fewer studies explore the shift in college students’ attitudes toward poverty after completing SPENT outside of healthcare-related disciplines. Continuing this work on college business studies is worthy of consideration.
Literature Review
As of October 2022, an estimated 14.3% of households live in poverty (Columbia University, 2022). Poverty in the USA is quantified using an absolute measure, whereas anyone earning below a certain poverty threshold is deemed to be living in poverty. Poverty thresholds are produced by the United States Census for statistical purposes and specify the minimum income needed to cover basic needs such as food, clothing, and shelter. In 2021, the poverty threshold was $14,097 for those under 65 years old (Creamer et al., 2022). Poverty in the USA has drastically increased due to the 2020 COVID-19 pandemic (See Table 1 for a four-year comparison of poverty rates).
| 2019 | 2020 | 2021 | 2022 | |
|---|---|---|---|---|
| Official Poverty Rate | 10.5% | 11.5% | 11.6% | 14.3% (October) |
| Poverty Threshold | $13,300 | $13,788 | $14,097 | Not Available |
Attitudes Toward Poverty
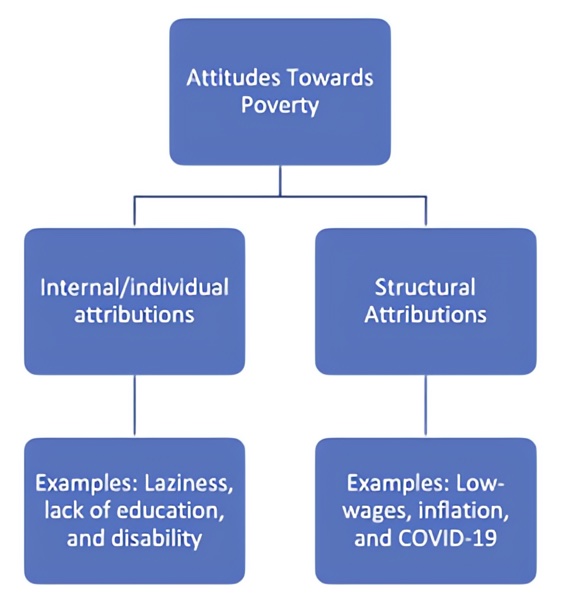
Attitudes toward poverty can be organized as internal/individual attributions or structural attributions. See Figure 1 for an illustration of the types of attributions. Internal/individual attributions suggest that the person is living in poverty to their own “individual failing” (Rank et al., 2003). Examples include but are not limited to laziness, lack of motivation to work, disability status, welfare dependency, and low educational attainment. Research demonstrated that internal/individual attributions could be responsible for poverty. For instance, those living with disabilities are more likely to live in poverty than their able-bodied counterparts (22.5% versus 8.4%) (Semega et al., 2020). In general, those with lower levels of education are more likely to live in poverty (Brady, 2019). Whereas only 4% of those with a post-secondary degree live in poverty, roughly a quarter of those with no high school diploma live in poverty (Semega et al., 2020). Lastly, welfare dependency (i.e., households receiving more than 50% of their total annual income from TANF, SNAP, and Supplemental Security Income benefits) can be a cause of poverty, encouraging persons to stay on welfare (Crouse et al., 2008).
In addition to internal/individual attributions, structural attributions such as institutional racism, increasing inflation, and low wages also contribute to poverty. A structural attribution suggests that a person is poor due to the ongoing “structural failings” (Rank et al., 2003) present in American society. With an increase in low-wage jobs, many full-time workers support their families on a Federal minimum wage of $7.25 (U.S. Department of Labor, n.d). As a result, it is not uncommon for full-time, hourly workers to live in poverty or rely on social assistance. In fact, nearly 52% of all fast-food workers rely on social assistance, including SNAP and Medicaid (Miao, 2020). The Federal minimum wage has remained unchanged since 2009 and does not keep up with inflation (U.S. Department of Labor, n.d). Due to the COVID-19 pandemic, inflation has increased dramatically from 1.4% in 2020 to 7% in December 2021 (US Inflation Calculator, 2022; Bureau of Labor Statistics, 2022). Inflation has led to higher costs of food, soaring home prices, and ongoing supply chain management issues (Mutikani, 2022).
SPENT
Research found that both internal and structural factors contribute to poverty (Brady, 2019). However, many college students believe that poverty is only caused by internal factors (Hunt, 2004; Hernández-Ramos et al., 2019; Smith et al., 2016; 2017). As such, educational efforts to align college students’ views with the lived reality of poverty are worthy of undertaking. Poverty simulations have been used widely in higher education and have been tied to general changes in students’ understanding of poverty. Poverty simulations have also been tied to increases in critical thinking, understanding of others, and active learning among college students (Vandsburger et al., 2010). SPENT is an open-access, choose-your-own-adventure-style, digital poverty simulation offered through Urban Ministries of Durham (2021).
Specifically, the literature demonstrated the effectiveness of the SPENT poverty simulation in changing college students’ attitudes toward poverty (Hernández-Ramos et al., 2019; Smith et al., 2016; 2017). Smith and colleagues (2016) conducted a SPENT simulation during the 2013 and 2014 academic years with 108 pharmacy, physician assistant, and communication science and disorders students. Using pre and post Undergraduate Perceptions of Poverty Tracking Survey (Blair et al., 2014) assessment, results found that students reported changes in their attitudes toward poverty. Smith and colleagues (2017) examined the effectiveness of SPENT and the Community Action Poverty Simulation (CAPS) on changing pharmacy students’ attitudes toward poverty. The CAPS program is another commonly used poverty simulation; however, it is offered in-personal as compared to the SPENT simulation. The 99 students attended Butler University in Indiana. Both the online SPENT game and CAPS interventions had positive effects on the students’ attitudes toward poverty (Smith et al., 2017).
Hernández-Ramos and colleagues (2019) sampled 190 undergraduate students at a mid-size Catholic university in the western U.S. The students were randomly assigned to the treatment simulation (SPENT) or a control game (Free Rice). Results showed no post-test difference by treatment (Individual Attributions p = .756; Structural Attributions p = .223). Playing SPENT, as opposed to Free Rice, increased students’ beliefs that poverty is attributable to structural conditions. It also diminished their beliefs that poverty is caused by individual factors. With the exception of a few studies, the SPENT poverty simulation has not been well documented in the literature. Additionally, poverty simulations have been rarely explored in finance, economics, and business literature (Gierach & Nesiba, 2018).
Methodology
This research was exempt from a full review as per the college’s Institutional Review Board. The 17 sampled students were enrolled in one of two sections of Introduction to Managerial Finance (FIN 301). There were 32 students enrolled in section one and 23 enrolled in section two, with a total of 54 enrollees. Each of the course sections was taught by the same instructor and used the same textbook, syllabus, assignment deadlines, and course lecture materials. Since the course was amid the COVID-19 pandemic, both sections were taught synchronously via Zoom on Mondays and Wednesdays (Noon and 6:00 p.m.). FIN 301 is a required course for all business students at the author’s particular institution and is a pre-requisite course for all upper-level finance courses.
The instructor gave students 15 minutes at the start of a Monday class to complete the simulation (http://playSPENT.org/). Then students were asked to complete a two-to-four-page student reflection paper. The reflection paper prompts were based on Kolb’s (1984) Experiential Learning Model. Eighteen (33%) students out of the total 54 enrollees consented to the study. However, one paper was dropped from the study since the student did not answer all of the questions. Therefore, this research analyzed a sample of 17 reflection papers. Since the author was also the instructor for the courses, a third-party de-identified the data by stripping it of the students’ names and other identifying information. The files were also renamed “Student 1” through “Student 17” and the findings refer to each student as such.
Kolb’s (1984) Experiential Learning Model and Reflection Paper Prompts
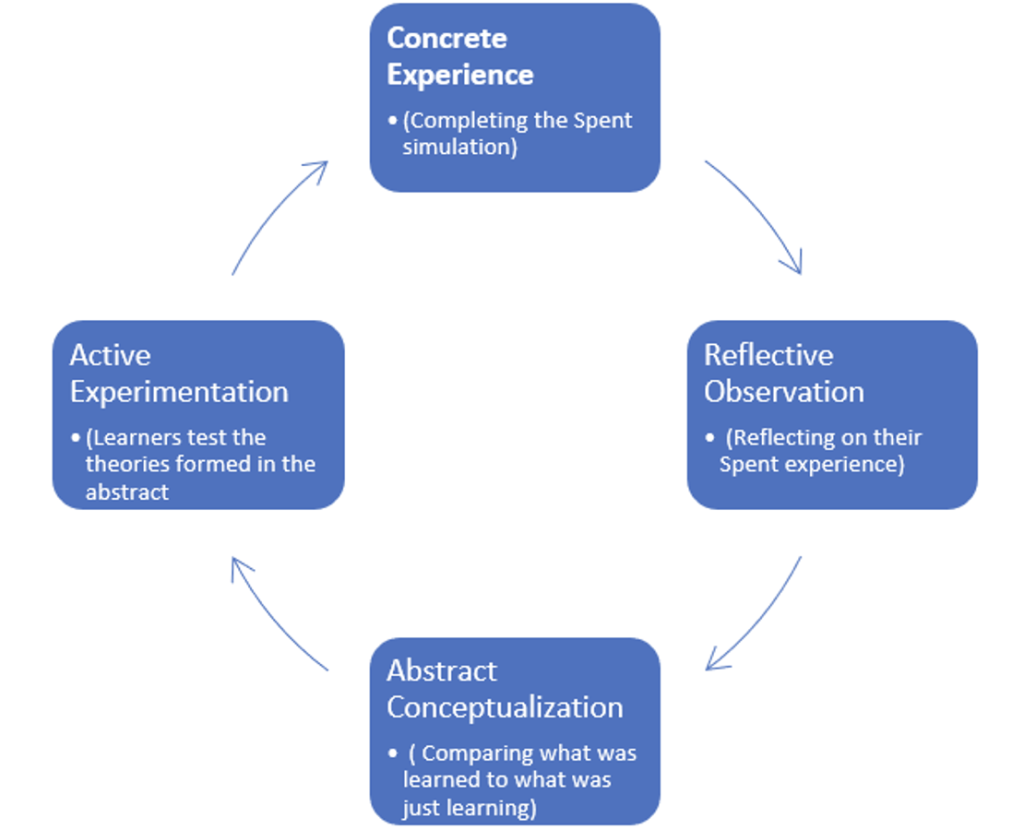
During the Kolb’s (1984) four-step model, students engage in a concrete experience (i.e., SPENT) and involve themselves in new experiences. During the reflexive observation stage, the students described and reflected on their experiences with SPENT via a reflection paper. The abstract conceptualization stage is where the students compared what was just experienced in SPENT to their previously held beliefs and attitudes toward poverty. Lastly, during the active experimentation period, learners test the theories formed in the abstract conceptualization phase and use them to guide future decisions. See Figure 2 for an illustration of the Kolb’s (1984) Experiential Learning Model. This model was used to guide the student reflection paper prompts:
- Identify your job, healthcare plan and rent choice. Why did you choose them? Did you make it to the end of the month? (Based on concrete experiences and reflexive observation phases)
- Provide a summary of your experience with SPENT. Discuss three choices you were faced with and the outcomes associated with them. (Based on concrete experiences and reflexive observation phases)
- Before completing this poverty simulation, what did you believe to be the cause of poverty in the United States? (Based on the abstract conceptualization phase)
- After completing the poverty simulation, what do you believe to be the major cause of poverty? (Based on abstract conceptualization active experimentation phases)
Reflexive Thematic Analysis (Braun & Clarke, 2006)
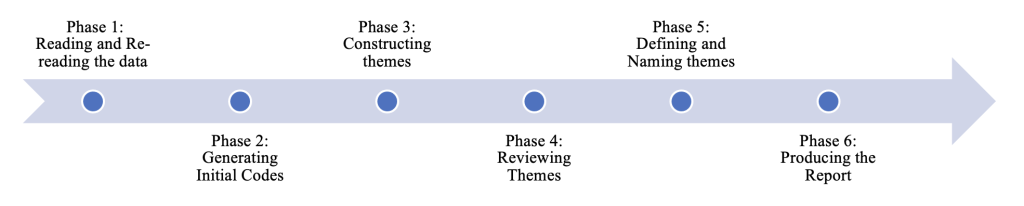
The six-phase Reflexive Thematic Analysis (Braun & Clarke, 2006) was used to analyze the 17 student reflection papers. During the first phase, the author read all student reflection papers twice. While reading the paper, the researcher highlighted phrases and maintained a list of initial codes. During the second phase, the author compiled the initial codes from the first and second readings. In the third phase, the researcher organized those codes into meaningful themes. In the fourth phase, the author reviewed themes, ensuring that all the codes in that theme were relevant to the theme. The author then, in the fifth phase, named and renamed the themes until the theme’s name fit with the codes. The researcher knew when all the candidate themes reflected the data when a specific name and brief description of the theme were generated. The final phase corresponds with the results section. (See Figure 3 for a visual representation of the Reflexive Thematic Analysis approach.)
Results
This research examined whether business students had shifts in their attitudes towards poverty after completing SPENT. Table 2 shares the job, health insurance, and rent choices for the 17 sampled students. The author constructed four themes: (1) laziness and poor decisions, (2) multiple causes, (3) low wages, and (4) importance of education. All student responses are presented exactly as original written by the student. Therefore, any grammar and punctuation errors are maintained to preserve the integrity of the student’s voice.
| Job | Insurance | Housing | Completion | |
|---|---|---|---|---|
| Student 1 | Warehouse | Gold | Over $800 | $52 remaining |
| Student 2 | Office Temp | Silver | $790 | $1,592 remaining |
| Student 3 | Office Temp | Bronze | $725 | Lasted 24 days |
| Student 4 | Warehouse | Bronze | $700 | Lasted 30 days |
| Student 5 | Warehouse | Gold | $840 | $505 remaining |
| Student 6 | Warehouse | Bronze | $725 | $781 remaining |
| Student 7 | Restaurant Server | Gold | $808 | Lasted 6 days |
| Student 8 | Warehouse | Bronze | $760 | Yes, $1,592 |
| Student 9 | Warehouse | Gold | $725 | Made It |
| Student 10 | Office Temp | Bronze | $705 | Lasted 16 days |
| Student 11 | Office Temp | Bronze | $725 | $259 remaining |
| Student 12 | Warehouse | Gold | $725 | Made it |
| Student 13 | Warehouse | Bronze | $840 | Lasted 12 days |
| Student 14 | Office Temp | Bronze | $808 | Made It |
| Student 15 | Warehouse | Bronze | $828 | Made it |
| Student 16 | Warehouse | Bronze | $808 | $284 |
| Student 17 | Warehouse | Gold | $807 | $73 left over |
Theme 1: Laziness and Poor Decisions
Students shared they held negative attitudes about those living in poverty prior to completing SPENT. For example, Student 1, who simulated a warehouse worker on the gold insurance plan, stated:
[I] thought that the main cause [of poverty] was that people weren’t motivating themselves to get a job or try and receive a better opportunity, that they weren’t managing their money correctly, or that they wanted to get government benefits.
Like Student 1, Student 2 also held that poverty was the result of laziness, lack of motivation, and welfare dependency. Student 2 simulated an office temp on the silver health insurance plan. After making it to the end of the simulation, Student 2 reported:
As a daughter of an immigrant and as an immigrant myself, there was a time in my life when I thought that people in poverty were lazy, when in reality this issue is a lot more complex and deeper. I mean, my mom must work to jobs so that we are not in poverty, but if she lost one of her jobs and all the benefits that comes with it, perhaps we would be in poverty… Poverty is not about people being lazy. Poverty is the result of a broken system, or perhaps of a system that was designed to do exactly what is doing.
Student 2 originally believed that poverty was the result of laziness. After the simulation, they reported that their attitudes toward poverty shifted. They now believe that poverty is the result of a “broken system.” Student 17, a warehouse worker on the bronze plan, shared that they believed that bad choices (such as gambling addiction) are the cause of poverty.
… bad decisions. The reason I say that is because unfortunately my father was a gambler and I know my parents got into some unnecessary debt due to this. I can totally see that being a great factor in a town like Las Vegas. Everywhere you go there’s a gambling machine.
Both Student 1, Student 2, and Student 17 all articulated that poverty is the result of internal factors such as lack of motivation, laziness, and poor decisions.
Theme 2: Multiple causes
After completing the simulation, students shared that they now believe that poverty is the result of multiple factors. For instance, Student 8, who simulated a warehouse worker on the bronze plan, shared:
I think that there are many factors that someone can go through that can put them in a poverty and that as a society we overlook so many of those situations and assume that the person is at fault…Education being entirely too expensive, low-income areas having lower education outcomes, lack of marketable skills, the minimum wage being absurdly low, growing up in poverty with limited resources to get yourself out, job loss, I think I could go on and on.
This student, like others, shared that poverty is the result of both internal and structural factors such as lack of education and low wages.
Theme 3: Low Wages
Another reoccurring theme in the data was students’ belief that poverty is the result of low wages, high cost of living, and low-paying jobs. Student 4, who simulated a warehouse worker on the bronze health insurance plan, stated:
I still believe that it all comes down to income and the ability to make or receive it. Everything costs money. To be able to live comfortably, eat better, be insured and enjoy some amenities, you need money. It is not easy to live in a country where you are struggling to make ends meet. In the United States there are many people who can’t afford their housing or living style even though it is at a bare minimum. Take for example, big cities or states like California, where many are leaving their states and move to neighboring states because they can’t afford it in California. However, the problem there is that they drive the prices in the new place they move to and now the residents of that location are also struggling to make ends meet because they can’t afford it.
Other students also shared that they believe that poverty is the result of structural factors (e.g., low wages and high cost of living). Specifically, Student 7 (a restaurant server on the gold health insurance plan) stated:
I believed many things before doing this stimulation project what were the cause of poverty in United States…Low paying jobs are the cause of poverty. High price apartment, high cost of food and every extra thing that comes up on a weekly bases that you have to pay for causes people to choose to either have no more money until you get paid again or to give something away just to keep few extra dollars. Things come up every day that we have to pay for that we might not include in the monthly budget, like fees for dogs, replacing a tire, kids tutor lessons, being sick and needing to see a doctor. You almost have to make just enough to cover all of those expenses, but how much is enough?
Both Student 4 and Student 7 cited the role that low wages have as a contributor to poverty. Many of the students discussed low-wage in more detail before and after the simulation.
Theme 4: Importance of Education
Overall, students felt that “a lack of access to education is a major cause of poverty because uneducated people will have an even more difficult time navigating the system” (Student 2). Student 10, who simulated the warehouse worker on the gold insurance plan, stated:
Without education, it would be even worse and make it impossible to find a good job to leave poverty. I don’t totally disagree with my points prior to the simulation, but I do have further points that support some of these ideas while also getting a clear image of what the problem comes from.
Additionally, Student 11 (office temp enrolled in the bronze plan) emphasized lack of education as a cause of poverty. Student 11 shared:
I truly believed that the cause of poverty is a lack of opportunity and sometimes a lack of education. I do not believe that everyone has access to the same resources and the same opportunities…I also believed a lack of higher education seemed to immediately close doors for many people. Higher paying jobs often require college degrees where certain skill sets are taught. If you did not have the degree to prove you have the needed skills set, those jobs were unavailable to you. You would have to take a job with lower wages that more people without credentials would be qualified for.
Both Student 10 and Student 11 emphasized the importance of education as both a cause of poverty and a tool to escape poverty.
Conclusion
This SoTL research examined whether business students reported different attitudes towards poverty after completing SPENT. This research used Reflexive Thematic Analysis (Braun & Clarke, 2006) to analyze 17 student reflection papers across two sections of an Introduction to Managerial Finance course at a small, teaching institution in the southwest. The student reflection papers were based on the four-phase Experiential Learning Model (Kolb, 1984). This research constructed four themes: (1) laziness and poor decisions, (2) multiple causes, (3) low wages, and (4) importance of education.
As outlined in Theme 1, students originally held that poverty is caused by laziness and poor decision-making. This finding aligns with research demonstrating that college students may have negative attitudes and hold internal attributions of poverty (Hunt, 2004). Theme 2 showed that students believed that poverty was caused by multiple factors aligning with the literature on internal and structural factors (Brady, 2019; Rank et al, 2003; Semega et al., 2020). In theme 3, many students shared that low wages are a primary contributor of poverty (Miao, 2020). This is not surprising given that all student-participant were placed into low-wage jobs in the simulation. Lastly, it is not surprising that students shared the importance of education as a tool to escape poverty (Theme 4). Lack of education, in the literature, has been well-documented as a cause of poverty (Semega et al., 2020).
This study adds to the emerging body of literature demonstrating that SPENT is an effective tool in changing students’ attitudes toward poverty (Hernández-Ramos et al., 2019; Smith et al., 2016; 2017). However, this research is not without limitations. Although these findings cannot be generalized to all college students, they reflect this particular group of student participants. As noted by Chick (2018), students’ participation may be tied to their adoration of the instructor or feeling as if the instructor might fail them for not participating. To remedy this issue, the instructor followed strict IRB protocols. Further, this research has implications for college instructors whose courses have an emphasis on poverty. These might include but are not limited to sociology, business, and human services. Future mixed-methods research might use both an attitude toward poverty scale (Blair et al., 2014) and student reflection paper data.
References
Blair, K. D., Brown, M., Schoepflin, T., & Taylor, D. B. (2014). Validation of a tool to assess and track undergraduate attitudes toward those living in poverty. Research on Social Work Practice, 24(4), 448-461. https://doi.org/10.1177/1049731513497404
Brady, D. (2019). Theories of the causes of poverty. Annual Review of Sociology, 45(1), 155- 175. https://www.annualreviews.org/doi/full/10.1146/annurev-soc-073018-022550
Braun, V., & Clarke, V. (2006). Using thematic analysis in psychology. Qualitative Research in Psychology, 3(2), 77-101. https://doi.org/10.1191/1478088706qp063oa
Chick, N. (2018). SoTL in action: Illuminating critical moments of practice. Stylus Publishing, LLC.
Columbia University Center on Poverty and Social Policy. (2022, October). Monthly Poverty Rate. https://www.povertycenter.columbia.edu/forecasting-monthly-poverty-data
Creamer, J. F., Shrider, E. A., Burns, K., & Chen, F. (2022). Poverty in the United States: 2021. (Report No. P60-277). United States Census Bureau. https://www.census.gov/data/tables/2022/demo/income-poverty/p60-277.html
Crouse, G. Hauan, S. & Rogers, A. (2008). Indicators of welfare dependence: Annual report to Congress, 2008. U.S. Department of Health & Human Services, Office of the Assistant Secretary for Planning and Evaluation. Retrieved from https://aspe.hhs.gov/report/indicators-welfare-dependence-annual-report-congress-2008/chapter-ii-indicators-dependence
Ekins, E. E. (2019). What Americans think about poverty, wealth, and work: Findings from the Cato Institute. Cato Institute. Retrieved from https://www.cato.org/publications/survey-reports/what-americans-think-about-poverty-wealth-work#
Gierach, M. R., & Nesiba, R. F. (2018). What can teaching economists learn from poverty simulations run by nursing faculty? International Journal of Pluralism and Economics Education, 9(1), 128-143. https://doi.org/10.1504/IJPEE.2018.092232
Hernández-Ramos, P., Bachen, C., Raphael, C., Ifcher, J., & Broghammer, M. (2019). Experiencing poverty in an online simulation: Effects on players’ beliefs, attitudes and behaviors about poverty. Cyberpsychology: Journal of Psychosocial Research on Cyberspace, 13(3), 15-34. https://doi.org/10.5817/CP2019-3-1
Hunt, M. O. (2004). Race/ethnicity and beliefs about wealth and poverty. Social Science Quarterly, 85(3), 827-853. https://doi.org/10.1111/j.0038-4941.2004.00247.x
Kolb, D. A. (1984). Experiential learning: Experience as the source of learning and development. Englewood Cliffs, NJ: Prentice-Hall.
McKinney. (2011, Feb). SPENT: The first online game about homelessness. https://mckinney.com/2011/02/09/SPENT-the-first-online-game-about-homelessness/
Miao, H. (2020, November 19). Walmart and Mcdonald’s are among top employers of Medicaid and Food Stamp beneficiaries, report says. CNBC. https://www.cnbc.com/2020/11/19/walmart-and-mcdonalds-among-top-employers-of-medicaid-and-food-stamp-beneficiaries.html
Mutikani, L. (2022, May 31). Rising cost of living hurts U.S. consumer confidence; house prices soar. Reuters. https://www.reuters.com/markets/us/us-consumer-confidence-dips-may-survey-2022-05-31/
Rank, M. R., Yoon, H.-S., & Hirschl, T. A. (2003). American poverty as a structural failing: 197 Evidence and arguments. Journal of Sociology and Social Welfare, 30(4), 3–29. https://psycnet.apa.org/record/2004-12331-001
Semega, J. L., Kollar, M. A., Shrider, E. A., & Creamer, J. F. (2020). Income and poverty in the United States: 2019 (Report No. P60-270). United States Census Bureau, Current Population Survey. https://www.census.gov/library/publications/2020/demo/p60-270.html
Smith, C., Ryder, P., Bilodeau, A., & Schultz, M. (2016). Use of an online game to evaluate health professions students’ attitudes toward people in poverty. American Journal of Pharmaceutical Education, 80(8). https://doi.org/10.5688/ajpe808139
Smith, C., Ryder, P., Blais, M., & Schneck, R. (2017). Evaluation of two different poverty simulations with professional phase pharmacy students. Currents in Pharmacy Teaching and Learning, 9(5), 903-910. https://doi.org/10.1016/j.cptl.2017.05.018
U.S. Department of Labor. (n.d.). Federal minimum wage rates under the Fair Labor Standards Act. https://www.dol.gov/sites/dolgov/files/WHD/legacy/files/chart.pdf
Urban Ministries of Durham. (2021). Play SPENT. https://www.umdurham.org/SPENT.html
US Department of Labor Bureau of Labor Statistics. (2022, June 10). Consumer price index: May 2022. https://www.bls.gov/news.release/pdf/cpi.pdf
US Inflation Calculator. (2022, June). Current US inflation rates: 2000-2022. https://www.usinflationcalculator.com/inflation/current-inflation-rates/
Vandsburger, E., Duncan-Daston, R., Akerson, E., & Dillon, T. (2010). The effects of poverty simulation, an experiential learning modality, on students’ understanding of life in poverty. Journal of Teaching in Social Work, 30(3), 300-316. https://doi.org/10.1080/08841233.2010.497129
