Sampling Plans and Strategies
In this chapter, we will focus on sampling plans, which is really how researchers choose who (their participants) or what to include as part of their study.
Content:
- The Purpose of Sampling
- Comparing a Population and a Sample
- Basics Concepts Related to Sampling
- Inclusion and Exclusion Criteria in Sampling
- Ethical Considerations in Inclusion and Exclusion Criteria
- Probability vs. Nonprobability Samples
- Sampling Strategies in Qualitative and Quantitative Research
- Specific EBP Considerations in Sampling
Objectives:
- Understand the purpose of sampling in research.
- Differentiate between a population and a sample.
- Identify basic concepts related to sampling.
- Determine inclusion and exclusion criteria in sampling.
- Analyze ethical considerations in sampling.
- Distinguish between probability and nonprobability sampling.
- Explore sampling strategies in qualitative and quantitative sampling.
- Examine EBP considerations in sampling.
Key Terms:
Population: The entire group of individuals or entities that a researcher is interested in studying. In quantitative research, the goal is often to generalize findings from the sample to this broader group.
Sample: A subset of the population selected for participation in the study. The sample should ideally represent the population to allow for valid inferences.
Sampling Frame: A list or database that includes all members of the population from which the sample will be drawn. A complete and accurate sampling frame is essential for representative sampling.
Probability Sampling: A sampling method in which every member of the population has a known, non-zero chance of being selected. This includes techniques like simple random sampling, stratified sampling, and cluster sampling, commonly used in quantitative research.
Non-Probability Sampling: A sampling method where not all members of the population have a chance of being selected. This includes techniques like convenience sampling, purposive sampling, and snowball sampling, often used in qualitative research.
Random Sampling: A probability sampling technique where each member of the population has an equal chance of being selected, often used to reduce bias and enhance the representativeness of the sample.
Stratified Sampling: A probability sampling method where the population is divided into subgroups (strata) based on a characteristic, and random samples are drawn from each stratum. This ensures representation of key subgroups in the sample.
Purposive Sampling: A non-probability sampling method where participants are selected based on specific characteristics or qualities relevant to the research question, commonly used in qualitative research to gain deep insights.
Convenience Sampling: A non-probability sampling method where participants are selected based on ease of access and availability. This method is quick and inexpensive but may introduce bias.
Snowball Sampling: A non-probability sampling method often used in qualitative research where existing study participants recruit future participants from among their acquaintances. This is useful for reaching hard-to-access populations.
Sampling Bias: A systematic error that occurs when the sample is not representative of the population, often due to flaws in the sampling process, leading to skewed results.
Saturation: A concept in qualitative research where data collection continues until no new information or themes are emerging from the data, indicating that the sample size is sufficient.
Introduction
Sampling is a critical element in the research process that affects study findings’ validity, reliability, and generalizability (Elfil & Negida, 2017). For nursing students, understanding the nuances of sampling is essential for both conducting research and evaluating the research of others. Bhardwai (2019) states that sampling is one of the most important factors which determines accuracy of a study. This chapter will explore the foundational concepts of sampling, explain the rationale for sampling, and discuss various strategies and considerations involved in selecting and analyzing samples.
The Purpose of Sampling
In most research studies, collecting data from an entire population is often impractical, if not impossible, due to constraints such as time, cost, and accessibility. Sometimes, it is possible, to obtain data from an entire population, such as in a study performed in the 2016 Minnesota Student Survey in which a population study was conducted from the male student population (Taliaferro et al., 2020). However, most often, researchers use a sample—a subset of the population—to represent the larger group. Sampling allows researchers to make inferences about the population without the need to study every individual. This approach is more feasible and allows for more detailed and focused data collection and analysis.
Sampling is defined as a procedure to select a representative group from the larger population (Bhardwaj, 2019). Sampling is “a method that allows researchers to infer information about a population based on results from a subset of the population, without having to investigate every individual” (Barratt & Shantikumar, 2018). The goal of sampling is to make accurate inferences about a whole population based on data collected from a smaller group within that population, known as a sample. Although it is sometimes feasible and beneficial to gather information from an entire population, researchers often opt for sampling due to practicality and cost-effectiveness. For instance, Taliaferro et al. (2020) conducted a secondary analysis using data from the 2016 Minnesota Student Survey, which encompassed adolescent boys, to investigate risk factors and involvement in physical violence and bullying. Their findings showed that 13.2% of the boys engaged in physical violence, while 21.6% were involved in bullying. The study also highlighted that high-risk adolescents with limited connections to parents or other adults were more likely to partake in these behaviors.
In most research scenarios, using a sample instead of the entire population is more efficient and manageable. Studying an entire population can be nearly impossible or impractical, even if it is the group the researcher aims to generalize the findings to. Thus, sampling methods are designed to select a representative subset of the population to accurately reflect the broader group (Boswell & Cannon, 2022).
For another example, in a study exploring the effectiveness of a new nursing intervention on patient recovery times, it would be impractical to include all patients across multiple hospitals. Instead, a representative sample of patients can be selected, and the findings from this group can be used to infer the intervention’s effectiveness for the broader population.
Comparing a Population and a Sample
A population refers to the entire group of individuals or elements that are the focus of a research study. This group might include all patients with a specific health condition, all nurses in a particular hospital, or all residents of a community. The population is the target of the study’s conclusions, but because it is usually too large to study in its entirety, researchers turn to sampling.
A sample, on the other hand, is a smaller, manageable subset of the population selected for study. The goal is to ensure that the sample is representative of the population, meaning the findings from the sample can be generalized to the population with a reasonable level of confidence. The representativeness of the sample is critical to the validity of the research outcomes.
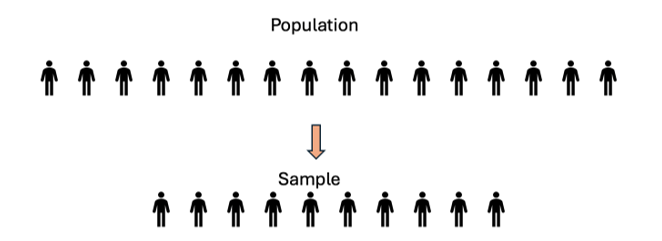
Figure Above: Population vs. Sample
Basic Concepts Related to Sampling
Several key concepts underpin the practice of sampling in research:
- Representativeness: A sample is representative if it accurately reflects the characteristics of the population from which it is drawn. Ensuring representativeness is crucial for the validity of the study’s conclusions.
- Sampling Bias: This occurs when certain members of the population are more likely to be included in the sample than others, leading to distorted or unrepresentative findings. Sampling bias can arise from improper sampling methods or non-random selection.
- Sampling Frame: The sampling frame is a list or database from which a sample is drawn. It should ideally include all members of the population, though in practice, it may exclude some individuals due to accessibility issues.
- Sampling Error: Sampling error refers to the difference between the characteristics of the sample and those of the population. While some level of sampling error is inevitable, it can be minimized by using appropriate sampling techniques.
Practical Application: Developing a Sampling Plan
A researcher is planning a study to assess the effectiveness of a new stress management program for nursing students. The goal is to develop a sample that includes a diverse range of students from various nursing programs and backgrounds.
Activity:
The researcher decides to use stratified random sampling to ensure that different subgroups, such as first-year and final-year students, are equally represented. Invitations to participate are sent via email to students from all nursing programs at the university.
Ethical Issue:
During recruitment, some students express concern that participation may affect their academic standing or relationship with faculty, even though the study is voluntary and anonymous. This raises ethical concerns about potential coercion and the need to emphasize that participation is completely optional and will not impact students’ academic status.
Conclusion
This scenario highlights the importance of clearly communicating the voluntary nature of participation and ensuring that potential participants understand there are no consequences for opting out. Researchers must take steps to protect participants from any perceived pressure and uphold ethical standards throughout the sampling process.
Inclusion and Exclusion Criteria in Sampling
Inclusion and exclusion criteria are essential for defining who is eligible to participate in a study. Establishing inclusion and exclusion criteria for study participants is a standard, required practice when designing high-quality research protocols (Patino & Ferreira, 2018). Inclusion criteria are defined as the key features of the target population that the investigators will use to answer their research question (Boswell & Cannon, 2022). Exclusion criteria are key features that would not be eligible to be part of the sample. Therefore, exclusion criteria are essential in research for controlling confounding variables. These exclusion criteria are characteristics that may interfere with the study’s outcomes. Typical inclusion criteria include demographic, clinical, and geographic characteristics.
For example, what might be your criteria for including someone from participation? Are any criteria based on age, gender, race, ethnicity, sexual orientation, origin, type and stage of disease, the subject’s previous treatment history, and the presence or absence (as in the case of the “healthy” or “control” subject) of other medical, psychosocial, or emotional conditions? If so, justify. For example, if you are doing a study on pregnant persons, will you exclude men (most likely, you will)? If you exclude men, even if it seems obvious, this needs to be determined and stated.
- Inclusion Criteria: These are the characteristics that participants must have to be included in the study. Inclusion criteria help ensure that the sample is relevant to the research question and that the findings will be applicable to the population of interest. For example, in a study on diabetic patients, inclusion criteria might include being diagnosed with Type 2 diabetes and being over the age of 18.
- Exclusion Criteria: These are the characteristics that disqualify potential participants from the study. Exclusion criteria are used to remove individuals who might confound the results or who do not fit the study’s focus. Continuing the example above, exclusion criteria might include pregnant patients or other chronic conditions that could interfere with the study outcomes.
Here is an example of inclusion and exclusion criteria for a study of success rates in associate degree nursing programs:
Inclusion criteria includes the following: Completion of Associate Degree of Nursing program, English as a second language students, enrollment at one of the pre-selected community colleges, and completion of prerequisite biological science courses at same college.
Exclusion criteria for eligibility includes age of either gender (>18 years of age only), students who did not complete the ADN program, repeat nursing program completers, and transcripts with incomplete data (missing A&P, Chemistry, or Genetics). There will not be an exclusion for gender or any age over 18.
The careful selection of inclusion and exclusion criteria is critical to the integrity of the study, as it helps to ensure that the sample is both relevant and homogeneous, thus reducing variability in the data.
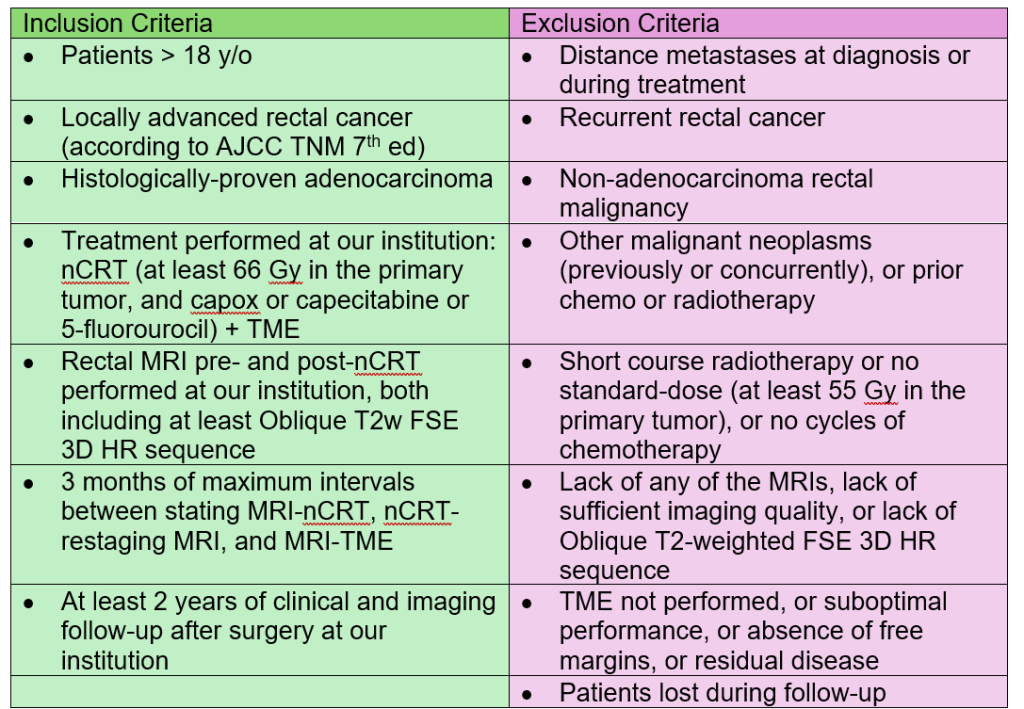
Table Above: Inclusion and Exclusion Criteria Example
Internal Validity in Relation to Inclusion and Exclusion Criteria
Inclusion and exclusion criteria play a crucial role in maintaining internal validity by ensuring that the sample is well-defined and free from confounding variables. Internal validity refers to the extent to which a study can confidently establish a cause-and-effect relationship between the independent and dependent variables, without interference from extraneous factors.
Internal validity refers to the degree to which a study accurately establishes a cause-and-effect relationship between variables, without being influenced by confounding factors or biases. A study with high internal validity ensures that the observed changes in the dependent variable are directly caused by the independent variable, rather than by extraneous influences.
For example, in a clinical trial testing a new blood pressure medication, high internal validity means that any reduction in blood pressure can be confidently attributed to the medication itself, rather than factors like diet, stress levels, or researcher bias.
By carefully selecting inclusion criteria, researchers ensure that participants share key characteristics relevant to the research question, reducing variability that might obscure true relationships. For example, in a study evaluating a new diabetes medication, including only patients diagnosed with Type 2 diabetes (rather than all diabetic patients) helps isolate the treatment effect.
Similarly, exclusion criteria help eliminate confounding variables that could weaken internal validity (Garg, 2016). For instance, excluding participants with multiple chronic conditions in the diabetes study ensures that changes in blood sugar levels are due to the medication rather than other underlying health conditions. However, while strict inclusion/exclusion criteria strengthen internal validity, they may limit external validity, meaning the findings may not be generalizable to a broader population. Researchers must carefully balance internal control and real-world applicability when designing studies.
External Validity in Relation to Inclusion and Exclusion Criteria
External validity refers to the extent to which the findings of a study can be generalized to other populations, settings, and times. A study with high external validity produces results that are applicable beyond the specific sample and conditions of the research, making it useful for real-world practice.
Inclusion and exclusion criteria directly impact external validity by determining how well a study’s findings can be generalized to broader populations. External validity refers to the extent to which research results apply to people, settings, and situations beyond the study sample.
If inclusion and exclusion criteria are too restrictive, the study may have high internal validity but low external validity, meaning the findings are not widely applicable. For example, a clinical trial testing a new hypertension medication might only include healthy adults aged 40-60, excluding those with multiple chronic conditions. While this approach controls confounding variables, it also limits the study’s generalizability to older adults or patients with comorbidities who are more representative of real-world hypertension cases.
Conversely, if inclusion criteria are too broad, external validity may improve, but internal validity may suffer due to increased variability in patient characteristics. Researchers must strike a balance—ensuring that the sample reflects the target population while maintaining control over confounding factors. Well-designed inclusion and exclusion criteria help create findings that are both scientifically rigorous and applicable to real-world clinical practice.
Ethical Considerations in Inclusion and Exclusion Criteria
When establishing inclusion and exclusion criteria, researchers must carefully navigate ethical considerations to ensure that the study is conducted fairly and respects the rights and well-being of all potential participants (Velasco, 2010). Inclusion and exclusion criteria are essential for defining the study population, but these criteria can also raise ethical issues related to equity, justice, and the protection of vulnerable groups.
Equity and Fairness
One ethical concern is ensuring that the inclusion criteria do not unjustly favor or exclude certain groups. For instance, a study might inadvertently exclude participants based on factors such as age, gender, ethnicity, or socioeconomic status, which could lead to biased findings and limit the generalizability of the results. Researchers have an ethical responsibility to ensure that the criteria are justified and that any exclusions are necessary and relevant to the study’s objectives. For example, if a study excludes elderly patients, the justification should be clearly tied to the research question and not based on assumptions or stereotypes.
Justice and Access to Research Benefits
The principle of justice requires that the benefits and burdens of research be distributed fairly among all groups in society (Polit & Beck, 2021). Excluding certain populations without adequate justification can deny them the potential benefits of participating in research, such as access to new treatments or interventions. Conversely, including participants who are unlikely to benefit from the research can be ethically problematic, especially if participation poses any risk (Hopp & Rittenmeyer, 2020). Researchers must balance the need to protect vulnerable populations with the ethical obligation to provide equitable access to research opportunities.
Protection of Vulnerable Groups
Vulnerable populations, such as children, pregnant women, individuals with cognitive impairments, or economically disadvantaged groups, require special consideration in the inclusion and exclusion criteria (Polit & Beck, 2021). Researchers must ensure that these groups are not exploited or exposed to unnecessary risks. At the same time, excluding vulnerable groups entirely can lead to a lack of research evidence that is relevant to these populations, which can have negative implications for their care. Ethical research design should carefully weigh the risks and benefits, providing additional protections when including vulnerable participants, such as obtaining assent along with parental consent for minors or implementing enhanced monitoring for high-risk groups (Cipriano, 2015).
Institution Review Board’s Role Related to Sampling
All research that involves human subjects must apply to an ethics board or Institutional Review Board before any part of the research begins. An Institutional Review Board (IRB) plays a crucial role in ensuring that research involving human participants is ethically sound, just, and equitable. One of its primary responsibilities is to review inclusion and exclusion criteria to prevent unjust participant selection and ensure that research findings are applicable to diverse populations (Cipriano, 2015). The IRB ensures that all individuals have fair access to participation unless scientifically justified exclusions are necessary.
- Preventing Unjust Exclusion of Vulnerable Groups
The IRB ensures that inclusion and exclusion criteria do not unfairly exclude individuals based on factors such as race, ethnicity, gender, socioeconomic status, or disability, unless exclusion is necessary for scientific validity. For example, a study on hypertension treatments should not exclude women or minority populations unless there is a strong scientific or safety-related reason.
- Justifying Inclusion and Exclusion Criteria
Researchers must provide a clear, scientific justification for inclusion and exclusion decisions. The IRB reviews whether:
- Exclusions are based on valid safety concerns (e.g., pregnant women in a drug trial where fetal harm is unknown).
- The study population reflects the group affected by the condition being studied.
- The criteria do not systematically exclude certain populations, limiting the generalizability of results.
- Promoting Justice in Participant Selection
The Belmont Report’s principle of justice states that the burdens and benefits of research should be fairly distributed. The IRB ensures that researchers do not target disadvantaged groups (e.g., low-income individuals, prisoners) unfairly while also ensuring that underrepresented populations are not automatically excluded from research that could benefit them.
- Addressing Ethical Concerns in Sampling Methods
The IRB evaluates whether recruitment methods promote equal opportunity for participation and prevent coercion. This includes:
- Ensuring recruitment strategies do not pressure participants (e.g., students should not feel forced to participate in faculty-led studies).
- Avoiding convenience sampling that might exclude underrepresented populations.
- Assessing whether incentives for participation are appropriate and not coercive.
- Protecting Participants’ Rights and Well-Being
Beyond fair inclusion and exclusion, the IRB ensures that:
- Participants understand their rights through informed consent.
- Vulnerable populations (e.g., children, individuals with cognitive impairments) have added protections (e.g., parental consent, legally authorized representatives).
- The study does not place undue burden on specific groups while denying them potential benefits of research.
By thoughtfully addressing these ethical considerations in the design of inclusion and exclusion criteria, researchers can ensure that their studies are both scientifically valid and ethically sound, ultimately contributing to the production of evidence that is both fair and applicable to diverse populations.
Probability vs. Nonprobability Sampling
Sampling methods can be broadly classified into two categories: probability and nonprobability sampling.
- Probability Sampling: In probability sampling, every member of the population has a known, non-zero chance of being selected. This approach enhances the likelihood that the sample will be representative of the population. Common types of probability sampling include:
- Simple Random Sampling: Every individual in the population has an equal chance of being selected.
- Systematic Sampling: Selection is made at regular intervals from a randomly ordered list.
- Stratified Sampling: The population is divided into subgroups (strata) based on specific characteristics, and random samples are drawn from each stratum.
- Cluster Sampling: The population is divided into clusters, typically based on geographical areas, and entire clusters are randomly selected for study.
- Nonprobability Sampling: In nonprobability sampling, the likelihood of any individual being selected is unknown. This type of sampling does not include random selection of elements and therefore has a higher possibility of yielding a potentially biased, nonrepresentative sample (Boswell & Cannon, 2020). This method is often used in exploratory research or when probability sampling is impractical. Common types of nonprobability sampling include:
- Convenience Sampling: Participants are selected based on availability and willingness to participate.
- Purposive Sampling: Participants are selected based on specific characteristics that are relevant to the study.
- Snowball Sampling: Current participants recruit future participants from among their acquaintances, which is useful for studying hard-to-reach populations.
- Quota Sampling: The researcher ensures that certain characteristics are represented in the sample in proportion to their prevalence in the population.
| Sampling Method | Type | Description | Example in Research |
| Simple Random Sampling | Probability | Every member of the population has an equal chance of being selected, often using random number generators or lottery methods. | A research randomly selects 100 nurses from a hospital’s staff list to study job satisfaction. |
| Systematic Sampling | Probability | A method were every nth individual is selected from an ordered list after choosing a random starting point. | A hospital survey selects every 10th patient from a list of discharged individuals. |
| Stratified Sampling | Probability | The population is divided into subgroups (strata) based on characteristics (e.g., age, gender), and random samples are taken from each stratum. | A study on nursing burnout selects an equal number of nurses from ICU, pediatrics, and emergency departments. |
| Cluster Sampling | Probability | The population is divided into clusters (often geographic or institutional), and entire clusters are randomly selected. | A national study on healthcare access randomly selects five hospitals and surveys all their patients. |
| Multistage Sampling | Probability | A combination of different probability sampling techniques, often selecting clusters first and then sampling within them. | A national study randomly selects hospitals (clusters) and then randomly selects nurses from those hospitals. |
| Purposive Sampling | Nonprobability | Participants are handpicked based on specific characteristics relevant to the study. | A study on wound care in diabetes selects only patients with diabetic foot ulcers. |
| Snowball Sampling | Nonprobability | Existing participants recruit others who fit the study criteria, useful for hard-to-reach populations. | A study on homeless individuals’ access to healthcare asks participants to refer others they know. |
| Quota Sampling | Nonprobability | Researchers ensure that the sample meets predetermined quotas for certain characteristics (e.g., age, gender). | A study on patient satisfaction ensures that 40% of participants are male and 60% are female. |
Table Above: Sampling Methods in Research
The following video discusses sampling as well as data collection. Data collection will be discussed in the next chapter.
Ponder This
If your study’s sample ends of being not fully representative of the population, how might this impact the conclusions you draw and the generalizability of your findings? Consider the potential implications for your study’s credibility and the application of its results in real-world settings.
Sampling Strategies in Qualitative and Quantitative Research
The choice of sampling strategy depends on the research approach—qualitative or quantitative—and the specific research question.
- Quantitative Research: Quantitative research often employs probability sampling methods to ensure that the sample is representative of the population and that the findings can be generalized. For example, in a randomized controlled trial (RCT) testing a new drug, simple random sampling might be used to select participants from a pool of eligible patients, ensuring each patient has an equal chance of being included.
- Qualitative Research: Qualitative research typically uses nonprobability sampling methods to explore specific phenomena in depth. The focus is on gaining a deep understanding of a particular context or experience rather than generalizing findings to a larger population. For instance, in a phenomenological study exploring the lived experiences of patients undergoing chemotherapy, purposive sampling might be used to select participants who meet specific criteria, such as those who have completed at least three cycles of chemotherapy.
Determining Sample Size
Determining the appropriate sample size is a critical aspect of research design, influencing the study’s validity and generalizability. Once the researcher has decided who to sample, how the sampling will be done, and where to obtain the sample from, it is then time to decide how many to sample. This is called the sample size.
Quantitative Research
In quantitative studies, determining an appropriate sample size is influenced by several key factors, including characteristics of the population, research design, measurement considerations, and practical constraints. The sample size is often also determined by statistical considerations. A larger sample size increases the power of the study, reducing the likelihood of Type I and Type II errors (to be discussed later in this book). Researchers often use power analysis to calculate the minimum sample size needed to detect a statistically significant effect. A power analysis is a calculation used to estimate the smallest sample size needed for an experiment, given a required significance level, statistical power, and effect size (Polit & Beck, 2021). Factors influencing sample size in quantitative research include the expected effect size, the desired level of confidence, and the study design.
Population factors play a crucial role in sample size decisions, which includes the homogeneity of the population. In a population that is homogenous, the sample size can be smaller than if the population were more heterogenous (Boswell & Cannon, 2020). The variability within a population affects how large a sample must be to accurately represent the group; greater diversity requires a larger sample to reduce the margin of error. Similarly, the overall size of the population, while not always directly dictating sample size, can impact feasibility, particularly if the population is small or difficult to access. Some populations, such as individuals with rare medical conditions or professionals in highly specialized fields, may present challenges in recruitment, naturally limiting sample size.
The design of a study also significantly impacts the number of participants needed. Experimental studies, particularly those involving control and treatment groups, require larger sample sizes to ensure meaningful comparisons. When multiple groups or subgroups are included, such as demographic categories or different intervention groups, the sample must be large enough to provide adequate representation for each. Additionally, longitudinal studies, which track participants over time, often require an even greater number of participants at the outset to compensate for inevitable attrition, as some individuals drop out before the study concludes.
Measurement factors further influence sample size considerations. The reliability and precision of the tools used to measure variables can affect the number of participants required; highly reliable instruments allow for smaller samples, whereas less precise measures necessitate a larger sample to minimize error. Effect size, which refers to the magnitude of a difference or relationship between variables, is another determining factor. When an effect is expected to be small, a larger sample is needed to detect it with statistical significance. Similarly, ensuring sufficient statistical power, typically set at 0.80 or 80%, requires an adequately sized sample to reduce the likelihood of false-negative results.
Despite the scientific and methodological justifications for larger samples, practical considerations often impose limits. Resources such as time, funding, and personnel influence how many participants can realistically be recruited and studied. Ethical considerations also come into play, particularly in studies involving human subjects, where unnecessary recruitment of participants could be seen as wasteful or even harmful. The willingness and availability of participants can further constrain sample size, especially in cases where the study demands significant time commitments or deals with sensitive topics.
Qualitative Research
In contrast to quantitative research, qualitative research relies on smaller, non-random sample sizes that prioritize depth over breadth. Rather than striving for statistical generalizability, qualitative studies seek to capture rich, detailed insights from participants who have firsthand experience with the phenomenon under investigation. Researchers often use purposeful sampling methods, selecting individuals who can provide meaningful perspectives rather than drawing from a large, random pool. Unlike quantitative studies, where sample size is determined by statistical formulas, qualitative research relies on the concept of data saturation—the point at which additional data collection no longer yields new themes or insights. Because qualitative methods typically involve in-depth interviews, observations, and textual analysis, a smaller number of participants is sufficient to achieve meaningful results with the focus on depth rather than breadth. The sample size is often guided by the concept of data saturation, the point at which no new themes or insights are emerging from the data. The exact number of participants needed to reach saturation can vary depending on the study’s scope and complexity.
Flexibility is an inherent characteristic of qualitative sample sizes, as researchers may adjust the number of participants as the study progresses based on the richness of the data being collected. Practical considerations also come into play, as qualitative studies often require significant time for data collection and analysis, making large sample sizes impractical. While qualitative research does not aim for statistical representation, its strength lies in its ability to provide nuanced, contextually rich understandings of complex human experiences, making small, carefully chosen samples both necessary and effective.
Generalizability in Sampling
Generalizability refers to the extent to which research findings from a sample can be accurately applied to the larger population. In order for a study to be generalizable, the sample must be representative, meaning it closely reflects the characteristics of the population being studied. Probability sampling methods, such as random sampling and stratified sampling, enhance generalizability by reducing selection bias and ensuring diverse participant inclusion. However, nonprobability sampling methods, like convenience or purposive sampling, may limit generalizability because they do not guarantee that the sample reflects the broader population. Poor generalizability can lead to research findings that are not applicable to real-world settings, reducing the study’s usefulness in evidence-based practice and policy-making.
Evaluating Populations and Sampling Plans in Research Reports
In evaluating the strength of evidence presented in research reports, it is crucial to assess the populations and sampling plans used. Key considerations include:
- Representativeness: Is the sample representative of the population? Does the sampling method reduce the risk of bias?
- Sampling Strategy: Is the sampling strategy appropriate for the research question and design? Are the inclusion and exclusion criteria clearly defined and justified?
- Sample Size: Is the sample size adequate to support the conclusions drawn? Was a power analysis conducted in quantitative studies?
- Generalizability: Can the findings be generalized to the broader population, or are they limited to the specific sample studied?
Ponder This
You are conducting a study on the dietary habits of nursing students on your university. You decide to recruit participants by posting flyers in the school cafeteria, where many students gather for meals. However, as the study progresses, you notice that most participants are from the same department and have similar schedules, which may not represent the broader student population.
![]() Hot Tip! When designing a sampling plan, always ensure your sample is as representative as possible for the target population. This increases generalizability of your study findings and strengthens the overall validity of your research.
Hot Tip! When designing a sampling plan, always ensure your sample is as representative as possible for the target population. This increases generalizability of your study findings and strengthens the overall validity of your research.
Specific EBP Considerations in Sampling
In evidence-based practice (EBP), the quality of evidence is paramount, and sampling plays a significant role in determining that quality. Researchers must ensure that the sample is not only representative but also relevant to clinical practice. This involves carefully selecting inclusion criteria that reflect the patient population in question and using sampling methods that minimize bias.
Moreover, in EBP, the emphasis is on translating research findings into practice. Therefore, the sample should include individuals or cases that closely resemble the population to which the findings will be applied. This consideration enhances the external validity of the research, ensuring that the results are applicable to real-world clinical settings.
In conclusion, sampling is a critical component of research that requires careful consideration and planning. By understanding the different sampling methods, determining the appropriate sample size, and evaluating the sampling strategies used in research reports, nursing students and professionals can contribute to the generation and application of high-quality evidence in clinical practice.
![]() Critical Appraisal!
Critical Appraisal!
- Is the target population clearly defined, and does the sampling plan align with this population?
- What sampling method was used (e.g., random, stratified, convenience), and is it appropriate for the study design and objectives?
- Is the sample size justified, and was a power analysis conducted to determine the adequacy of the sample size?
- Are the inclusion and exclusion criteria clearly stated, and do they make sense for the study’s goals?
- Is the sample representative of the population, and were efforts made to minimize selection bias?
- Were potential sources of sampling bias identified and addressed in the study?
- How were participants recruited, and were recruitment methods likely to yield a diverse and representative sample?
- Were any participants lost or excluded from the sample after selection, and was this accounted for in the analysis?
- Is the sampling plan feasible and ethical, considering the study’s context and population?
- Does the study discuss the potential impact of the sampling plan on the validity and reliability of the findings?
- Are the demographics of the sample adequately described, and do they reflect the intended population?
- How does the sampling plan affect the generalizability of the study’s findings?
Summary Points
- Sampling is essential in research because studying an entire population is often impractical due to time, cost, and accessibility constraints.
- The purpose of sampling is to allow researchers to make accurate inferences about a population based on a smaller, representative subset.
- A population refers to the entire group of interest in a study, whereas a sample is a smaller, selected subset that represents the population.
- Representativeness is critical to ensuring the validity and generalizability of research findings.
- Sampling bias occurs when certain groups are over- or under-represented in the sample, leading to distorted or unreliable results.
- A sampling frame is the list or database from which a sample is drawn, ideally including all individuals in the population.
- Sampling error is the difference between a sample’s characteristics and those of the overall population. Using proper sampling techniques can help minimize errors.
- Inclusion criteria define who can participate in a study, ensuring that the selected sample is relevant to the research question.
- Exclusion criteria specify who cannot participate, often used to remove individuals who might confound the study results.
- Ethical considerations in sampling require researchers to ensure equity, justice, and protection of vulnerable populations when setting inclusion and exclusion criteria.
- Probability sampling (e.g., random, stratified, systematic, and cluster sampling) gives all population members a known chance of selection, increasing the likelihood of a representative sample.
- Nonprobability sampling (e.g., convenience, purposive, snowball, and quota sampling) is useful when random selection is not feasible but may introduce bias and limit generalizability.
- Sample size determination is crucial—quantitative studies require power analysis to ensure statistical significance, while qualitative studies use data saturation to determine an adequate sample size.
- Sampling strategies differ based on research type—quantitative research prioritizes representativeness and generalizability, while qualitative research focuses on depth and meaning.
- Evaluating sampling methods in research reports helps determine if a study’s findings are reliable and applicable to real-world clinical settings.
- In evidence-based practice (EBP), the sample must be carefully chosen to closely resemble the target population to ensure the findings are applicable to clinical care.
- Researchers must ensure that participation is voluntary and that individuals understand that refusing participation will not affect their medical care or academic standing.
- Poor sampling methods can undermine research credibility by introducing bias, limiting generalizability, or leading to incorrect conclusion.
Case Study: Sampling Strategies in Nursing Research
A research team at a large urban hospital was tasked with evaluating the effectiveness of a new patient education program aimed at reducing hospital readmission rates among heart failure patients. The goal was to determine whether the education program, which included personalized counseling sessions and follow-up calls, would lead to improved patient outcomes compared to the standard discharge process. Given the diversity of the hospital’s patient population, the research team needed to carefully design a sampling strategy that would provide reliable and generalizable results.
Actions Taken
The research team began by defining the population of interest: all adult patients diagnosed with heart failure and discharged from the hospital over the past year. Given the study’s objectives, the team recognized the importance of selecting a representative sample that accurately reflected this population’s diversity in terms of age, gender, ethnicity, and comorbidities. To achieve this, they opted for a stratified random sampling method, ensuring that key demographic and clinical characteristics were proportionally represented in the sample.
In developing the inclusion and exclusion criteria, the team focused on ethical considerations. They decided to include all adult patients with a confirmed diagnosis of heart failure who had been discharged within the last six months. However, they excluded patients with terminal illnesses, those enrolled in hospice care, and those with severe cognitive impairments that could affect their ability to participate in the education program. The team justified these exclusions by noting that the education program was not designed for end-of-life care and that participants needed to fully understand the material presented to benefit from it.
To determine the appropriate sample size, the team conducted a power analysis, which indicated that they needed at least 200 participants to detect a statistically significant difference in readmission rates between the intervention and control groups. Given the hospital’s annual heart failure discharge volume, the team calculated that they could achieve this sample size within a three-month recruitment period.
The research team also considered Evidence-Based Practice (EBP) considerations when designing the sampling plan. They ensured that the sample would be relevant to the patient population most likely to benefit from the program in real-world clinical settings. Additionally, they sought to minimize sampling bias by using randomization within each stratum to select participants.
Once the sampling plan was finalized, the team proceeded with recruitment. They randomly selected patients from each stratum, contacted them to explain the study, and obtained informed consent. The participants were then randomly assigned to either the intervention group, which received the patient education program, or the control group, which received the standard discharge process.
Results
The study successfully recruited 210 participants, evenly distributed across the strata. The stratified random sampling method ensured that the sample was representative of the broader heart failure patient population served by the hospital. The analysis revealed that patients in the intervention group had significantly lower readmission rates compared to the control group. Additionally, participants in the intervention group reported higher satisfaction with their discharge experience and greater confidence in managing their condition at home.
The careful consideration of inclusion and exclusion criteria also proved effective. The ethical approach to excluding patients who would not benefit from the program or who were unable to participate meaningfully helped maintain the study’s integrity while protecting vulnerable populations. The study’s sample size was sufficient to detect meaningful differences between the groups, supporting the validity of the findings.
Conclusion
The research team concluded that the patient education program was effective in reducing readmission rates among heart failure patients, and they recommended its implementation across the hospital. The stratified random sampling method, combined with thoughtful inclusion and exclusion criteria, played a crucial role in ensuring that the study’s findings were both reliable and generalizable to the broader population. The study underscored the importance of a well-designed sampling strategy in producing high-quality evidence that can inform clinical practice. By carefully considering the population, sampling methods, and ethical implications, the research team was able to contribute valuable insights to the field of nursing practice.
References & Attribution
“Magnifying glass” by rawpixel licensed CC0
“Orange flame” by rawpixel licensed CC0
Baldwin, P., Evans, J., & Etherington, N. (2015). Youth with disabilities talk about spirituality: A qualitative descriptive study. The Qualitative Report, 20(7).
Barratt, H., & Shantikimar, S. (2018). Methods of sampling from a population. Research Methods. Health Knowledge.
Bhandari, P. (2022). Levels of Measurement | Nominal, Ordinal, Interval and Ratio. Scribbr. https://www.scribbr.com/statistics/levels-of-measurement/
Bhardway, P. (2019). Types of sampling in research. Journal of the Practice of Cardiovascular Services, 5(3), 157-163.
Boswell, C., & Cannon, S. (2022). Introduction to nursing Research: Incorporating evidence-based practice (6th ed.). Jones & Bartlett Learning.
Cipriano, P. F. (2015). Ethical practice environments, empowered nurses. The American Nurse, 47(2), 3. https://pubmed.ncbi.nlm.nih.gov/26827397/
Davis, K.W., Mcmillan, M.A., Perkins, J., Beavan, H.R., Corum, M., Miller, B.J., Drumm, J., Lockwood, S.M., & Simpkins, R.C. (2016). Comparison of outcomes: Nurse-driven vs. physician-driven weight-based intravenous heparin protocol. Medsurg Nurs., 25(6), 385-91.
Elfil, M.,& Negida, A. (2017). Sampling methods in clinical research: An educational review. Emerg (Tehran), 5(1), e52.
Garg, R. (2016). Methodology for research I. Indian Journal of Anesthesia, 60(9), 640-645.
Hopp, L. & Rittenmeyer, L. (2020). Introduction to evidence-based practice (2nd Ed.). F.A. Davis Company.
Polit, D. & Beck, C. (2021). Lippincott CoursePoint Enhanced for Polit’s Essentials of Nursing Research (10th ed.). Wolters Kluwer Health.
Patino, C.M. & Ferreria, J. C. (2018). Inclusion and exclusion criteria in research studies: Definitions and why they matter. J. Bras. Penumol., 44(2), 84.
Santos, L.C., Chaves, C.B., Andrade, A.I. (2013). The influence of stress on the quality of life of hypertension patients. The European Journal of Counseling Psychology, 2(2).
Taliaferro, L. A., Doty, J. L., Gower, A. L., Querna, K., & Rovito, M. J. (2020). Profiles of risk and protection for violence and bullying perpetration among adolescent boys. The Journal of School Health, 90(3), 212–223. https://doi.org/10.1111/josh.12867
Velasco, E. (2010). Inclusion criteria. In Encyclopedia of research design (Vol. 0, pp. 589-591). SAGE Publications, Inc., https://doi.org/10.4135/9781412961288
