1 Equitable Vaccine Access within an Age-Based Framework
Alan B. Cobo-Lewis
Cobo-Lewis, A. B. (2022). Equitable Vaccine Access within an Age-Based Framework. Developmental Disabilities Network Journal, 2(2), 1–14. https://digitalcommons.usu.edu/ddnj/vol2/iss2/2/
Equitable Vaccine Access within an Age-Based Framework PDF File
Abstract
Objectives:
When vaccine supply was limited, several states adopted age-based prioritization for COVID-19 vaccine eligibility because it is simple (especially when age is quantized by decade), and age is strongly associated with COVID-19 mortality. But this approach raises equity concerns based in law and ethics. This study proposes data-driven solutions for equitable policy within an age-based framework.
Methods:
Using the Centers for Disease Control and Prevention (CDC) and U.S. Census Bureau data, 538,627 U.S. COVID-19 deaths were analyzed by age and race-ethnicity through February 2021 and the risk ratios were compared to published data on risk ratios for other conditions.
Results:
COVID-19 mortality rose 2.56-fold per decade of life. Down syndrome, organ transplantation, and intellectual/developmental disability all have risk ratios higher than that.
Conclusions:
People with specific conditions associated with a risk ratio of 2.56 or 6.54 should become vaccine-eligible along with people 10 or 20 years older, respectively. Even as vaccines become more available, data collection and reporting through disability systems should be integrated with general public health systems, including vaccination databases, in order to assess COVID-19 mortality associated with intellectual or developmental disability per se and to make it possible to track vaccine progress in this marginalized population. People from these groups should also be involved in decision making and advisory bodies.
Plain Language Summary
Older people are more likely than younger people to die from COVID-19. Some states have let older people get vaccines before younger people, even if the younger people had disabilities. These states gave 70-year-olds vaccine access, then 60-year-olds vaccine access, and so on. So how much does risk of COVID-19 death go up when people age 10 years? When you are 10 years older, your risk of dying from COVID-19 is 2.6 times higher. People with severe kidney disease and people with intellectual or developmental disabilities who live in group homes are also about 2.6 times as likely to die from COVID-19. People with Down syndrome, people with intellectual or developmental disabilities living in Intermediate Care Facilities (ICFs), and people with organ transplants are even more likely to die from COVID-19. If a state or country lets old people get vaccines early, then they should let people with organ transplants or severe kidney disease get vaccines with people 10 years older. They should let people with intellectual or developmental disabilities in group homes or ICFs get vaccines with people 10 or 20 years older. They should let people with Down syndrome get vaccines with people who are much older. States and countries should also include disability when they report data on COVID-19. This should include vaccination data. They should not segregate data about disability. People from marginalized groups should be included in decision making, and decisions should change with new information.
When COVID-19 vaccines were in short supply in the U.S., several states moved to age-based prioritization for COVID-19 vaccine eligibility (modified to also prioritize teachers and childcare workers, who President Biden identified as a federal priority based on their role as essential workers for reopening schools rather than on increased COVID-19 risk per se). There was substantial variability in how states consider disability (Johns Hopkins Disability Health Research Center & Center for Dignity in Healthcare for People with Disabilities, 2021), but as of March 8, 2021, adults with high-risk conditions were not prioritized in 12 states (Harmon & Ivory, 2021). Age-based prioritization is simple, especially when states quantize age by decade, opening vaccines to people at least in their 70s, then adding people in their 60s, etc. States typically justified age-based prioritization by older people’s large risks of serious COVID-19 outcomes, including death, and by the need for simple, fast, and transparent systems (Governor Lamont Announces Connecticut Will Continue Age-Based Approach To COVID-19 Vaccine Eligibility; Educators and Childcare Providers to Have Dedicated Clinics in March, n.d.; Maine Department of Health and Human Services, 2021). But strictly age-based prioritization has come under assault as being unethical (Persad et al., 2020), and the U.S Department of Health and Human Services Office for Civil Rights (2017) has advised that, under the Affordable Care Act’s nondiscrimination provisions, a state or other entity is “only permitted to consider age as one factor as part of its overall decision-making.” Consequently, two complaints were filed with the Office for Civil Rights challenging Connecticut’s age-based prioritization (Disability Rights Connecticut, 2021a, 2021b).
Vaccines remain in short supply in other countries, and shortages (of vaccines and other resources) may return in the U.S. in future public health crises. How do you reconcile any large age-associated effects with ethical and legal demands for equity in jurisdictions that prioritize on age? The answer is found in a proper quantification of the age-associated effects and a commitment to better data collection and reporting and inclusion in decision-making.
Methods
To quantify the association of age (as well as race and ethnicity) with COVID-19 mortality, publicly available data were downloaded from the U.S. Centers for Disease Control and Prevention (CDC) and the U.S. Census Bureau. In calculating COVID-19 mortality (COVID-19 deaths per capita), the CDC data provided numerators (number of COVID-19 deaths), and the census data provided denominators (population). Because the data were aggregated and de-identified, no IRB review was required. Data were analyzed for COVID-19 deaths through February 2021, when vaccines were in short supply, some states were prioritizing vaccine distribution based solely on age, and the Delta variant had not yet emerged.
Census data were from 2019 estimates (the most recent available at time of analysis in September 2021) of U.S. population (by age group for the first analysis, by age group and racial/ ethnic category for the second analysis). To analyze the overall increase of COVID-19 mortality by age, data were downloaded on number of COVID-19 deaths by age group from https://data.cdc.gov/resource/9bhg-hcku.json. (The data file includes number of total deaths, number of COVID-19 deaths, number of pneumonia deaths, number of influenza deaths, and number of deaths in more than one of these categories, by time [month, year, or cumulative across the dataset], age group, sex, and U.S. state [or U.S.-wide]. Only COVID-19 deaths by month and age group were used.) To analyze associations involving race or ethnicity, additional data on COVID-19 deaths by age group and racial/ethnic group were downloaded from https://data.cdc.gov/resource/tpcp-uiv5.json. (That data file includes total number of deaths and number of COVID-19 deaths, by time [week, month, year, or cumulative across the whole dataset], racial/ethnic group [missing for < 1% of COVID-19 deaths], and HHS region [or U.S.-wide]. Only U.S.-wide COVID-19 deaths by month, age group, and racial/ethnic group were used.) Race and ethnicity groups were constructed to match those used in a previous study of racial and ethnic disparities (Bassett et al., 2020): Hispanic, Non-Hispanic American Indian and Alaska Native, Non-Hispanic Asian or Pacific Islander (including Native Hawaiian), and Non-Hispanic Black. The three racial categories were nominally for people reporting those races alone (but < 1% of COVID-19 deaths recorded more than one race).
All analyses were conducted in R 4.1.0 (R Core Team, 2021). COVID-19 mortality was calculated for 9 age categories, from under 5 years old to 85+ years old. To quantify how much COVID-19 mortality changed with increasing age, quasipoisson regression was used (a technique similar to linear regression, but specifically appropriate for count data—quasipoisson can be especially useful when there may be additional unmeasured effects on the outcome variable). COVID-19 deaths were regressed on age as well as jointly on age and racial-ethnic category, in both cases with an offset term for the logarithm of population. (This method recognizes that the death count depends both on the mortality rate in a group and on what the overall population is in the group.) In the regressions, age was taken as the mean age in each age category, calculated from census estimates of U.S. population for each 1-year age span from 0 through 100 years old. (This was close to the middle age in each category. For example, mean age for the youngest group [under age 5] was 2.0 years, and mean age for the group of people in their 30s was 34.5 years. Mean age for the group of people age 85+ was 89.4 years.) In the regressions involving race and ethnicity, the general population was treated as the reference category. All results are reported with 95% confidence intervals.
For the main analysis, COVID-19 deaths through February 2021 were analyzed. In a subsequent “sensitivity analysis,” data from March 2021 through September 11, 2021, were analyzed to evaluate whether conclusions remained broadly the same. To evaluate robustness to other methods of analysis, logistic regressions of the COVID-19 mortality rates and linear regressions of the log-transformed COVID-19 mortality rates were also conducted.
The full content of the R code is available from the author or download it from github. In order for the code to run for the first time, a census API key must be obtained from https://api.census.gov/data/key_signup.html as described in “Working with the Census Data API” and installed using the census_api_key() function in the tidycensus R package (Walker, 2020). For a low-bandwidth analysis such as this, no API key is required from the CDC.
Results
Age
CDC data covered 538,627 U.S. COVID-19 deaths through February 2021. Figure 1 plots COVID-19 mortality rate versus age, pooling across the entire population (see also Table 1). COVID-19 mortality during this period was lowest for 5-17 year olds, but otherwise increased consistently with increasing age. Overall, COVID-19 mortality in the U.S. increased by a factor of 2.56 (95% confidence interval [CI] 2.49, 2.62) per decade of life (so risk of dying from COVID-19 through February 2021, more than doubled for every 10-year increase in age).
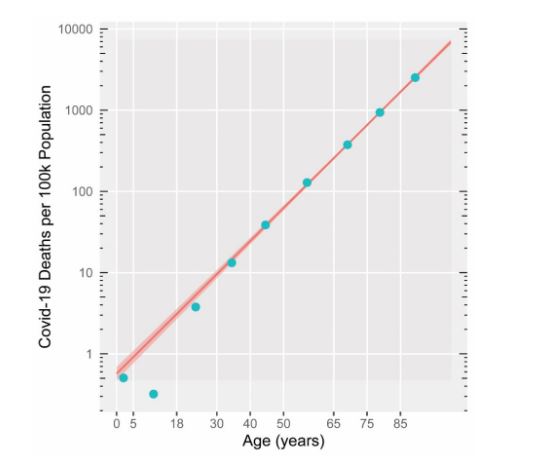
Note. Numerators for mortality rates are from CDC, and denominators are from U.S. Census Bureau. Line and 95% confidence interval reflect quasipoisson regression relating COVID-19 mortality to age and indicates that mortality increases by a factor of 2.56 per decade of life [95% confidence interval (2.49, 2.62)]
| Race/ethnicity | Age group | Mean age (years) | Population | Number of Covid-19 deaths | Covid-19 mortality per 100k population |
|---|---|---|---|---|---|
| All Races and Ethnicities | 0—4 | 2.0 | 19,576,683 | 99 | 0.51 |
| 5—17 | 11.0 | 53,462,467 | 171 | 0.32 | |
| 18—29 | 23.7 | 53,728,222 | 2,033 | 3.78 | |
| 30—39 | 34.5 | 44,168,826 | 5,852 | 13.25 | |
| 40—49 | 44.6 | 40,319,374 | 15,596 | 38.68 | |
| 50—64 | 57.0 | 62,925,688 | 80,928 | 128.61 | |
| 65—74 | 69.1 | 31,483,433 | 118,200 | 375.44 | |
| 75—84 | 78.8 | 15,969,872 | 149,636 | 936.99 | |
| 85+ | 89.4 | 6,604,958 | 166,112 | 2,514.96 | |
| Non-Hispanic American Indian and Alaska Native | 0—4 | 2.0 | 161,894 | 1 | 0.62 |
| 5—17 | 11.0 | 454,056 | 3 | 0.66 | |
| 18—29 | 23.7 | 455,166 | 81 | 17.80 | |
| 30—39 | 34.5 | 334,201 | 269 | 80.49 | |
| 40—49 | 44.6 | 284,857 | 476 | 167.10 | |
| 50—64 | 57.0 | 443,316 | 1,673 | 377.38 | |
| 65—74 | 69.1 | 191,853 | 1,720 | 896.52 | |
| 75—84 | 78.8 | 82,649 | 1,328 | 1,696.80 | |
| 85+ | 89.4 | 26,916 | 739 | 2,745.58 | |
| Hispanic | 0—4 | 2.0 | 5,094,211 | 37 | 0.73 |
| 5—17 | 11.0 | 13,593,354 | 71 | 0.52 | |
| 18—29 | 23.7 | 11,797,900 | 850 | 7.20 | |
| 30—39 | 34.5 | 9,096,112 | 2,543 | 27.96 | |
| 40—49 | 44.6 | 7,962,287 | 6,911 | 86.80 | |
| 50—64 | 57.0 | 8,389,407 | 25,849 | 308.11 | |
| 65—74 | 69.1 | 2,822,119 | 25,204 | 893.09 | |
| 75—84 | 78.8 | 1,307,751 | 22,197 | 1,697.34 | |
| 85+ | 89.4 | 509,096 | 15,800 | 3,103.54 | |
| Non-Hispanic Black | 0—4 | 2.0 | 2,684,389 | 22 | 0.82 |
| 5—17 | 11.0 | 7,322,768 | 41 | 0.56 | |
| 18—29 | 23.7 | 7,759,337 | 483 | 6.22 | |
| 30—39 | 34.5 | 5,810,545 | 1,367 | 23.53 | |
| 40—49 | 44.6 | 5,100,103 | 3,449 | 67.63 | |
| 50—64 | 57.0 | 7,491,213 | 17,674 | 235.93 | |
| 65—74 | 69.1 | 3,100,660 | 21,892 | 706.04 | |
| 75—84 | 78.8 | 1,366,933 | 20,060 | 1,467.52 | |
| 85+ | 89.4 | 511,540 | 15,215 | 2,974.35 | |
| Non-Hispanic Asian or Pacific Islander | 0—4 | 2.0 | 999,341 | 4 | 0.40 |
| 5—17 | 11.0 | 2,831,788 | 11 | 0.39 | |
| 18—29 | 23.7 | 3,400,086 | 87 | 2.56 | |
| 30—39 | 34.5 | 3,363,152 | 304 | 9.04 | |
| 40—49 | 44.6 | 2,934,483 | 680 | 23.17 | |
| 50—64 | 57.0 | 3,419,606 | 3,517 | 102.85 | |
| 65—74 | 69.1 | 1,531,140 | 5,183 | 338.51 | |
| 75—84 | 78.8 | 725,748 | 5,721 | 788.29 | |
| 85+ | 89.4 | 296,443 | 6,076 | 2,049.64 |
Race and Ethnicity
Figure 2 presents the data for each racial-ethnic category in a separate panel, while also repeating the data and fit for the overall population in every panel (see also Table 1). Adjusting for age, the difference in COVID-19 mortality between racial-ethnic category and the overall population was largest for Non-Hispanic American Indian and Alaska Native, with risk ratio 2.14 (95% CI 1.41, 3.25), then Hispanic, with risk ratio 1.92 (95% CI 1.71, 2.15), then Non-Hispanic Black, with risk ratio 1.59 (95% CI 1.41, 3.25). The difference in COVID-19 mortality was not significant between Non-Hispanic Asian or Pacific Islander and overall population, with risk ratio 0.82 (95% CI 0.65, 1.03).
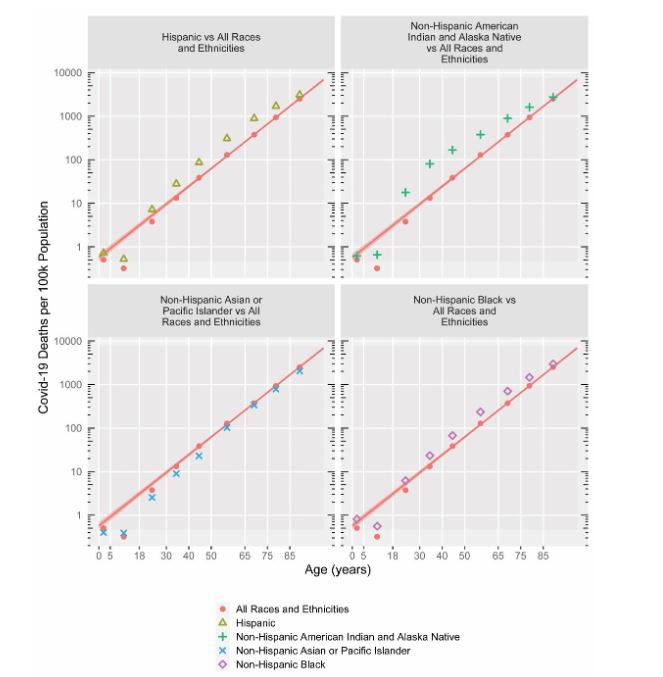
Note. Numerators for mortality rates are from CDC, and denominators are from U.S. Census Bureau. Data and quasipoisson fit (including 95% confidence interval) for entire population are repeated in each panel, showing risk ratio for mortality increasing 2.56 per decade of life, [95% confidence interval (2.49, 2.62)].
COVID-19 mortality among racial and ethnic minorities also appeared especially elevated from levels in overall population in early adulthood through midlife, especially for Non-Hispanic American Indian and Alaska Native people. Rather than pursuing curvilinear fits over a small number of age categories, for each racial-ethnic category, the raw COVID-19 mortalities in age group were compared directly to the corresponding values in the overall population (a “model-free approach” because it compares raw rates instead of fitting lines or curves to the data). The maximum risk ratio by age was similar to the regression-derived risk ratios for three racial-ethnic categories, but for the Non-Hispanic American Indian and Alaska Native, the risk ratio was as large as 6.08 (95% CI 5.38, 6.86) for people in their 30s, compared to a risk ratio of 2.14 (95% CI 1.41, 3.25) for that racial-ethnic group’s regression-derived value.
Sensitivity Analyses
When analyzed via quasilogistic regression instead of quasipoisson regression, the results are essentially the same (odds ratio of 2.57 per decade of life in quasilogistic regression vs risk ratio of 2.56 per decade of life in quasipoisson regression, for example). When log mortality rate is analyzed via linear regression, the age effect increases somewhat, to a risk ratio of 2.84 per decade of life, because linear regression increases the slope of the best-fitting line in Figures 1 and 2 to better fit the COVID-19 mortality in people younger than 30; whereas quasipoisson and quasilinear regression recognize the lower statistical reliability of those data points.
When analyzing the data from March 2021 into September 2021 (120,127 COVID-19 deaths) instead of data from the beginning of the pandemic through February 2021, the pattern of results remained similar. The association of age with mortality was somewhat weaker, with COVID-19 mortality increasing by a factor of 1.96 (95% CI 1.84, 2.09) per decade of life (versus 2.56 per decade of life through March 2021), and the racial/ethnic disparities were reduced for Non-Hispanic American Indian and Alaska Native (risk ratio 2.14 through February 2021 reduced to 1.44 from March 2021 forward) and for Hispanic (risk ratio reduced from 1.92 to 1.47). The patterns in the graphs looked otherwise very similar.
Discussion
Many potential risk factors elevate COVID-19 mortality by a factor less than the 2.56 risk ratio that people experience from a decade of life and might be excluded from prioritization with comparatively small effects on mortality equity (though a full consideration of equity would also consider effects beyond mortality). However, some conditions and demographic characteristics are associated with elevation in COVID-19 mortality that approaches or even exceeds that level—sometimes substantially. Ignoring those characteristics perpetuates health inequities.
Figure 3 displays risk ratios deriving from the present study’s regressions, along with risk ratios from other studies for Down syndrome, intellectual or developmental disability, organ transplant, and kidney disease. A risk ratio greater than 1 (data points to the right of the vertical dashed line) indicates COVID-19 mortality higher than in the general population. A risk ratio less than 1 indicates COVID-19 mortality lower than in the general population. For example, a risk ratio of 3 indicates a tripling in COVID-19 mortality. [For one study (Gleason et al., 2021), an odds ratio is displayed instead, and for two studies (Clift et al., 2020; Williamson et al., 2020), hazard ratios are displayed instead, but COVID-19 mortality is low enough that all the ratios in Figure 3 can be treated similarly]. For people with Down syndrome, intellectual, or developmental disability, some ratios show mortality risk separately depending on a person’s residence (intermediate care facility vs. group home vs. own home, family home, or shared living), as type of residence is a strong predictor of COVID-19 mortality.
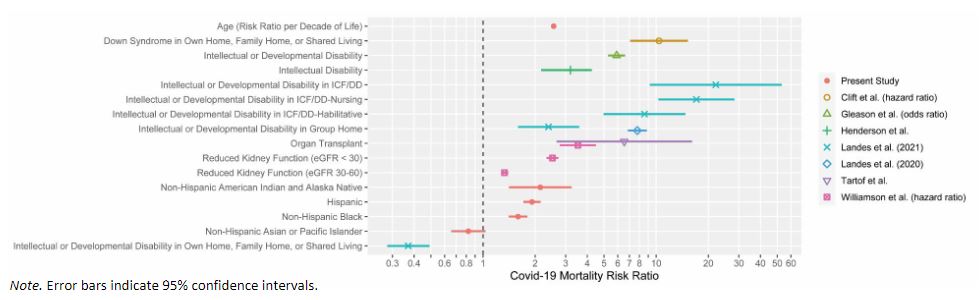
Note. Error bars indicate 95% confidence intervals.
People Living in Congregate Settings Have Higher COVID-19 Mortality
Intellectual or developmental disability is associated with about a 3-fold (Henderson et al., 2021) to 6-fold (Gleason et al., 2021) elevation in COVID-19 mortality overall (when living situation is not considered). But COVID-19 mortality rate differs substantially by type of residence. People with intellectual or developmental disabilities living in ICFs have COVID-19 mortalities elevated by 8.6-fold to 17.1-fold, depending on type of ICF (Landes et al., 2021b), and people with intellectual or developmental disabilities living in group homes have COVID-19 mortalities elevated by 2.4-fold to 7.8-fold (Landes et al., 2020, 2021b). Compare these elevated COVID-19 mortalities in congregate settings to those among people with intellectual or developmental disability living in their own home, family home, or shared living, where the risk ratio is 0.37 (COVID-19 mortality almost three times lower than in the general population). Clearly, congregate living situations are associated with high COVID-19 mortality.
Although some of the COVID-19 mortality risk associated with congregate settings may be attributable to an increased likelihood of people with more significant medical conditions living in such settings, some of the risk is surely associated with the settings’ congregate nature per se, as social distancing is less achievable in such settings.
People with Down Syndrome Have Higher COVID-19 Mortality
Down syndrome has been reported to be associated with a 10-fold elevation in COVID-19 mortality even among people living in their own home, family home, or shared living (Clift et al., 2020).
People with Organ Transplant Have Higher COVID-19 Mortality
Organ transplantation has been reported to be associated with an elevation in COVID-19 mortality of 3.5-fold (Williamson et al., 2020) to 6.5-fold (Tartof et al., 2020).
People with Substantial Kidney Disease Have Higher COVID-19 Mortality
Kidney disease has been reported to be associated with a fairly moderate elevation in COVID-19 mortality of 1.3-fold for moderately reduced kidney function [estimated glomerular filtration rate (eGFR) = 30 to 36 ml per min per 1.73 m2] but a more substantial elevation in COVID-19 mortality of 2.5-fold for more substantially reduced kidney function (eGFR < 30) (Williamson et al., 2020).
American Indian and Alaska Native People, Hispanic People, and Black People Have Higher COVID-19 Mortality
Elevations in COVID-19 mortality by race and ethnicity are not as large in the present analysis as were found earlier in the pandemic (Bassett et al., 2020), but they are still present, though in most cases not as large as the elevation in COVID-19 mortality associated with being 10 years older. In particular, the point estimate is 2.1-fold for Non-Hispanic Native American Indian and Alaska Natives, though the risk ratio rose as high as 6.1-fold for 25-34-year-old Non-Hispanic Native American Indian and Alaska Natives.
Limitations
This study considered only COVID-19 mortality, not other substantial medical outcomes like diagnosis or hospitalization nor other outcomes like social isolation or the impact of COVID-19 on formal or informal supports to persons with disabilities. In addition, the available data from the literature did not distinguish among living in one’s own home or own family’s home versus living with another family (shared living).
The data are inherently correlational. (For example, there was a large association between congregate living and elevated COVID-19 mortality, but because there is no random assignment to congregate living, it is impossible to know the extent to which correlates of congregate living are drive that association.) The data also do not reveal the extent to which correlates of disability (such as income or wealth) may be associated with differences in COVID-19 mortality.
No attempt was made to examine geographic patterns or trends over time (other than beginning of pandemic through end of February 2021 vs. March 2021 into September 2021), nor was sex included in the analysis. The racial/ethnic analysis did not examine the intersectionality of race and ethnicity, as the CDC datasets did not break down data on COVID-19 deaths of Hispanic people by their race.
Conclusion
States that use a strictly age-based framework for prioritizing eligibility for vaccines typically justify that approach by noting the enormous risk ratio for COVID-19 mortality of the oldest groups versus young adults. For example, people at least 85 years old had a COVID-19 mortality of 2514.96 per 100k population through February 2021, versus 3.79 per 100k among 28-29 year olds—an enormous risk ratio of 664.65. But mean age between these groups differs by 65.7 years (6.57 decades). States prioritizing by age typically quantized age by decade—for example, opening up vaccines to 70-year-olds, then 60-year-olds, etc., so the appropriate metric is the risk ratio per decade, which can be calculated as 664.651/6.57 = 2.69. By calibrating potential risk factors for COVID-19 mortality against the risk ratio per decade (2.56 per decade when fitting all the data via quasipoisson regression), we can identify characteristics that should be considered for vaccine access even within an age-based framework. This analysis—and the data that informs such analyses—lead to specific policy prescriptions:
Policy Prescription 1: Access to Vaccines
A 2.56-fold elevation in COVID-19 mortality is the same risk conveyed by being 10 years older, and a 6.54-fold elevation in COVID-19 mortality is the same risk conveyed by being 20 years older (because 2.562 = 6.54). In order to begin to address equity, in any jurisdiction adopting an age-based framework for COVID-19 vaccine prioritization, people with conditions associated with a 2.59-fold elevation in COVID-19 mortality should become eligible for vaccines along with people 10 years older, and people with conditions associated with a 6.54-fold elevation in COVID-19 mortality should become eligible for vaccines along with people 20 years older. For example, a 30-year-old with severely reduced kidney function (eGFR < 30) should become vaccine-eligible at the same time as a 40-year-old from the general population, and a 50-year-old with severely reduced kidney function should become vaccine-eligible at the same time as a 60-year-old from the general population. People with organ transplants might also be reasonably prioritized by 10 years, though that policy recommendation might depend on how effective vaccines are for that population and whether booster shots for organ transplants might yield protection equivalent to someone from the general population without a booster shot. People with intellectual or developmental disabilities living in congregate settings should be prioritized by at least 10 or 20 years and should arguably receive absolute prioritization. People with Down syndrome—even when living in noncongregate settings such as their own home, their family’s home, or shared living—should receive vaccines along with people 40 years older than them (or simply given absolute priority). Important for speeding vaccine delivery, identifying residents of congregate settings is easy, and they can also be reached easily. Also important for speeding vaccine delivery, Down syndrome is easy to identify.
It is unfortunate that, although Down syndrome and organ transplantation are both found on the CDC’s list of medical conditions with sufficient evidence to conclude they put people at increased risk of severe illness from COVID-19 (CDC, 2021), states that implemented age-based prioritization did not all prioritize these two groups with substantially increased risk of COVID-19 mortality. This decision was an inequitable threat to the health of these populations.
Policy Prescription 2: Access to Data
In the U.S., state developmental disabilities agencies, for the most part, have COVID-19 data about people with disabilities—at least for people receiving services from state institutions or home- and community-based services funded through Medicaid—because COVID-19 cases and deaths constitute “critical incidents” that must be reported to the agency. But the data collection systems for people with intellectual or developmental disabilities are largely segregated from the general public health data systems. Consequently, while COVID-19 dashboards, which are common throughout the U.S., track and report data by several risk factors (age and race among them), they rarely if ever report data on disability, even though states could link their public health and vaccine databases with databases supporting their developmental disabilities agencies or Medicaid agencies. This makes it impossible to assess the COVID-19 mortality associated with intellectual or developmental disability per se. Only recently has multistate data become available on COVID-19 deaths by disability and residential setting, and it remains incomplete and, at least in the extant literature, has only been used for calculating case-fatality rates (risk of dying given that a person already has a COVID-19 diagnosis) rather than mortality rates (overall risk of dying from COVID-19; Landes et al., 2021a). This exclusion of disability data from public health data dashboards is shocking in light of longstanding Surgeon General recommendations to improve health-related surveillance for people with intellectual disabilities (U.S. Public Health Service, 2001). The segregation of disability data systems from broader public health data systems also makes it impossible for the public to track vaccine progress in this marginalized population—important considerations even after vaccine eligibility is broadened to the general adult population. This must change.
Policy Prescription 3: Inclusion in Decision-Making
In the future—during the current pandemic, in future public health crises, and even between crises—perceived convenience for policymakers and public health personnel on the ground should not be allowed to exacerbate the inequities that contribute to health disparities. Laws, rules, and policies should be written to recognize previous marginalization—and ongoing marginalization—and to prevent recurrence. Stakeholders from marginalized groups should be appointed to meaningful roles in decision making and advisory bodies in all jurisdictions, including at the state and federal level. And when data or analyses come to light challenging previously adopted policies, jurisdictions should heed the data and re-examine the policies. “Nothing about us without us.”
References
Bassett, M. T., Chen, J. T., & Krieger, N. (2020). Variation in racial/ethnic disparities in COVID-19 mortality by age in the United States: A cross-sectional study. PLOS Medicine, 17(10), e1003402. https://doi.org/10.1371/journal.pmed.1003402
Centers for Disease Control and Prevention. (2021, March 15). People with certain medical conditions. Centers for Disease Control and Prevention. https://www.cdc.gov/coronavirus/2019-ncov/need-extra-precautions/people-with-medical-conditions.html
Clift, A. K., Coupland, C. A. C., Keogh, R. H., Hemingway, H., & Hippisley-Cox, J. (2020). COVID-19 mortality risk in Down syndrome: Results from a cohort study of 8 million adults. Annals of Internal Medicine, 174(4), 572-576. https://doi.org/10.7326/M20-4986
Disability Rights Connecticut. (2021a, February 25). Disability Rights Connecticut Says Connecticut’s New COVID vaccine policy is unlawful and discriminatory; complaint filed with U.S. Office for Civil Rights Seeks immediate federal investigation, policy revisions. Disability Rights Connecticut, Inc. https://www.disrightsct.org/announcement-press-release-vaccine-policy
Disability Rights Connecticut. (2021b, March 8). Three legal services programs file complaint with federal office for civil rights to investigate discriminatory allocation of COVID-19 vaccine by Connecticut. Disability Rights Connecticut, Inc. https://www.disrightsct.org/announcement-press-release-three-legal-aid-organizations-file-ocr-complaint
Gleason, J., Ross, W., Fossi, A., Blonsky, H., Tobias, J., & Stephens, M. (2021). The devastating impact of COVID-19 on individuals with intellectual disabilities in the United States. New England Journal of Medicine Catalyst Innovations in Care Delivery. https://catalyst.nejm.org/doi/full/10.1056/CAT.21.0051
Governor Lamont Announces Connecticut Will Continue Age-Based Approach To COVID-19 Vaccine Eligibility; Educators and Childcare Providers to Have Dedicated Clinics in March. (n.d.). CT.Gov – Connecticut’s Official State Website. https://portal.ct.gov/Office-of-the-Governor/News/Press-Releases/2021/02-2021/Governor-Lamont-Announces-Connecticut-Will-Continue-Age-Based-Approach-To-COVID-Vaccine
Harmon, A., & Ivory, D. (2021, March 9). How America’s vaccine system makes people with health problems fight for a place in line. The New York Times. https://www.nytimes.com/2021/03/09/us/covid-vaccine-eligible-preexisting-conditions.html
Henderson, A., Fleming, M., Cooper, S.-A., Pell, J., Melville, C., MacKay, D., Hatton, C., & Kinnear, D. (2021). COVID-19 infection and outcomes in a general population-based cohort of 17,173 adults with intellectual disabilities compared with the general population. medRxiv. https://doi.org/10.1101/2021.02.08.21250525
Johns Hopkins Disability Health Research Center & Center for Dignity in Healthcare for People with Disabilities. (2021). COVID-19 vaccine prioritization dashboard. https://disabilityhealth.jhu.edu/vaccine/
Landes, S. D., Turk, M. A., Formica, M. K., McDonald, K. E., & Stevens, J. D. (2020). COVID-19 outcomes among people with intellectual and developmental disability living in residential group homes in New York State. Disability and Health Journal, 13(4), 100969. https://doi.org/10.1016/j.dhjo.2020.100969
Landes, S. D., Turk, M. A., & Ervin, D. A. (2021a). COVID-19 case-fatality disparities among people with intellectual and developmental disabilities: Evidence from 12 US jurisdictions. Disability and Health Journal, 14, 101116. https://doi.org/10.1016/j.dhjo.2021.101116
Landes, S. D., Turk, M. A., & Wong, A. W. W. A. (2021b). COVID-19 outcomes among people with intellectual and developmental disabilities in California: The importance of type of residence and skilled nursing care needs. Disability and Health Journal, 14(2), 101051. https://doi.org/10.1016/j.dhjo.2020.101051
Maine Department of Health and Human Services. (2021). Indicators of severe COVID-19 illness. https://www.maine.gov/dhhs/sites/maine.gov.dhhs/files/2021-02/Indicators%20of%20Severe%20COVID19%20Illness%202%2026%202021.pptx_.pdf
Persad, G., Peek, M. E., & Emanuel, E. J. (2020). Fairly prioritizing groups for access to COVID-19 vaccines. Journal of the American Medical Association, 324(16), 1601. https://doi.org/10.1001/jama.2020.18513
R Core Team. (2021). R: A language and environment for statistical computing. R Foundation for Statistical Computing.
Tartof, S. Y., Qian, L., Hong, V., Wei, R., Nadjafi, R. F., Fischer, H., Li, Z., Shaw, S. F., Caparosa, S. L., Nau, C. L., Saxena, T., Rieg, G. K., Ackerson, B. K., Sharp, A. L., Skarbinski, J., Naik, T. K., & Murali, S. B. (2020). Obesity and Mortality among patients diagnosed with COVID-19: Results from an integrated health care organization. Annals of Internal Medicine, 173(10), 773–781. https://doi.org/10.7326/M20-3742
U.S. Department of Health and Human Services Office for Civil Rights. (2017, May 18). Section 1557: Frequently asked questions. https://www.hhs.gov/civil-rights/for-individuals/section-1557/1557faqs/index.html
U.S. Public Health Service. (2001). Closing the gap: A national blueprint to improve the health of persons with mental retardation. Report of the Surgeon General’s Conference on Health Disparities and Mental Retardation. https://www.ncbi.nlm.nih.gov/books/NBK44346/
Walker, K. (2020). tidycensus: Load US Census Boundary and Attribute Data as “tidyverse” and ’sf’-Ready Data Frames (0.9.9.5) [Computer software]. https://CRAN.R-project.org/package=tidycensus
Williamson, E. J., Walker, A. J., Bhaskaran, K., Bacon, S., Bates, C., Morton, C. E., Curtis, H. J., Mehrkar, A., Evans, D., Inglesby, P., Cockburn, J., McDonald, H. I., MacKenna, B., Tomlinson, L., Douglas, I. J., Rentsch, C. T., Mathur, R., Wong, A. Y. S., Grieve, R., … Goldacre, B. (2020). Factors associated with COVID-19-related death using OpenSAFELY. Nature, 584(7821), 430–436. https://doi.org/10.1038/s41586-020-2521-4
