Lumen Learning
Learning Outcomes
- Describe the demographic transition theory of human population growth.
Demographic Transition Theory
Societies develop along a predictable continuum as they evolve from unindustrialized to postindustrial. Demographic transition theory (Caldwell and Caldwell 2006) suggests that population growth develops along a predictable four-stage model.
In Stage 1, birth, death, and infant mortality rates are all high, while life expectancy is short. An example of this stage is the 1800s in the United States. As countries begin to industrialize, they enter Stage 2, where birthrates are higher while infant mortality and the death rates drop. Life expectancy also increases. Afghanistan is currently in this stage. Stage 3 occurs once a society is thoroughly industrialized; birthrates decline, while life expectancy continues to increase. Death rates continue to decrease. Mexico’s population is at this stage. In the final phase, Stage 4, we see the postindustrial era of a society. Birth and death rates are low, people are healthier and live longer, and society enters a phase of population stability. Overall population may even decline. For example, Sweden is considered to be in Stage 4.

Figure 1. This shows how the changes in birth and death rates affect total population during the demographic transition stages.The United Nations Population Fund (2008) categorizes nations as high fertility, intermediate fertility, or low fertility. The United Nations (UN) anticipates the population growth will triple between 2011 and 2100 in high-fertility countries, which are currently concentrated in sub-Saharan Africa.
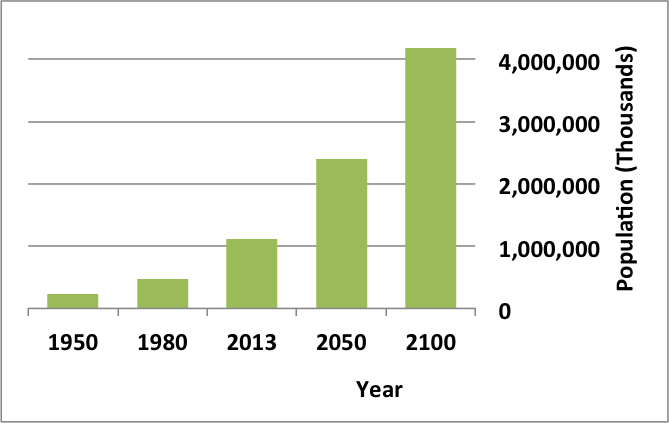
For countries with intermediate fertility rates (the United States, India, and Mexico all fall into this category), growth is expected to be about 26 percent.

And low-fertility countries like China, Australia, and most of Europe will actually see population declines of approximately 20 percent.

GLOSSARY
- carrying capacity:
- the amount of people that can live in a given area considering the amount of available resources
- demographic transition theory:
- a theory that describes four stages of population growth, following patterns that connect birth and death rates with stages of industrial development
