College of Science
93 Enhancing Models of Optimal Polar Bear Movement in the Arctic Through Advanced Data Science and Image Processing
Rylie Gagne
Faculty Mentor: Jody Reimer (Mathematics, University of Utah)
Introduction
Global warming is causing significant changes to sea ice. As temperatures rise, sea ice is melting at an accelerated rate, leading to a reduction in extent and thickness. This melting is affecting younger, first-year ice, which is less resilient than older, multi-year ice. Additionally, the timing of sea ice formation and breakup is shifting, resulting in shorter ice seasons. The reduction in sea ice not only affects the physical landscape but also impacts the habitats and migration patterns of Arctic wildlife, such as polar bears, and contributes to further warming through reduced albedo (the reflection of sunlight) (Borzenkova et al. 2023).
As climate change accelerates the loss of sea ice in the Arctic, it strains the relationship between polar bears and sea ice. Numerous studies have explored how polar bear movement is affected by sea ice dynamics, including the timing of its formation and melt, its drift, and its thickness (Platonov et al., 2014; Durner et al., 2017). Durner et al. (2017) found that increased ice drift contributed to greater energy expenditures for polar bears as they adjust their movements to stay within their home ranges. The biological cost of adapting to changing ice conditions can be seen via this increase in energy demand resulting in additional seal captures.
Yee et al. (2017) provides additional insight into the migration patterns of female polar bears from their maternal dens to sea ice in Western Hudson Bay. The study observed a reduction in movement compared to the late 1990s, likely due to earlier ice break-up driven by climate change. The implications of this shift include potential changes in reproductive cycles to adapt to the environment, accentuating the challenges polar bears face.
These studies show just how much changing sea ice affects polar bears. As climate change reshapes their habitat, it’s clear we need more research to understand these challenges better.
Methods
Previous research conducted in Dr. Jody Reimer’s lab has developed a model predicting the most energy-efficient paths for polar bears across a habitat characterized by a mosaic of ice and water (Forrester et al., in prep). However, this model has only been applied to a highly simplified representation of Arctic sea ice, consisting of a random matrix of ice and water, limiting the applicability of the results to real-world scenarios.
To address this limitation, satellite imagery of Hudson Bay was gathered and processed using the Sentinel Hub API. The study focused on a 100 km² region off the coast near Churchill, Manitoba—an area frequently traversed by polar bears during seasonal migrations.
Two types of satellite data were utilized: Sentinel-2 optical imagery and Sentinel-1 Synthetic Aperture Radar (SAR) data. Optical imagery provides high visual detail but is restricted by cloud cover and limited daylight in winter months. SAR imagery, in contrast, is unaffected by atmospheric conditions or light availability, making it especially useful for Arctic environments. Combining both data sources allowed for expanded temporal coverage over the past ten years.
For classification, the Sentinel-2 (optical) images were first normalized before applying a trained Random Forest model to predict whether each pixel represented ice or water. Sentinel-1 data were processed using the same model, without normalization, to account for differences in signal characteristics. Predictions from both data types were aggregated to create the most temporally comprehensive dataset possible.
These binary ice-water predictions were then used as inputs to the energy-efficient path model developed by Forrester et al. (in prep), which calculates the least-cost routes polar bears could take across ice and water matrices, incorporating the differential energetic costs of walking versus swimming.
To characterize spatial patterns in the ice distribution, Moran’s I was computed as a measure of spatial autocorrelation across all prediction dates. Additionally, sea ice concentration was calculated for each image and compared to corresponding concentration values from the National Snow and Ice Data Center (NSIDC), serving as an external validation metric for classification accuracy.
Results
Sea ice concentration and the cost associated with the most energy-efficient path both followed seasonal trends, reflecting the cyclical formation and melting of sea ice throughout the year. As expected, the energetic cost of traversing the selected region in Hudson Bay increased during ice-free periods and decreased during peak ice coverage. In the model, the costs assigned to water and ice are arbitrary numerical values used to represent the relative difference in energy expenditure, with higher values for water reflecting the greater effort required for swimming compared to walking on ice.
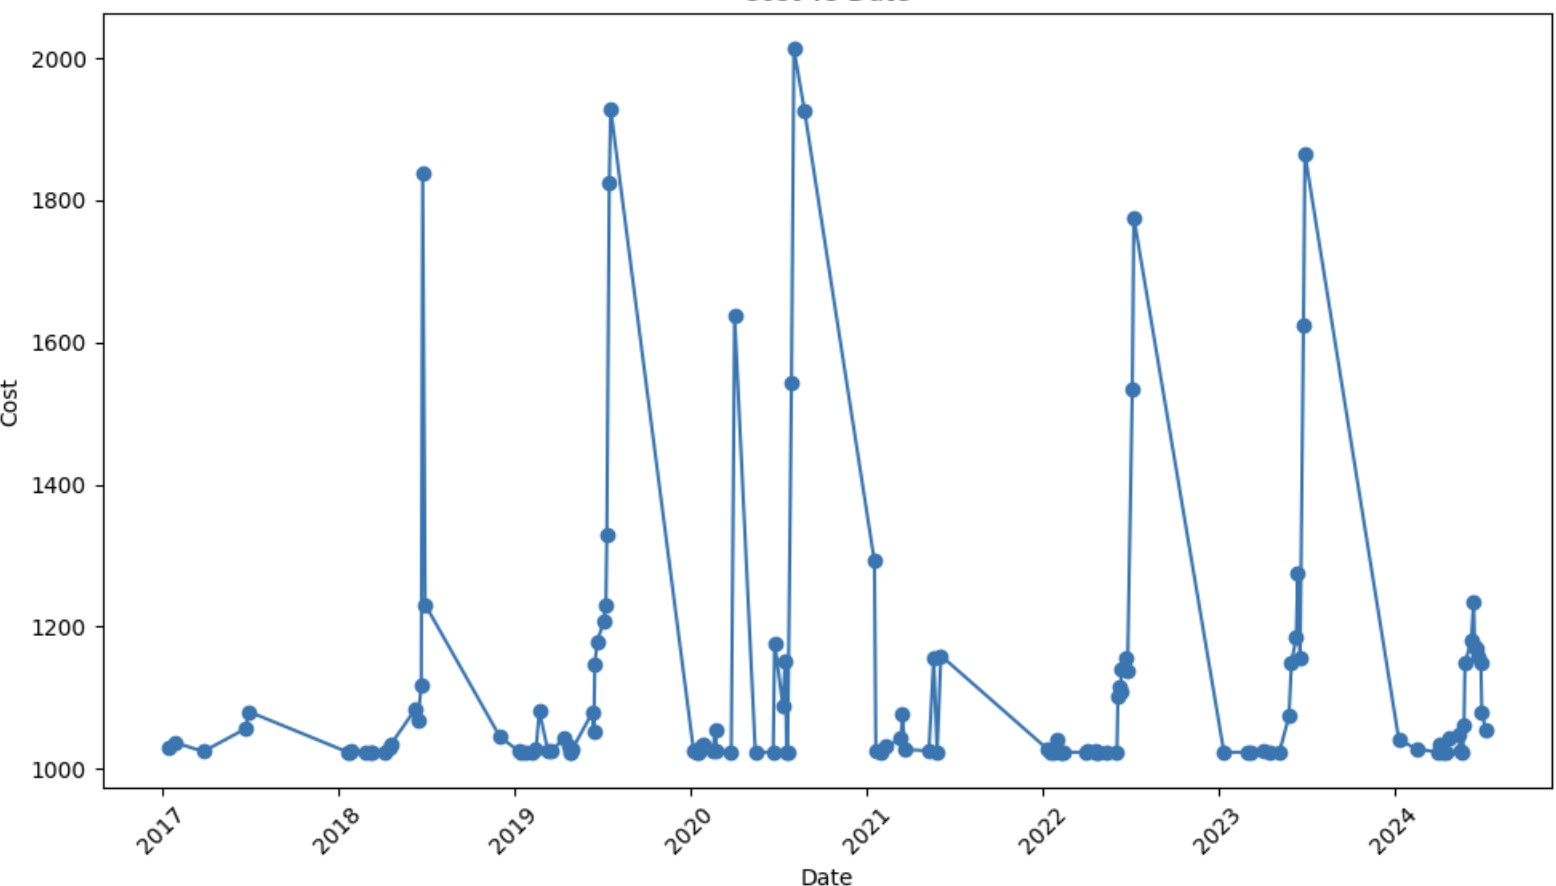
Table 1: Seasonal Variation in Polar Bear Movement Cost (2017–2024)
Here is an example of the most-efficient path across sea ice found in Hudson Bay avoiding water (light blue) and prioritizing sea ice (dark blue).
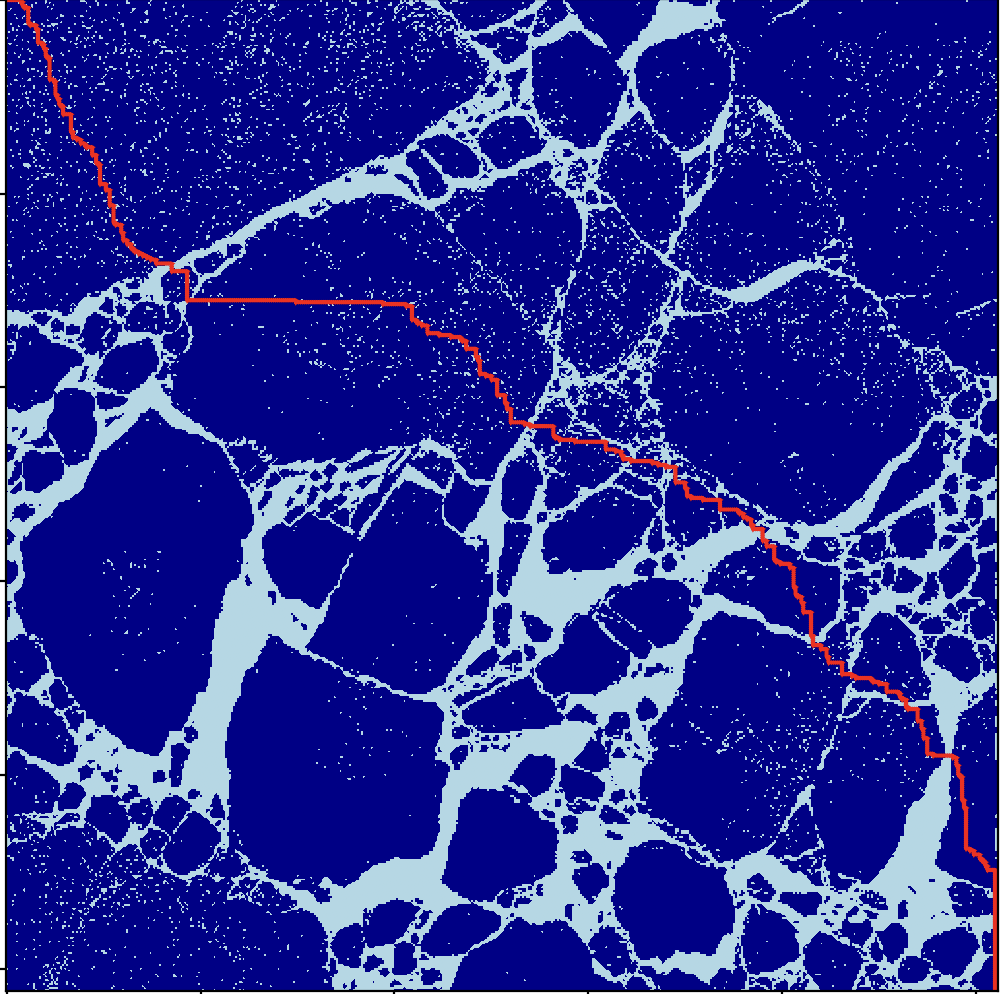
Plot 1: Optimal Path Across Observed Sea Ice Geometry
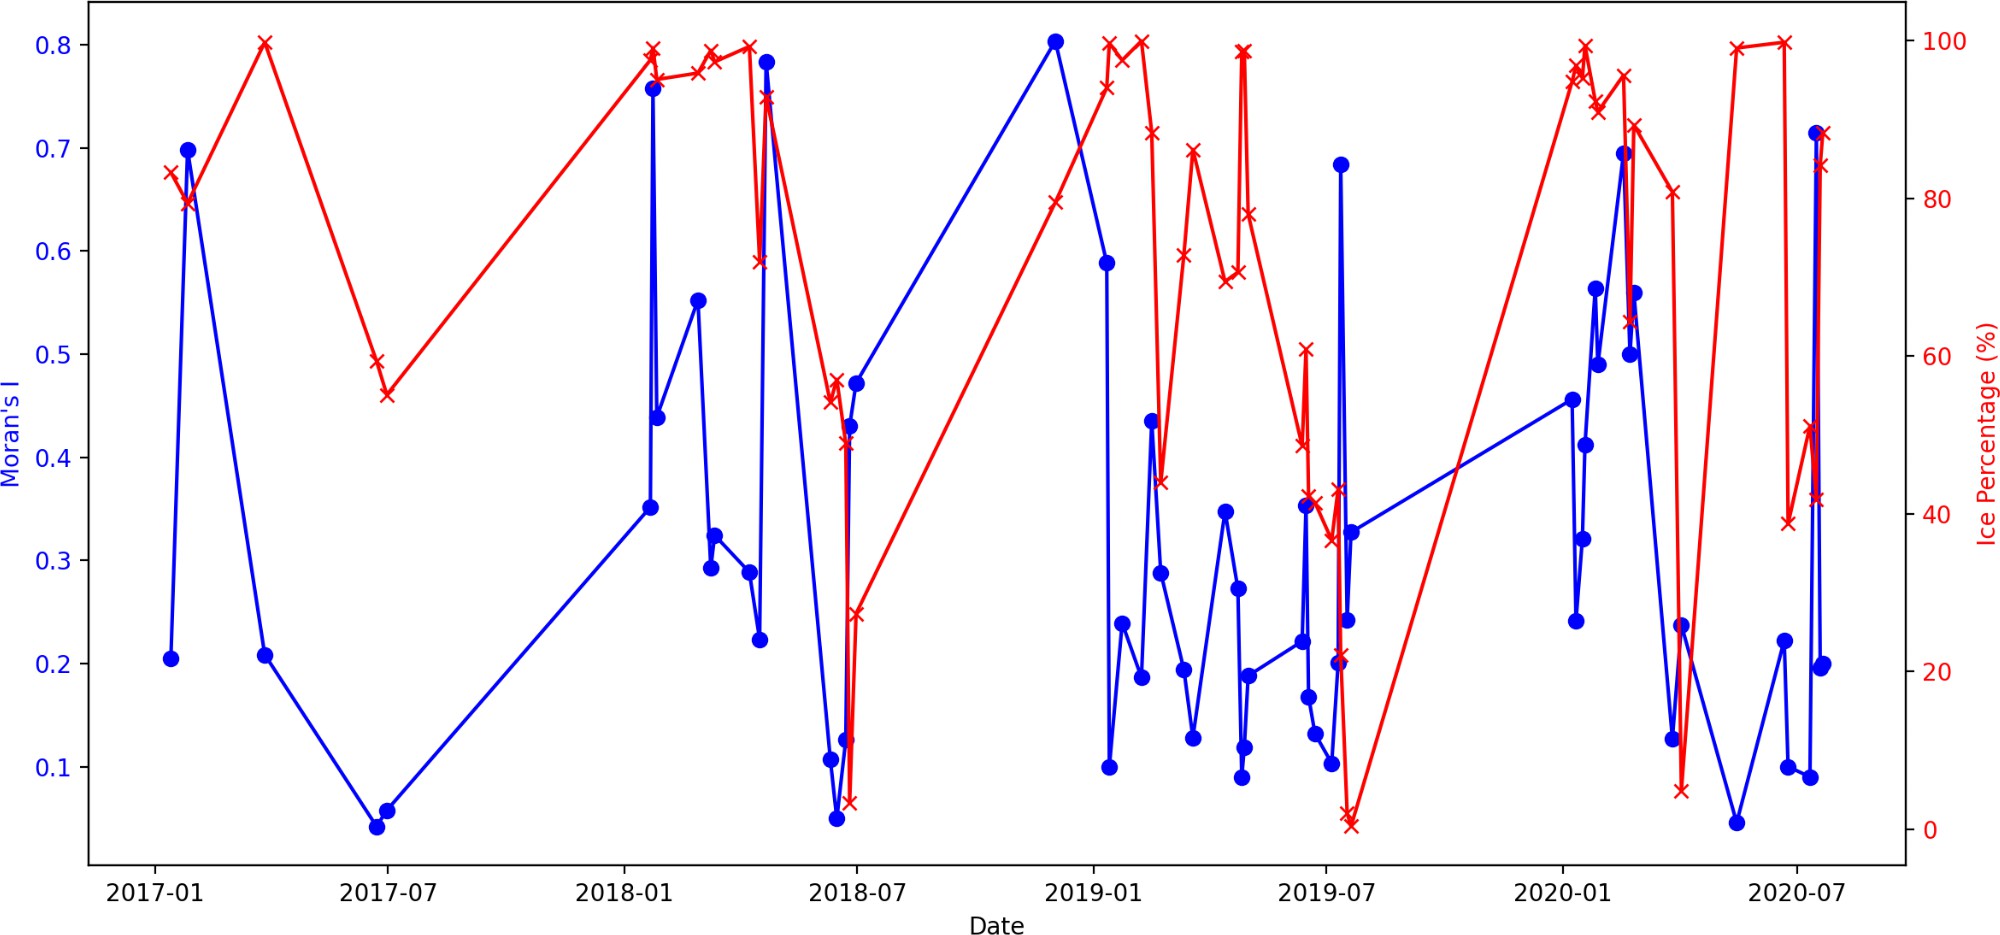
Plot 2: Temporal Trends in Ice Coverage and Spatial Clustering (2017–2020)
Additionally, Moran’s I, which quantifies the spatial clustering of sea ice, exhibited a consistent seasonal pattern, indicating that the geometric structure of the ice shifts in a predictable manner across different times of the year.
Discussion
These results serve as an initial validation that meaningful seasonal patterns in sea ice concentration, spatial structure, and path cost can be detected within a single region of Hudson Bay. The observed correlations between variables, such as sea ice concentration and movement cost, support the premise that these factors are interrelated in shaping polar bear energetics. However, because the analysis was limited to a single geographical area, it remains difficult to assess whether there is a long-term decline in ice conditions over the past decade, as would be expected in response to ongoing climate change. Broader spatial coverage and statistical analyses are necessary to detect more subtle interannual trends.
Conclusion
Future work will expand this analysis to additional regions within Hudson Bay that align with known polar bear movement patterns. With a broader spatial dataset, it will be possible to compute correlation coefficients between variables such as sea ice concentration, spatial clustering, and energetic path cost. This will help determine which factors most significantly influence polar bear energetics. As more regions are incorporated, it is anticipated that long-term trends in sea ice and their impact on polar bear movement will become more apparent, offering clearer insights into the ecological consequences of climate change.
Bibliography
Borzenkova, I. I., Ershova, A. A., Zhiltsova, E. L., et al. (2023). Arctic sea ice in the light of current and past climate changes. Izvestiya, Atmospheric and Oceanic Physics, 59(Suppl 1), S35–S46. https://doi.org/10.1134/S0001433823130042
Durner, G. M., Douglas, D. C., Albeke, S. E., Whiteman, J. P., Amstrup, S. C., Richardson, E., Wilson,
R. R., & Ben-David, M. (2017). Increased Arctic sea ice drift alters adult female polar bear movements and energetics. Global Change Biology, 23(9), 3460–3473.
Forrester, N., Golden, K. M., & Reimer, J. R. Energetically optimal polar bear pathways; insights from percolation theory. In preparation.
Platonov, N. G., Rozhnov, V. V., Alpatsky, I. V., Mordvintsev, I. N., Ivanov, E. A., & Naidenko, S. V. (2014). Evaluation of polar bear movement patterns in relation to sea ice drift. Doklady Biological Sciences, 456(1), 191–194.
Yee, M., Reimer, J., Lunn, N. J., Togunov, R. R., Pilfold, N. W., McCall, A. G., & Derocher, A. E. (2017). Polar bear (Ursus maritimus) migration from maternal dens in Western Hudson Bay. Arctic, 70(3), 319–327.
