College of Mines and Earth Sciences
77 Model Reconstruction of the Santa Fe Ice Cap During the Last Glacial Maximum
Rachael Noble
Faculty Mentor: Leif Anderson (Geology and Geophysics, University of Utah)
Abstract
This study focuses on the reconstruction of the Santa Fe ice cap during the Last Glacial Maximum (LGM) approximately 21-20 ka years ago. This was accomplished through the integration of geomorphic mapping along with a mass balance glacier model where the conditions for ice accumulation and persistence was analyzed. The model reached steady state after ~1900 years, closely matching the observed boundaries with deviations at the northwest and southwest margins, likely due to assumptions included in the surface mass balance model. Results identify temperature as the dominant driver of glaciation, with increased precipitation playing a secondary role. A mean annual temperature depression of 9.5℃ relative to modern temperatures in order to match geomorphic estimated LGM ice cap extents. These findings improve understanding of glacial sensitivity to past and future climate shifts near Santa Fe, New Mexico.
Methods
Preserved glacial landforms of moraines and triplines were mapped using Google Earth Pro and Lidar hillshades (available through Opentopography.org/) to define LGM ice cap extents (similar to work done in Guido et al., 2007). These Geomorphic boundaries are a target for the glacier model used, which includes calculations of surface mass balance an dice dynamics across a two-dimensional grid (Anderson et al., 2018) The mass balance portion of the model simulates snow accumulation and melt using modern PRISM climate reanalysis datasets (https://www.prism.oregonstate.edu/). Model inputs include monthly air temperature and precipitation fields, distinguishing between snow (below freezing) and rain (above freezing). Digital elevation models (DEMS) and climate data were processed using QGIS and Python, and the model was calibrated by iteratively adjusting mean annual temperature to match observed LGM glacier extents.
Results
Starting from a deglaciated landscape, we ran the model to steady state with specific climate perturbations. For the simulation that best matched the LGM extents, the model reached steady state after ~1900 years, achieving a glacier wide mass balance of zero (as seen in Figure 1 A&D).
Simulated boundaries closely aligned with observed geomorphic features (Figure 2). However, modeled ice extent deviations were noted at the northwest margin where ice thickness reached ~450 meters (Figure 1B) and the maximum velocity of the model at ~2 m/year (Figure 1C), and the southern margin having seen simulated extents past the drawn boundary. These deviations are likely due to the glacier model’s assumption of no aspect dependence. Using a more complicated model that incorporates shading and direct solar radiation will likely alleviate the strongest deviations between the modeled and geographically-defined extents. We found that we required a mean annual temperature depression of 9.5 C to match the LGM ice extent. These findings confirm that colder temperatures were critical for sustaining LGM glaciers, while precipitation contributed secondary support.
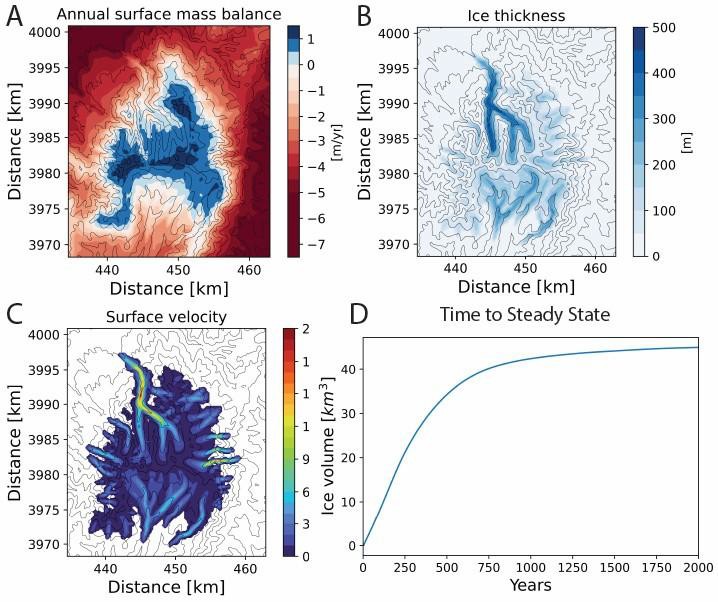
Figure 1. Glacier Dynamics and Mass Balance. A) Annual surface mass balance with accumulation (blue) and ablation (red) zones; B) Ice thickness map, with maximum thickness (~500 m) in main velocity and discharge channel; C) Surface velocity, showing faster flow in central regions; D) Ice volume evolution, reaching steady state after ~1,900 years.
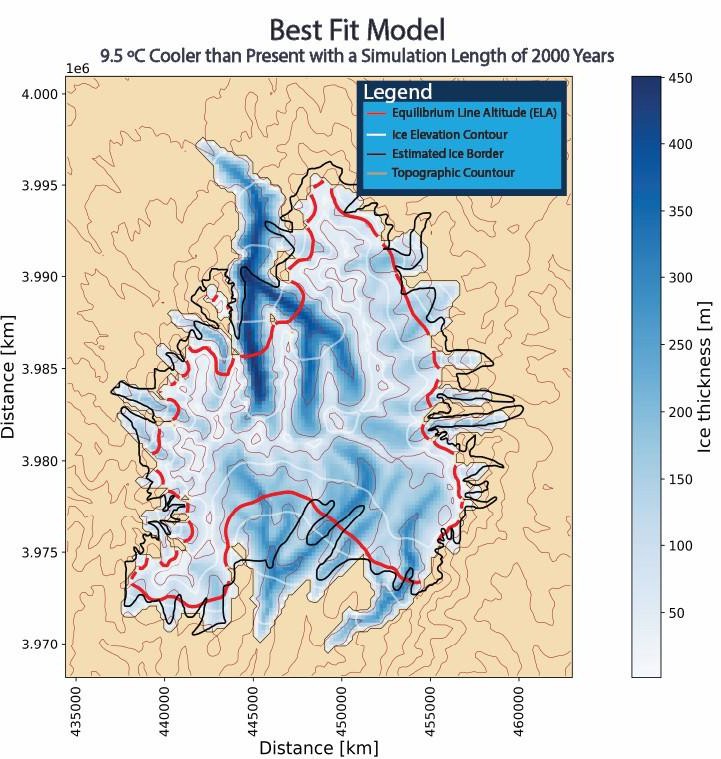
Figure 2: Best Fit Model Figure. Modeled ice extent during the Last Glacial Maximum with a simulation length of 2,000 years and a mean temperature reduction of 9.5°C from present. Ice thickness is shown with a blue gradient, and equilibrium line altitude (ELA), topographic contours, and estimated ice borders are indicated for reference.
Conclusion
This research illustrates the value of integrating geomorphic mapping with numerical modeling for reconstructing glacial extents. Results emphasize the importance of temperature as the primary driver of LGM glaciation, while deviations in modeled boundaries highlight areas for future improvement, such as incorporating wind effects, topographic shading, and higher-resolution datasets. These findings contribute to understanding mid-latitude glacier responses to climatic shifts and provide a framework for future paleoglacial reconstructions.
Bibliography
Anderson, L. S., Flowers, G. E., Jarosch, A. H., Aðalgeirsdóttir, G. Þ., Geirsdóttir, Á., Miller, G. H., Harning, D. J., Thorsteinsson, T., Magnússon, E., & Pálsson, F. (2018). Holocene glacier and climate variations in Vestfirðir, Iceland, from the modeling of Drangajökull ice cap. Quaternary Science Reviews, 190, 39–56. https://doi.org/10.1016/j.quascirev.2018.04.024
Brakenridge, G. R. (1978). Evidence for a cold, dry full-glacial climate in the American Southwest. Quaternary Research, 9(1), 22–40. https://doi.org/10.1016/0033-5894(78)90080-7
Guido, Z. S., Ward, D. J., & Anderson, R. S. (2007). Pacing the post–Last Glacial Maximum demise of the Animas Valley glacier and the San Juan Mountain ice cap, Colorado. Geology, 35(8), 739–742. https://doi.org/10.1130/G23596A.1
Menking, K. M., Anderson, R. Y., Shafike, N. G., Syed, K. H., & Allen, B. D. (2004). Wetter or colder during the Last Glacial Maximum? Revisiting the pluvial lake question in southwestern North America. Quaternary Research, 62(3), 280–288. https://doi.org/10.1016/j.yqres.2004.07.005
Menking, K. M. (2015). Decadal to millennial-scale solar forcing of last glacial maximum climate in the Estancia Basin of central New Mexico. Vassar College Environmental Research Institute. Retrieved from Vassar College.
