David Eccles School of Business
1 Environmental Rating Disagreement and Corporate Greenwashing Indicator: Evidence From S&P 500 Stocks
My Bui
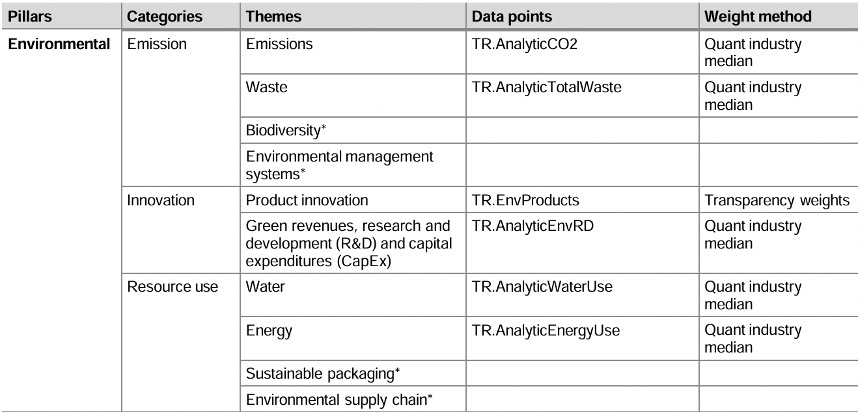
*No data points available that may be used as a proxy for ESG magnitude/materiality.
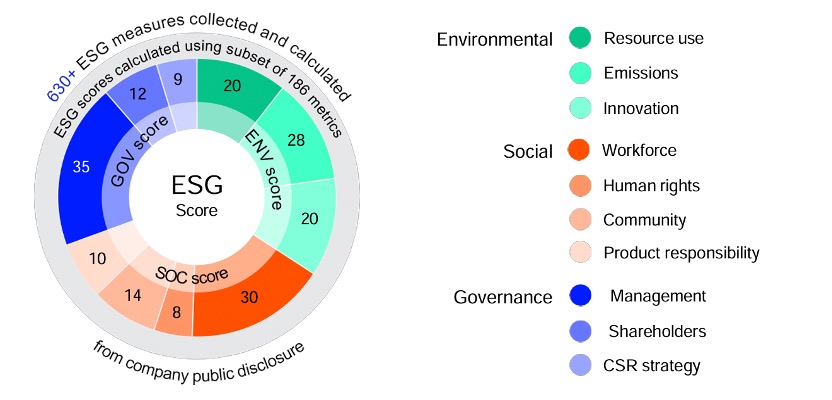
Source: LSEG. (2023). Environmental, social and governance scores methodology. London Stock Exchange Group.
Bloomberg Methodology5
The Environmental score in the Bloomberg Terminal incorporates six primary areas of evaluation: Greenhouse Gas (GHG) Emissions Management, Air Quality, Climate Exposure, Waste Management, Water Management, and Sustainable Products. The GHG Emissions Management category assesses a company’s ability to reduce carbon emissions through strategies like renewable energy adoption and compliance with global climate agreements, with scores normalized based on revenue or production. The Air Quality category measures pollutant management, such as sulfur dioxide (SO₂) and nitrogen oxides (NOₓ), rewarding companies that invest in pollution reduction technologies. The Climate Exposure category evaluates a company’s adaptation strategies to address risks such as extreme weather events and regulatory shifts, focusing on resilient infrastructure and mitigation policies. The Waste Management category considers metrics like waste intensity and recycling rates, while the Water Management category evaluates water efficiency and sustainable sourcing, particularly for industries with high water usage. Finally, the Sustainable Products category emphasizes innovation, assessing revenue from environmentally friendly products and green technology investments. Scores for each area range from 0 to 10 and are derived from company-reported data.
The Bloomberg’s methodology places strong emphasis on materiality and industry- specific factors, tailoring metrics to the unique risks and opportunities faced by companies. For instance, GHG emissions and energy efficiency are prioritized in manufacturing and energy-intensive sectors, while water management and waste reduction are more critical for agriculture and mining. The framework also accounts for national and ecological contexts, such as local climate policies, flooding risks, and air quality. Companies operating in regions with stricter environmental regulations or higher vulnerability to climate risks may have these factors reflected in their scores, ensuring a comprehensive evaluation.
The scoring system determines the weightings of environmental issues by assessing the probability, magnitude, and timing of financial impacts in three parts. The Disclosure Factor further promotes transparency by penalizing companies for incomplete or poor- quality data. This approach encourages companies to adopt robust reporting practices and provide comprehensive disclosures that improve the reliability of their scores.
Environmental scores are updated regularly to reflect new disclosures and validated through rigorous quality checks, including statistical and heuristic reviews, to ensure accuracy and consistency. These scores are integrated into the Bloomberg Terminal and Data License products, allowing users to benchmark performance across industries through percentile rankings. As part of Bloomberg’s overall ESG scoring system, the Environmental score provides investors, regulators, and analysts with a standardized framework to assess a company’s environmental management and alignment with sustainability objectives.
METHODOLOGY
This study analyzes S&P 500 companies (n=495), excluding those without complete Environmental scores in either Bloomberg or Refinitiv. The ERD is measured as the absolute difference between Bloomberg and Refinitiv Environmental scores for each company. Companies exceeding the median discrepancy of 23.67 are classified as having a “Large ERD.” Large discrepancies arise from selective disclosure, inconsistent frameworks, or differing weighting methodologies applied to environmental factors. While Bloomberg and Refinitiv employ distinct methodologies, the consistent finding of notable discrepancies raises concerns about reporting consistency and potential greenwashing. A significant discrepancy suggests that a company’s environmental narrative or reported performance data may not be consistently verifiable. When two independent rating systems produce a large gap, selective disclosure may be at play. This allows a company to achieve a higher score on one platform, potentially signaling greenwashing.
For this study, 74 line items are collected: 73 True/False disclosures and one numerical disclosure from the Refinitiv database. These line items are derived from the following studies:
- Dyck, I. J. A., Lins, K. V., Roth, L., & Wagner, H. F. (2019). Do Institutional Investors Drive Corporate Social Responsibility? International Evidence. Journal of Financial Economics Volume 131, Issue 3, March 2019, Pages 693-714.
- Dyck, I. J. A., Lins, K. V., Roth, L., Towner, M., & Wagner, H. F. (2024). Family- Controlled Firms and Environmental Sustainability: All Bite and No Bark. Finance Working Paper N° 983/2024. European Corporate Governance Institute (ECGI), Appendix A1, A2, 43-46.
Each of these 74 items is categorized as either “Material” or “Non-Material,” depending on whether it represents a measurable, practical factor with direct environmental impact (e.g., energy consumption, waste management) or is merely tied to policies, future targets, or broad commitments lacking clear, quantifiable outcomes. “Material” refers to a measurable and practical factor that contributes to the Environmental score. Items that fall under the “Material” category must have a significant and direct impact on the environment, focusing on actual outputs rather than vague policies or goals that serve to fulfill formalities or claim environmental friendliness. The description of a “Material” item includes factors tied to ongoing, measurable activities with tangible outcomes, rather than speculative initiatives, targets, or objectives that rely on uncertain actions and future results. If a factor meets these criteria, it is considered “Material” (“Yes”); otherwise, it is classified as “Non- Material” (“No”) (Figure 1). The table below shows the number of items within each category:
|
|
Emission Category |
Environmental Innovation Category |
ResourceUse Category |
Total |
|
Material Items |
5 |
7 |
5 |
17 |
|
Non-Material Items |
11 |
19 |
26 |
56 |
|
Numerical Item |
1 |
0 |
0 |
1 |
|
Total |
17 |
26 |
31 |
74 |
For 73 True/False disclosures, responses are translated into indicator variables. For questions with a positive direction (“True”), answers are assigned 0 for “False” and 1 for “True.” After this transformation, items are categorized into two groups: “Material” and “Non-Material.” To quantify reporting tendencies, the Material Ratio is calculated by summing the number of reported “Material” items and dividing it by the total number of “Material” items. Similarly, the Non-Material Ratio is determined using the same method. This approach provides a structured and systematic way to measure the extent of disclosures across different categories. This distinction is crucial because “Material” items offer stronger evidence of real-world environmental impact, whereas “Non-Material” items (e.g., aspirational policies or distant targets) may serve as “green PR” or “check-the-box” commitments for marketing if they lack measurable progress. Consequently, a company emphasizing numerous “Non-Material” disclosures but comparatively few “Material” ones could indicate potential greenwashing, relying on vague or feel-good commitments rather than presenting actual impact data and trackable results.
The numerical item “GHG Emissions Scope 1, 2, and 3 Estimated Total to Revenue USD in Million” measures the extent to which a company’s operations produce greenhouse gases relative to its revenue stream. A larger GHG emissions-to-revenue ratio suggests that a company’s operations generate significant greenhouse gases in relation to its revenue. This metric ensures comparability across industries and company sizes. High emissions intensity is a clear indicator of environmental impact, emphasizing the need for monitoring and mitigation. If a company claims strong environmental performance, one would expect to see a reduction in this measure over time as a reflection of genuine environmental responsibility. On the other hand, when an organization exhibits high or growing emissions intensity while marketing itself as environmentally responsible, it raises concerns about potential greenwashing. This is particularly evident when a company prioritizes “Non-Material” or superficial disclosures instead of addressing the core issues that significantly impact its environmental footprint. This ratio is selected because, among the various environmental factors, carbon emissions are particularly significant for companies, including family-controlled firms (Dyck et al., 2024). The authors argue that carbon emissions represent an existential risk that firms must manage effectively. This underscores that the GHG emissions-to-revenue ratio is the most important metric for evaluating environmental sustainability, as it directly reflects a company’s contribution to climate change. Dyck et al. (2024) further suggest that other qualitative environmental metrics, such as policies and targets, are less effective for addressing immediate climate risks. Their study indicates that not only family-controlled firms but also all companies should prioritize reducing carbon emissions as a fundamental aspect of their sustainability strategy.
Data on firm characteristics are collected from WRDS. Firm size is controlled using the natural logarithm of total assets, as it captures the effects of scale economies and market power associated with a firm’s size. Return on assets (ROA) is calculated as net income divided by total assets, reflecting a firm’s efficiency in generating profits from its assets. Return on equity (ROE) is calculated as net income divided by common shares outstanding multiplied by the closing price, reflecting shareholder profitability. Leverage is defined as total liabilities divided by total assets, representing a firm’s financial risk and capital structure decisions.
To investigate the drivers of ERD, an Ordinary Least Squares (OLS) regression model is employed. The dependent variable is the ERD, representing the absolute discrepancy between Bloomberg and Refinitiv Environmental scores. Independent variables include firm characteristics and disclosure metrics, categorized as Material Ratio, Non-Material Ratio, and GHG Emissions to Revenue, along with control variables for firm size, financial performance, and industry classification.
The regression of the as follows:
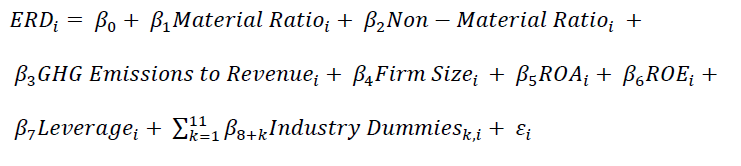
Where:
- ERD measures the absolute Environmental score discrepancy.
- Material Ratio is the proportion of “Material” disclosures to total “Material” items.
- Non-Material Ratio is the proportion of “Non-Material” disclosures to total “Non- Material” items.
- GHG Emissions to Revenue is the ratio of greenhouse gas emissions to revenue in USD millions.
- Firm Size is the natural logarithm of total assets.
- ROA reflects efficiency in generating profits from assets.
- ROE captures shareholder profitability.
- Leverage measures financial risk as the ratio of total liabilities to total assets.
- Industry Dummies represent eleven sectoral classifications for controlling industry-level effects using Global Industry Classification Standard (GICS).
This study also conducts industry-specific OLS regressions to further analyze the drivers of ERD. This approach examines how the relationships between independent variables and ERD vary across different industry sectors. Eleven regressions are performed, one for each industry classification, using the same dependent variable and independent variables as in the full model regression.
For each industry, the regression model is structured as follows:
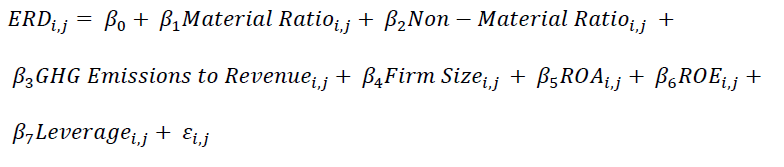
Where:
- 𝑖 indexes individual firms, and 𝑗 represents the industry.
- The independent variables and controls remain consistent across all regressions to ensure comparability.
These industry-specific regressions are conducted to capture potential variations in the explanatory power and significance of the independent variables across sectors. For instance, the role of “Material” and “Non-Material” disclosures or the intensity of GHG Emissions to Revenue might differ between industries with different environmental impacts.
Each regression analysis is conducted using Python in Google Colab, a cloud-based notebook platform that enables seamless integration of Python libraries and supports collaborative work. Robust standard errors are applied to address heteroskedasticity concerns, and multicollinearity among independent variables was assessed using Variance Inflation Factors (VIFs). Diagnostic tests, including residual analysis and checks for multicollinearity, are repeated for each industry-specific regression to ensure the validity of the results. This approach provides deeper insights into sector-specific drivers of ERD and highlights the heterogeneity across industries. The inclusion of dummy variables for industry classifications helps account for unobserved heterogeneity across sectors. This methodology ensures that the relationships between disclosure metrics, firm characteristics, and ERD are rigorously evaluated, leveraging the computational power and collaborative features of Google Colab for efficient data analysis.
LIMITATION
In Figure 1, the categorization of whether a line item is “Material” inherently involves personal judgment, introducing subjectivity. This limitation could impact the reproducibility of the results. Incorporating inter-rater reliability assessments in future iterations of this research would provide a more robust evaluation of the classification process, ensuring consistency across different evaluators.
RESULTS
This section discusses the results of the study. Figure 2 presents a summary table of key descriptive statistics, highlighting significant variation across the main variables of interest. The average ERD between Bloomberg and Refinitiv is approximately 26.5 points, with a standard deviation of 18.1 and values ranging from near zero up to almost 80. This indicates that some firms are evaluated nearly identically by the two rating agencies, whereas others receive drastically different scores, potentially confusing investors who seek consistent assessments of a company’s environmental performance. Turning to the Material Ratio, firms range from as low as 0.176 to as high as 0.824, suggesting that while some companies prioritize “Material” environmental disclosures (such as operational emissions or resource usage), others emphasize different factors. The Non-Material Ratio also exhibits wide variation (from 0.185 to 0.661), implying that for some firms, nearly two-thirds of their environmental disclosures are not closely tied to core operations. Further highlighting this variability, the Material Ratio’s 10th and 90th percentiles range from 0.353 to 0.647, while the Non-Material Ratio’s percentiles range from 0.214 to 0.482. Such dispersion underscores significant heterogeneity across firms regarding their prioritization of “Non-Material” versus “Material” environmental information. Overall, these broad ranges and percentile values illustrate considerable differences among firms in both their financial and disclosure characteristics, setting the stage for the OLS analysis. This underscores that real-world disclosure practices can differ substantially across companies, potentially opening the door to “greenwashing” if less relevant (“Non-Material”) metrics inflate apparent sustainability.
Building on these descriptive insights, the following section presents empirical findings from an OLS regression analysis designed to further investigate the determinants of ERD between Bloomberg and Refinitiv scores. The analysis focuses on both firm-level and sector-specific variables, including the roles of the Material Ratio and Non-Material Ratio, financial characteristics, and industry classification. The results are structured to first describe the overall model performance and key predictors, followed by an in-depth examination of how these relationships vary across different industry sectors. The findings offer key insights into the drivers of inconsistency in ESG evaluations and raise important implications for investors, rating agencies, and policymakers concerned with transparency and accountability in sustainability reporting.
The analysis begins by examining the overall model performance. The OLS regression model (Figure 3) evaluates the determinants of ERD, aiming to uncover the underlying drivers of discrepancies between Bloomberg and Refinitiv scores. The model is an overall fit, as 16.4% of the variation in ERD is explained by the included predictors. Moreover, it is statistically significant, with a Prob (F-statistic) of 2.97e-11, suggesting that at least one of the predictors meaningfully explains the variation in ERD.
Among the predictors, the Material Ratio affects ERD, with a positive coefficient of 18.7555 (p = 0.036). Practically, this means a firm increasing its emphasis on “Material” disclosures from 10th percentile to 90th percentile would experience an average increase in ESG rating discrepancies of about 5.516 points (Figure 2). However, the Non-Material Ratio exhibits a stronger and highly significant relationship with ERD. For a firm moving from the 10th to the 90th percentile of the Non-Material Ratio, the estimated ERD increases by about 12.004 points, based on a coefficient of 44.8155 (Figure 2). Compared to the overall distribution of ERD numbers across firms, that is a very large and economically meaningful increase, indicating that “Non-Material” factors substantially drive discrepancies between Bloomberg and Refinitiv Environmental ratings. Such a large difference raises concerns about potential greenwashing practices, as companies might exploit “Non-Material” disclosures to appear more sustainable without making substantive improvements. “Non-Material” items, often less directly tied to environmental or operational performance, may signal potential greenwashing practices. Firms may leverage these metrics to inflate their Environmental scores without implementing substantive sustainability initiatives. This finding is particularly concerning, as it suggests that companies emphasizing “Non-Material” environmental metrics are prone to much larger discrepancies in their ratings so investors should therefore closely analyze the description of environmental metrics to better assess true sustainability performance.
The full model regression analysis identifies the Financials sector as having a strong and statistically significant positive effect on ERD, suggesting that firms in this sector experience greater ERD, possibly due to the complex nature of financial firms’ environmental disclosures. This reflects the unique challenges in assessing environmental performance for financial institutions. Unlike industries such as Energy or Materials, where environmental performance is measured through tangible metrics like carbon emissions and waste management, financial firms’ environmental impact is largely indirect, tied to factors such as responsible lending practices, investment policies, and green bond financing. Key factors influencing financial firms’ Environmental ratings include the issuance of green bonds, sustainability-linked loans, and climate-focused funds, as well as policies restricting financing for fossil fuel projects and other high-emission industries.
Additionally, financial institutions are assessed based on the carbon footprint of their own operations, including their transition to renewable energy, energy efficiency investments, and paperless initiatives. A major component of their Environmental rating is climate- related financial disclosure, where adherence to frameworks like the TCFD and regulatory requirements such as the EU Taxonomy or SEC Climate Disclosure Rules can influence scores. Furthermore, discrepancies arise due to methodological differences among ESG rating agencies. For instance, Bloomberg may assign a lower Environmental rating to a financial institution due to its high exposure to fossil fuel financing, whereas Refinitiv may place greater emphasis on green bond issuances and sustainable investment offerings, leading to variations in ERD. These differences in rating methodologies contribute to the statistically significant effect of the Financials sector on ERD, as observed in the regression results. This finding underscores the need for tailored ESG evaluation approaches that better reflect the unique environmental impact of financial institutions and enhance comparability across rating agencies.
On the other hand, GHG Emissions to Revenue and standard financial metrics, including Firm Size, ROE, ROA, and Leverage, generally show limited or no statistical significance in explaining ESG rating discrepancies. For example, GHG Emissions to Revenue, despite its theoretical relevance in evaluating environmental performance, exhibits no significant relationship with ERD (coefficient = –0.0002, p = 0.882). This suggests that discrepancies are less influenced by objectively measurable environmental or financial performance indicators and more by methodological differences and subjective assessments in environmental evaluations.
To explore specific drivers of ERD in greater detail, the following part presents the results of regression analyses of ERD, each corresponding to a distinct industry sector. This approach provides valuable insights into how the determinants of ERD vary across industries. One of the most salient findings is the significant positive association between the Non-Material Ratio and ERD in the Industrials sector (Figure 4) and the Real Estate sector (Figure 5). A marginally significant association is also observed in the Consumer Discretionary sector (Figure 6) and the Information Technology sector (Figure 7). This pattern indicates that greater reliance on “Non-Material” disclosures tends to exacerbate disagreements between Bloomberg and Refinitiv.
In the Industrials sector, although firms increasingly signal a strategic shift toward greener operations, such as transitioning to renewable energy or adopting cleaner technologies, these initiatives are often part of long-term plans rather than current operational practices. Consequently, a temporal mismatch arises between reported commitments and realized environmental performance. The question of when such transitions will actually be implemented introduces uncertainty, and rating agencies may differ in how they account for forward looking disclosures versus present realities, thereby contributing to ERD. Additionally, both Firm size and GHG Emissions to Revenue are significant predictors in this sector, indicating that larger firms with more standardized disclosures and firms with measurable emissions intensity may elicit more consistent ratings.
Within the Real Estate sector, green building practices are frequently promoted as evidence of environmental responsibility. However, such developments are associated with significantly higher initial costs due to the premium pricing and limited availability of sustainable materials. Estimates suggest that green construction may increase costs by approximately 10% to 20%, requiring design compromises or increased budgets. Although these upfront expenses are often justified by anticipated long term savings and health benefits such as reduced energy and water usage, the actual realization of such returns remains inconsistent6. Both “Material” and “Non-Material” disclosures are significantly associated with ERD, suggesting that agencies may diverge in how they assess the cost benefit tradeoffs of sustainability claims in this capital-intensive sector.
In the Consumer Discretionary sector, particularly in the context of fast fashion, companies frequently highlight the use of recycled or environmentally friendly materials and supply chain sustainability as part of their sustainability strategies. Nevertheless, such initiatives are often implemented within a broader business model defined by rapid production cycles, high volumes of consumption, and short product lifespans. While these “Non-Material” disclosures may enhance environmental profiles, they do not necessarily address the sector’s underlying environmental impact. The marginal significance of the Non-Material Ratio implies that agencies may apply varying levels of skepticism or approval depending on the importance they assign to such disclosures, leading to inconsistent Environmental ratings.
In Information Technology, the Non-Material Ratio is also marginally associated with ERD. Given the sector’s reliance on intangible assets like software and intellectual property, environmental metrics that lack clear operational ties may be more difficult to interpret uniformly. This reinforces the concern that traditional ESG frameworks may struggle to capture meaningful differences in sustainability performance in digital or innovation-based sectors.
Across most sectors, firm specific financial metrics such as Leverage, ROE, and ROA have limited influence on ERD. In contrast, within the Financials sector (Figure 8), profitability metrics such as ROE and ROA are significantly associated with ERD. The positive relationship with ROE and the negative relationship with ROA suggest that rating agencies may interpret profitability differently when assessing ESG performance in financial firms. This discrepancy may reflect how certain profitability indicators are used to signal financial strength and attract investment, potentially leading to upward bias in ESG scores when agencies place disproportionate emphasis on return-based metrics.
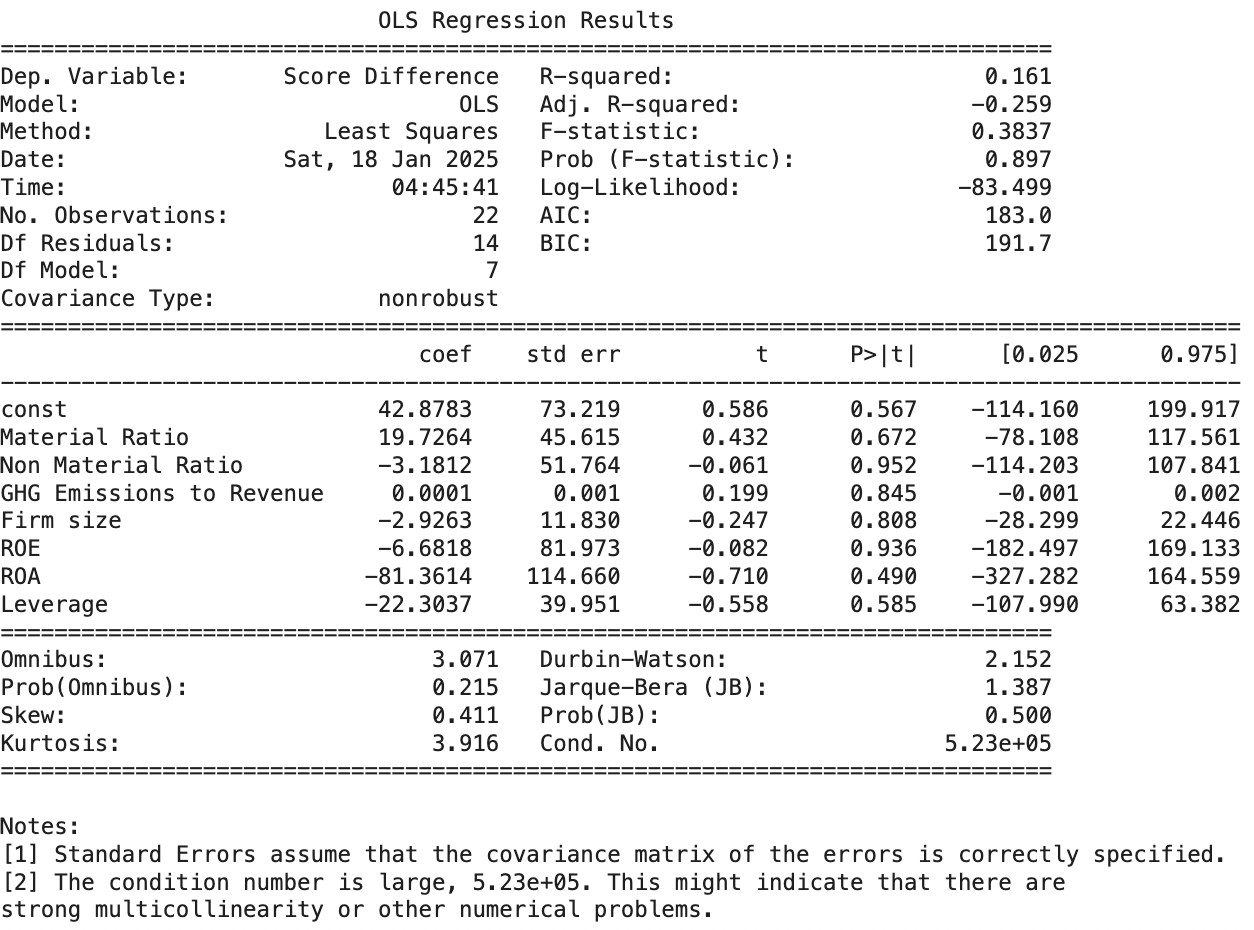
A particularly noteworthy case is the Energy sector (Figure 9), where the core business model is inherently linked to environmental impact. Despite this, the regression results reveal an absence of statistically significant ESG variables. For instance, no ESG metrics are statistically significant in the Energy sector, including GHG Emissions to Revenue. This raises concerns about the consistency and robustness of Environmental assessments in industries where emissions are central to operations.
Overall, the results of this study reveal that discrepancies between Bloomberg and Refinitiv Environmental ratings are primarily driven by differences in how “Non-Material’ disclosures are weighted and interpreted across sectors. The Non-Material Ratio emerges as the most consistent and economically meaningful predictor of ERD, particularly in the Industrials and Real Estate sectors, and to a lesser extent in Consumer Discretionary and Information Technology. These findings suggest that ERD are less influenced by objective, performance-based indicators and more by the methodological subjectivity inherent in ESG frameworks. In contrast, traditional financial metrics such as ROE, ROA, Firm Size, and Leverage demonstrate limited explanatory power for ERD across most sectors, with the notable exception of the Financials sector, where ROE and ROA significantly affect score differences. This reflects the complexity of evaluating sustainability in sectors with intangible environmental impacts and highlights how profitability metrics may contribute to divergent Environmental assessments. Perhaps most critically, the lack of significant environmental predictors in the Energy sector, despite its high emissions intensity, raises important concerns about the reliability and consistency of environmental evaluations of Refinitiv in emission-heavy industries. These findings emphasize the urgent need for more transparent, standardized, and materiality focused Environmental assessment frameworks that can reduce ambiguity, improve comparability, and support informed decision-making for investors and stakeholders across diverse industries.
CONCLUSION
This study investigates the determinants of ERD between Bloomberg and Refinitiv, focusing on whether such discrepancies can serve as indicators of corporate greenwashing within S&P 500 companies. By combining firm-level analysis with sector-specific regressions, the study provides compelling evidence that ERD is significantly influenced by the extent of “Non-Material” environmental disclosures. This pattern suggests that companies may strategically highlight aspirational, policy-oriented sustainability information to enhance their Environmental ratings, without necessarily committing to measurable or impactful environmental action.
A key contribution of this study lies in identifying the Non-Material Ratio as the most economically and statistically significant driver of ERD across several industries, particularly Industrials, Real Estate, and, to a marginal extent, Consumer Discretionary and Information Technology. This finding reinforces the concern that superficial sustainability disclosures, which are not clearly tied to operational performance, are more prone to subjective interpretation by rating agencies, thereby widening score gaps, and potentially enabling greenwashing behavior.
The regression analysis also reveals that conventional financial indicators, such as Firm Size, Leverage, ROE, and ROA, exert limited influence on ERD in most industries. Notably, the Financials sector stands out as an exception, where profitability metrics significantly affect ERD potentially reflecting diverging interpretations of financial strength and environmental responsibility. Even more concerning is the Energy sector, where GHG Emissions to Revenue are not statistically significant. This absence of meaningful predictors in a sector intrinsically tied to emissions raises questions about the robustness and consistency of environmental evaluations in high-impact industries.
In conclusion, the results suggest that ERD is less about what firms do in practice and more about how rating agencies interpret the disclosures, particularly when these disclosures are vague, “Non-Material”, or inconsistently weighted. These findings highlight a pressing need for stronger standardization and transparency in Environmental rating methodologies. Investors, regulators, and stakeholders should treat large ERD as potential red flags, especially when accompanied by an overemphasis on “Non-Material” disclosures. Ultimately, this research advances the understanding of greenwashing risk by quantifying the relationship between ERD and disclosure practices, offering a concrete step forward in improving the accountability and comparability of Environmental ratings. As ESG continues to shape the future of finance, ensuring that Environmental scores reflect genuine performance rather than marketing spin is essential for building trust and driving real sustainability.
FIGURES
Figure 1. Environmental Indicator Variables
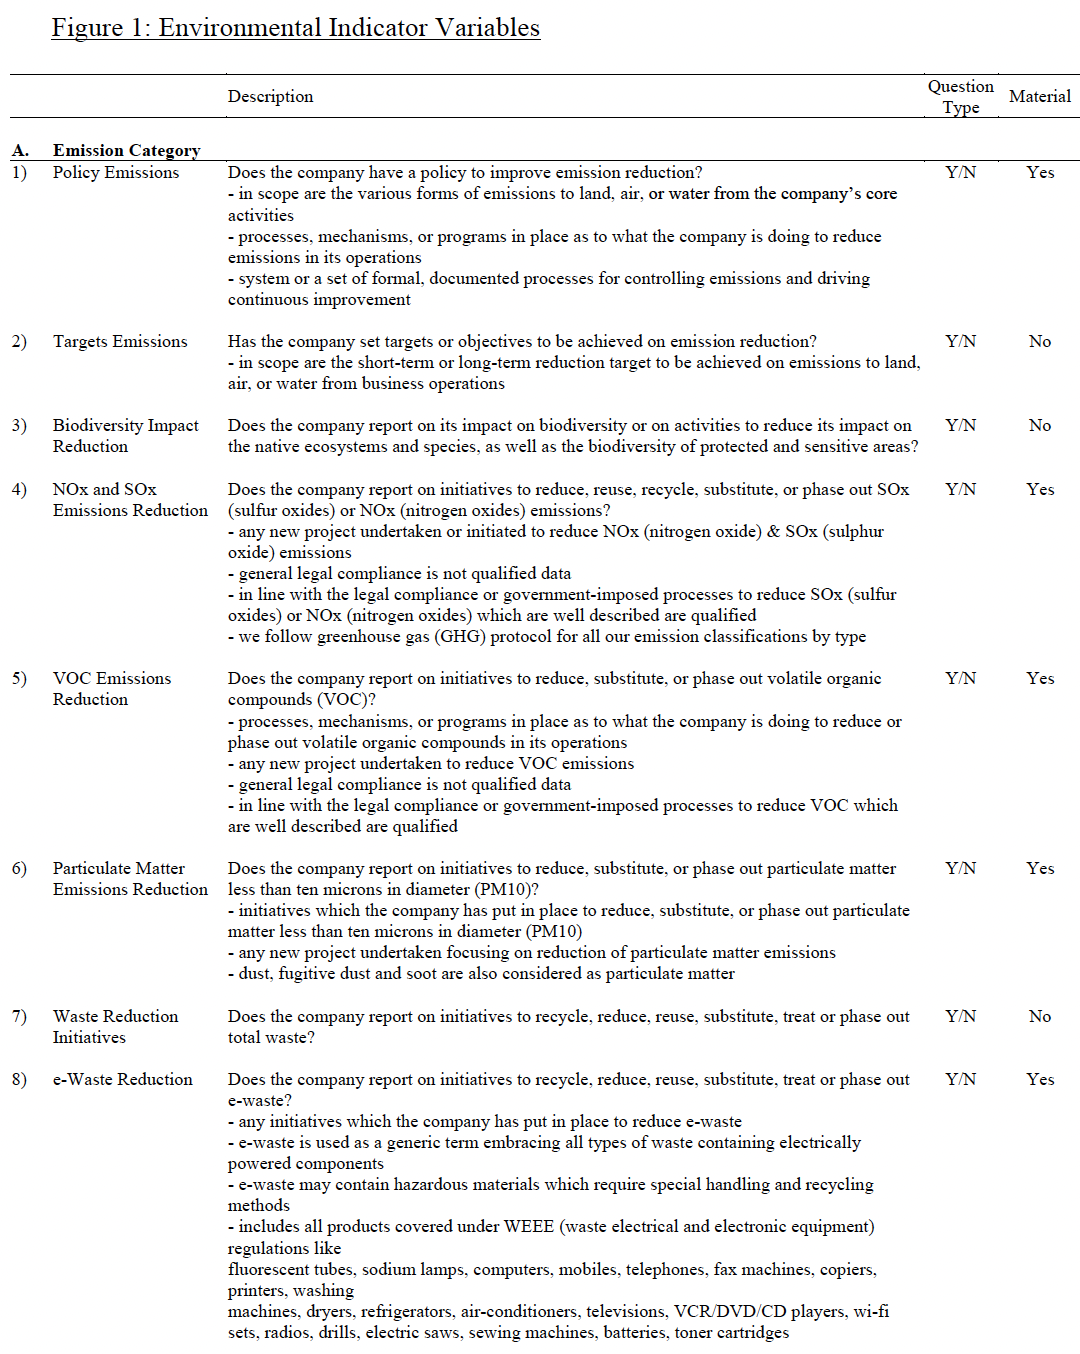

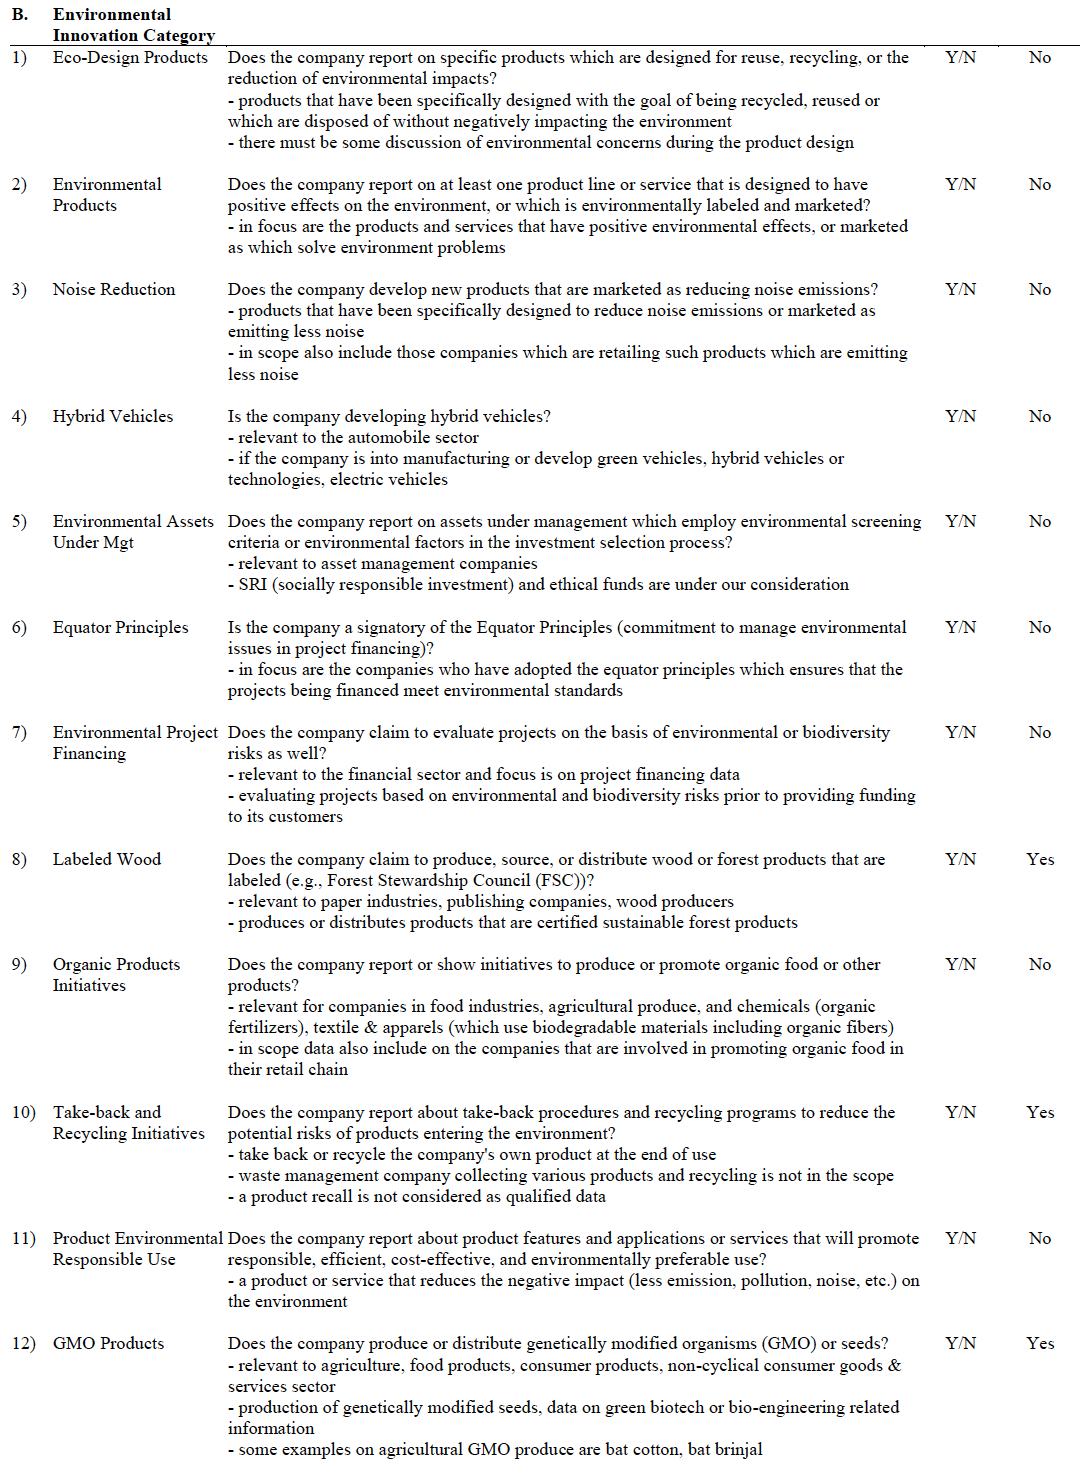
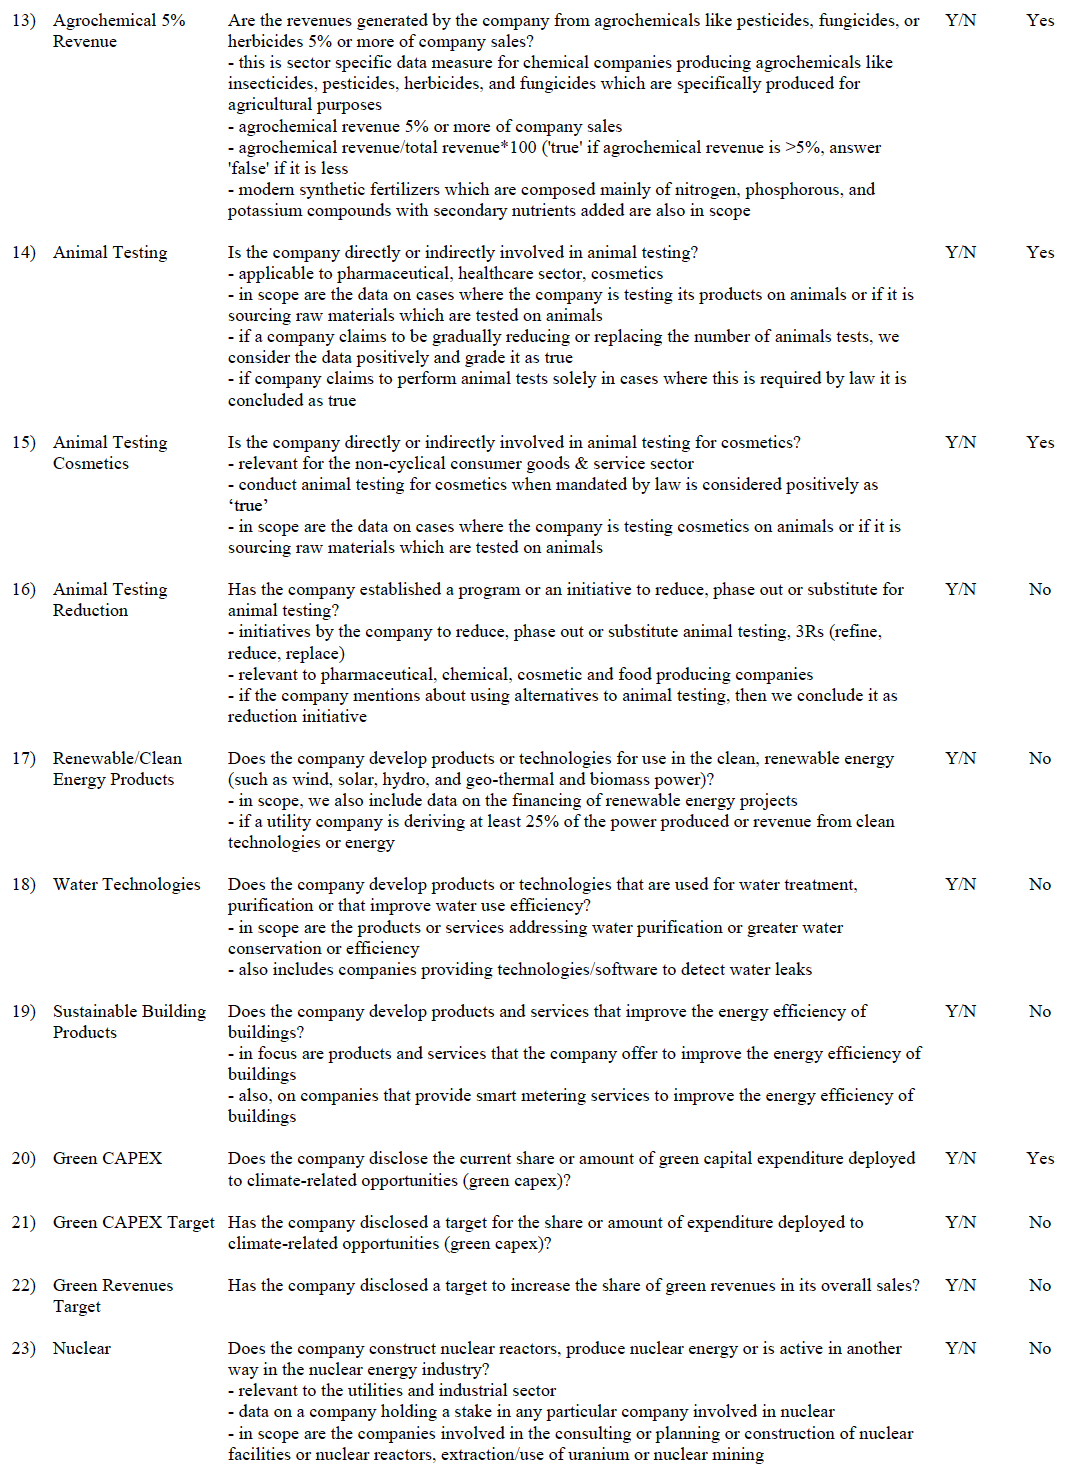
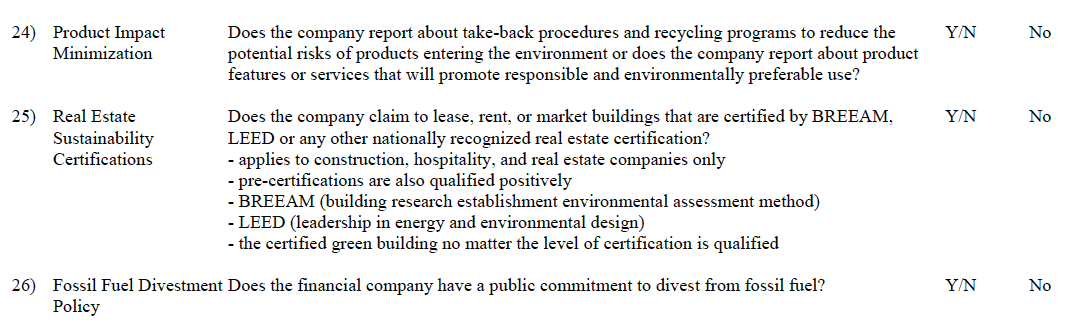
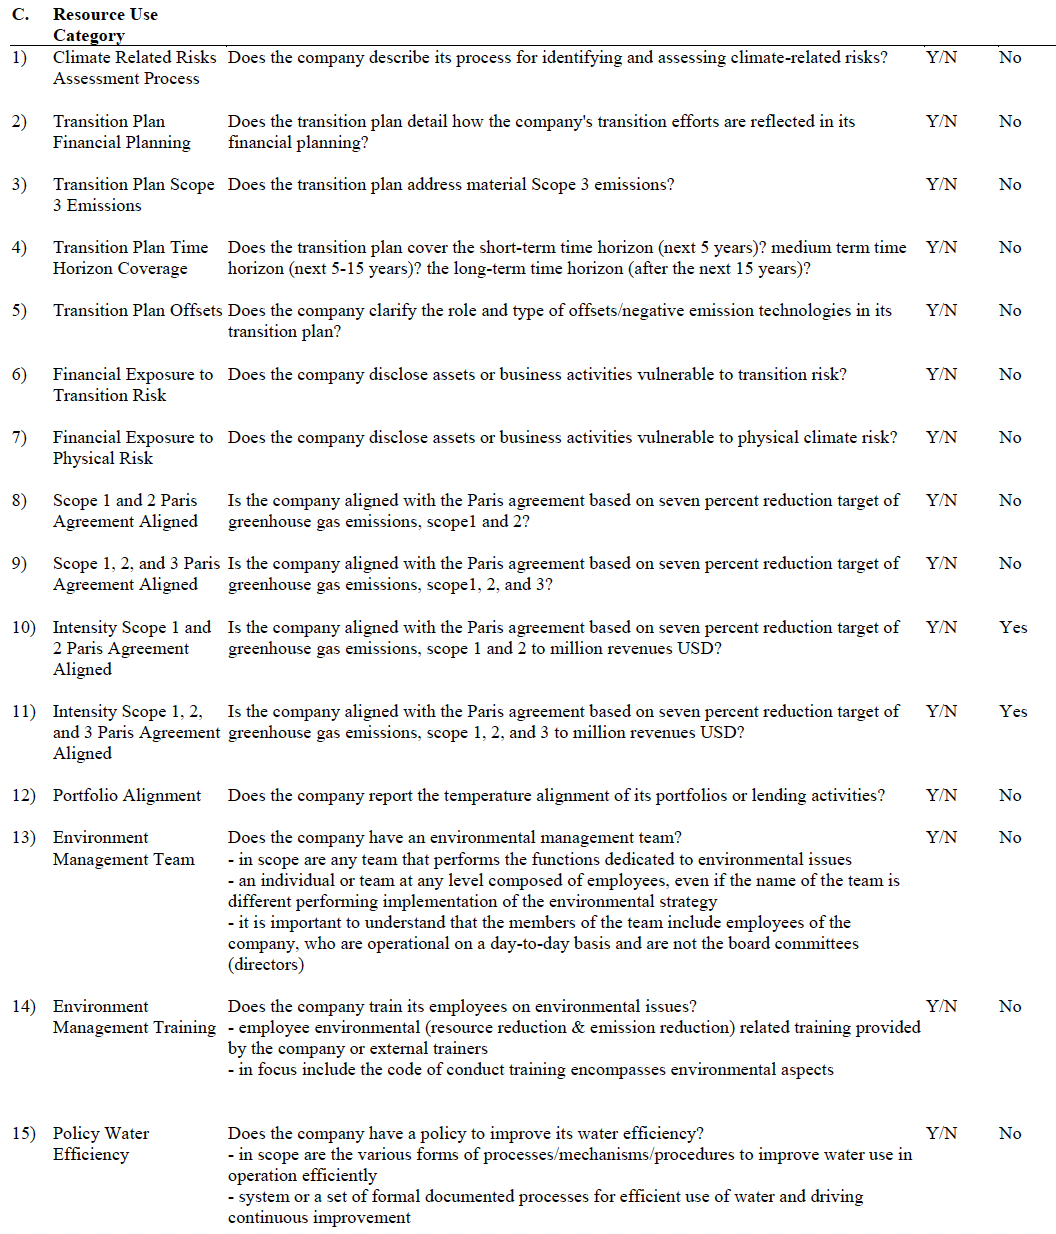
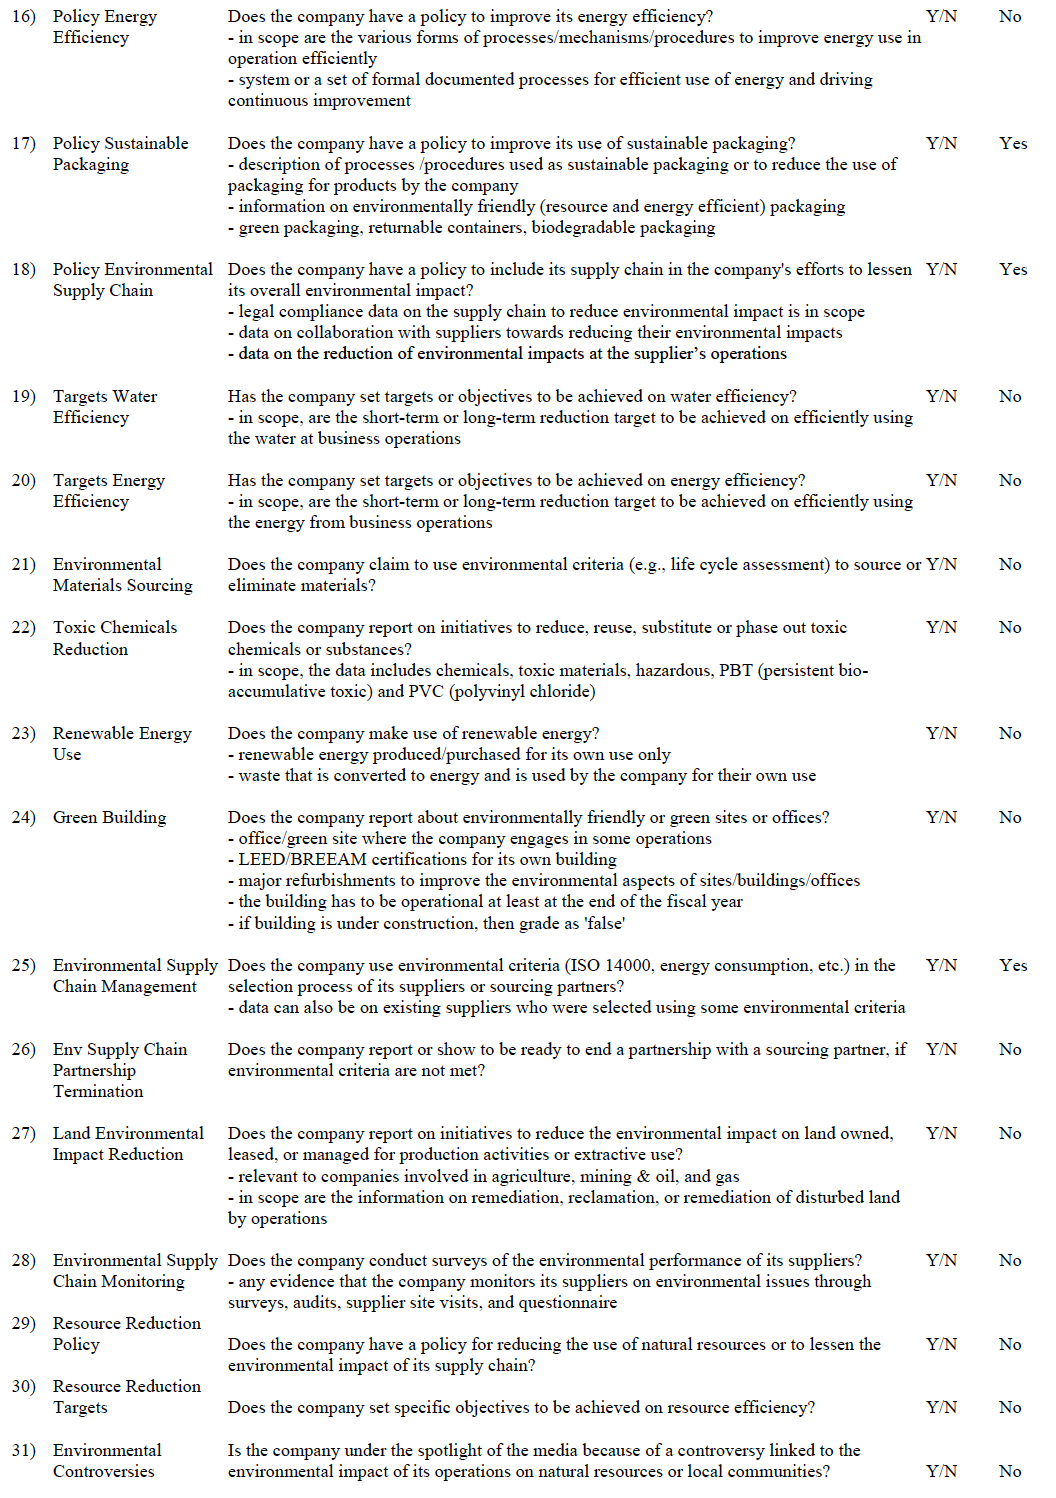
Figure 2. Summary Statistics Table
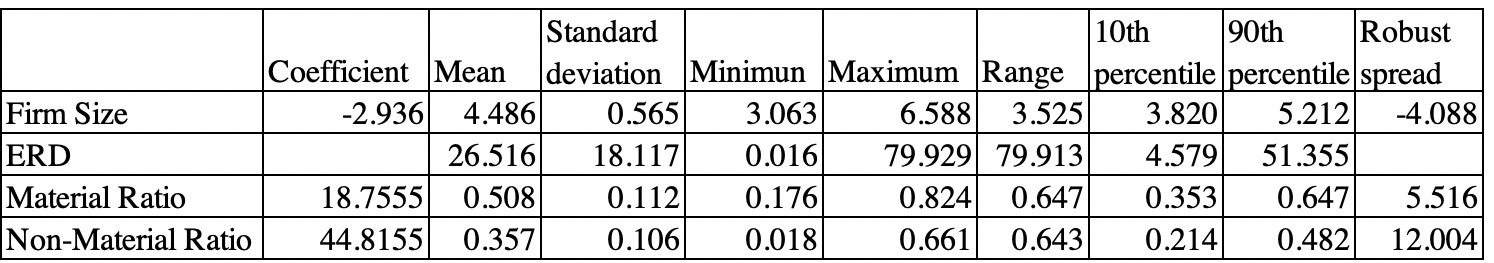
Figure 3. OLS Regression Result for the Full Model
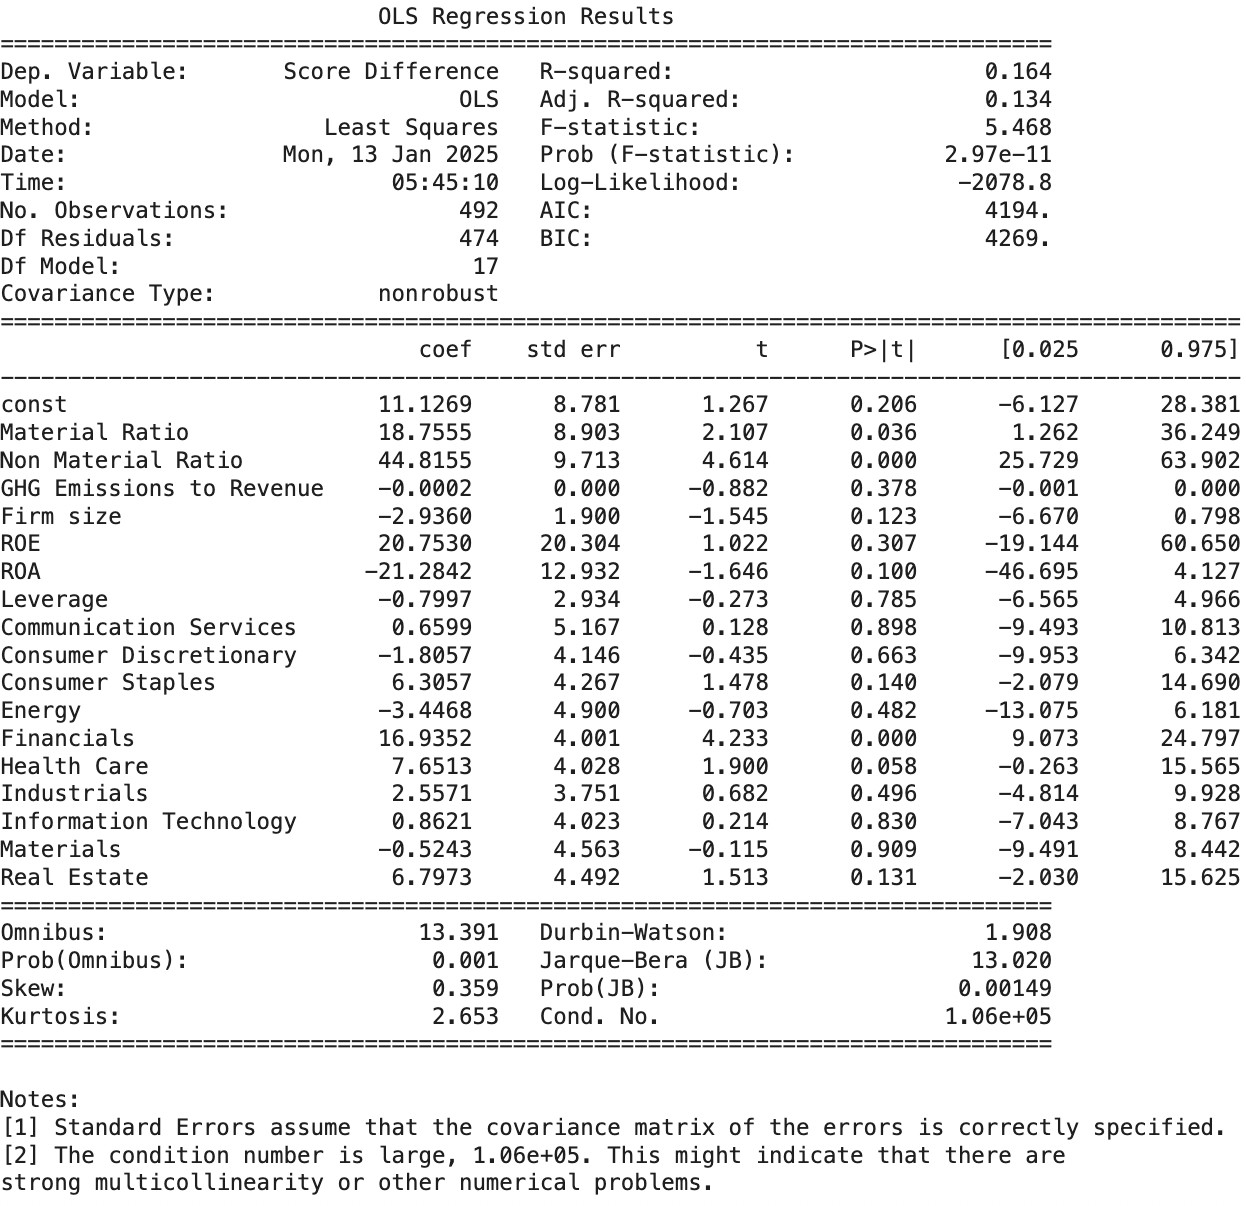
Figure 4. OLS Regression Result for the Industrials sector

Figure 5. OLS Regression Result for the Real Estate sector
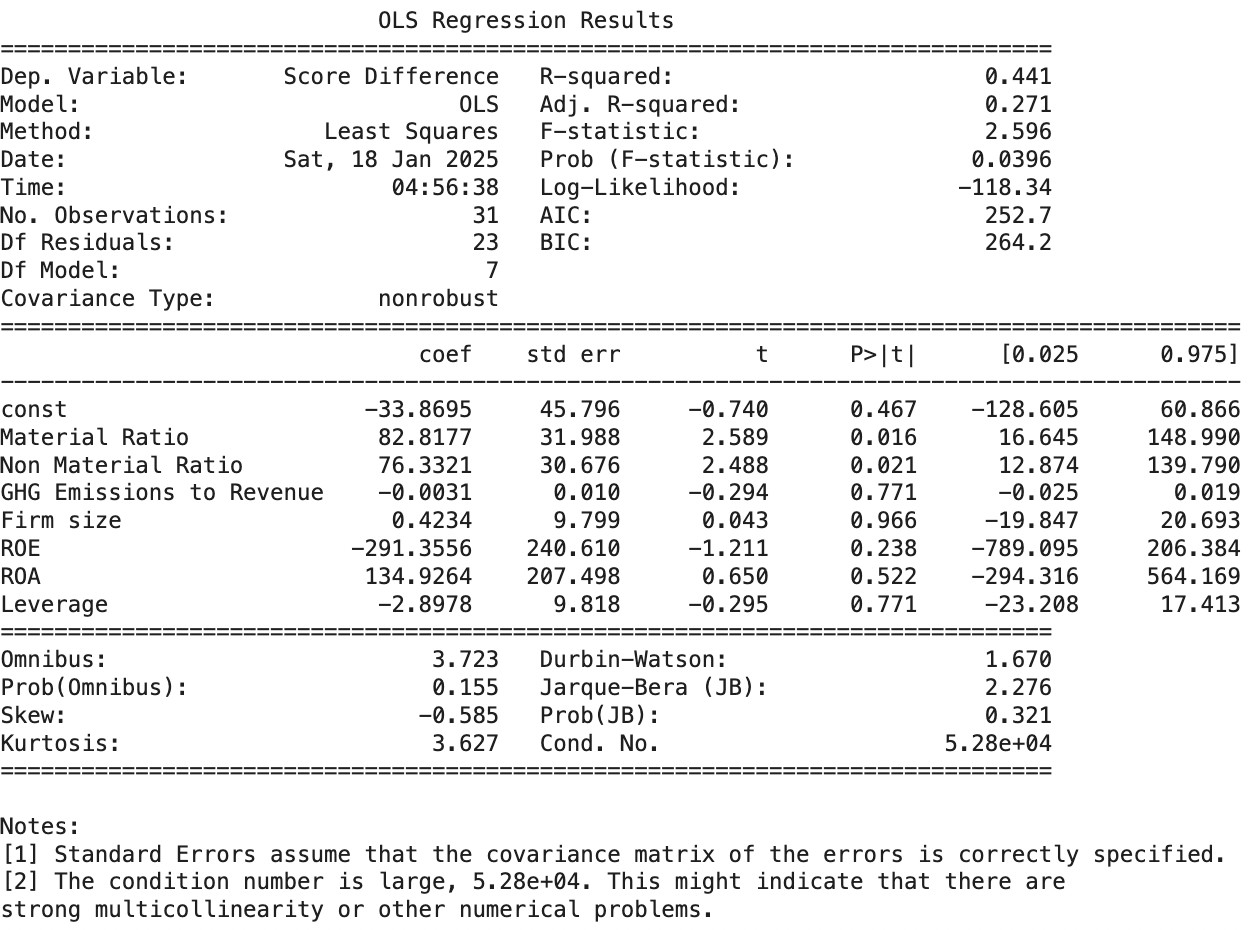
Figure 6. OLS Regression Result for the Consumer Discretionary sector
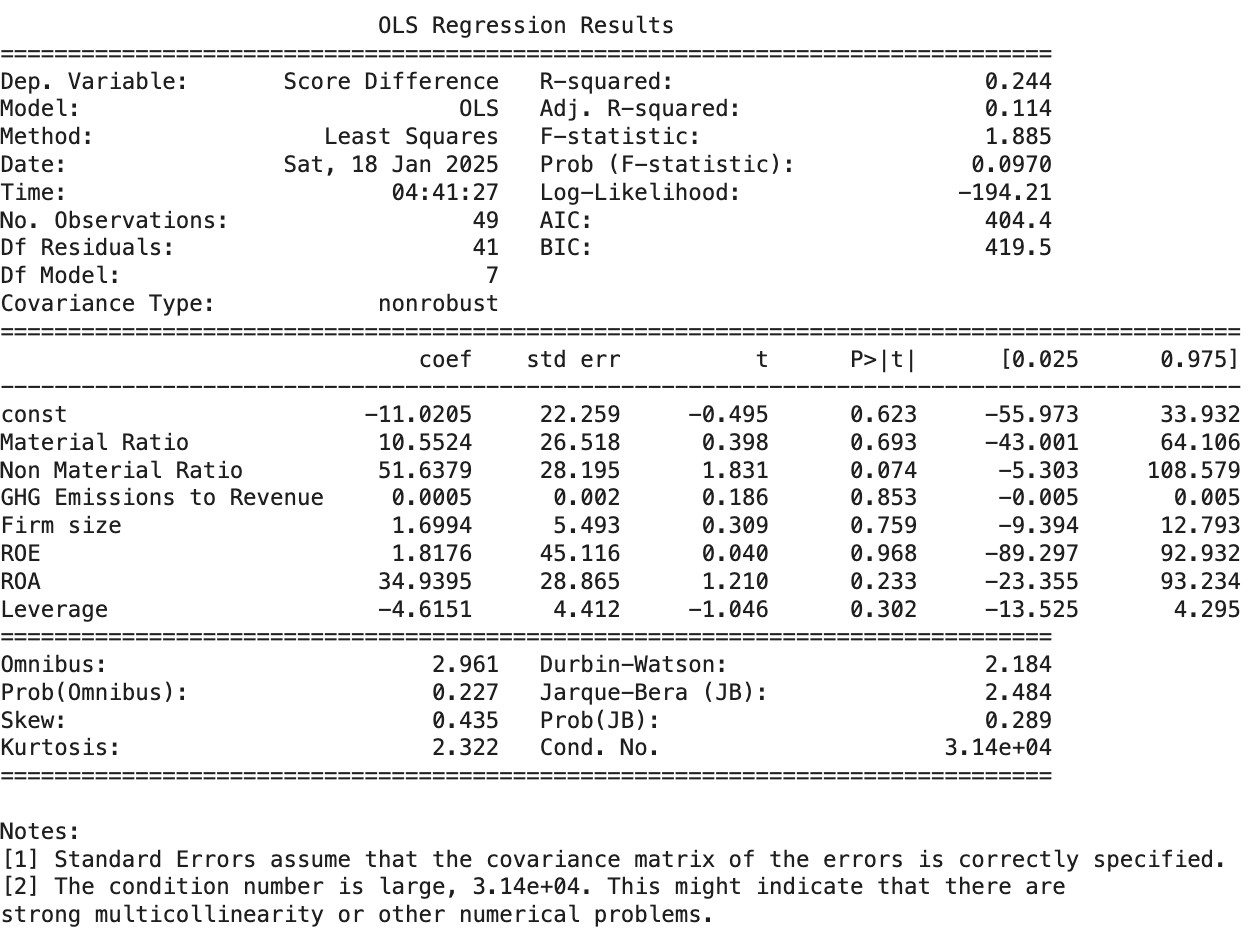
Figure 7. OLS Regression Result for the Information Technology sector

Figure 8. OLS Regression Result for the Financials sector
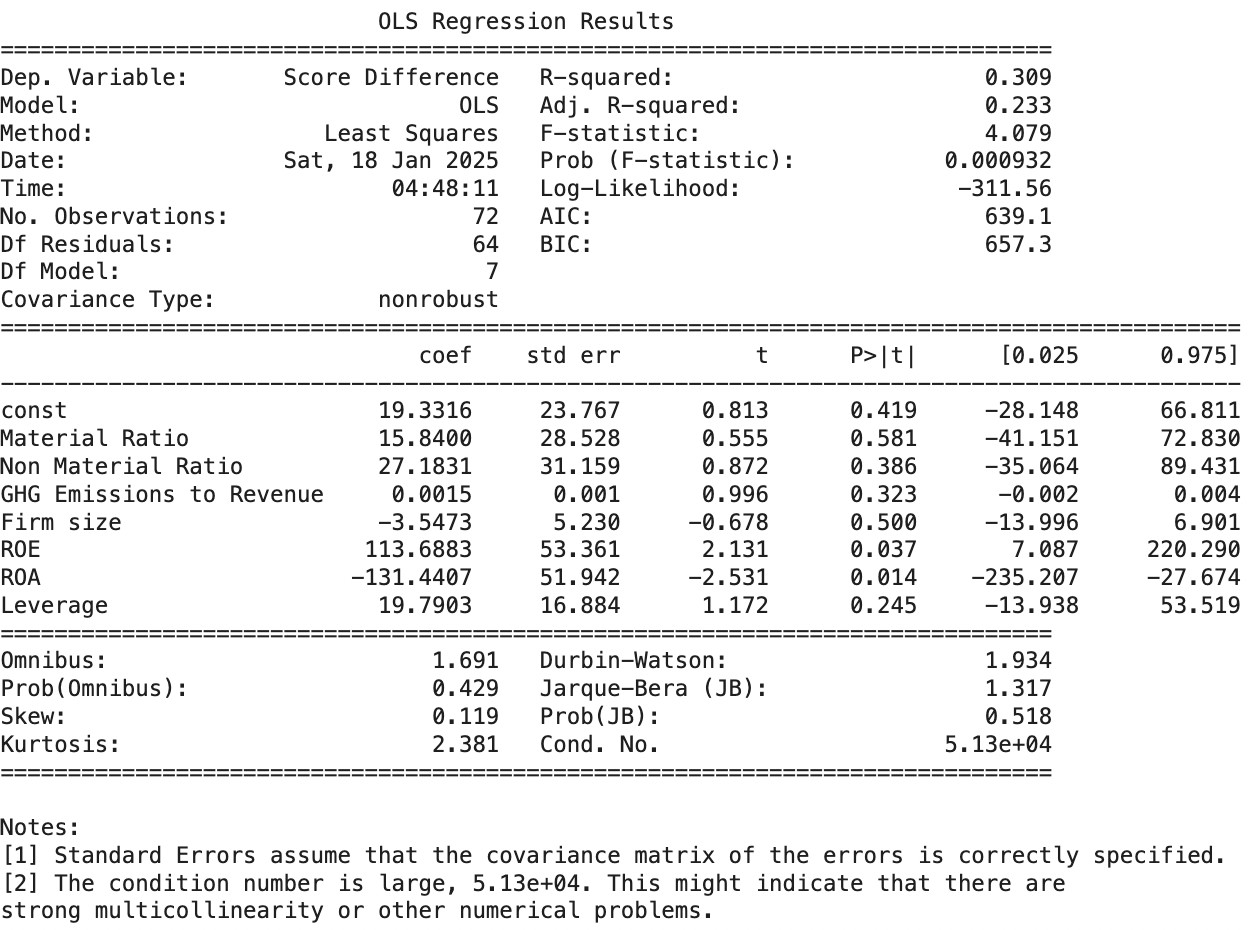
Figure 9. OLS Regression Result for the Energy sector
Bibliography
Berg, F., Kölbel, J. and Rigobon, R. (2022). Aggregate confusion: The divergence of ESG ratings. MIT Sloan Research Paper No. 5822-19, 3, 8, 12, 16-17, 21.
Bingler, J., Kraus, M., and Webersinke, N. (2024). How cheap talk in climate disclosures relates to climate initiatives, corporate emissions, and reputation risk. Council on Economic Policies, University of Erlangen-Nuremberg, and University of Zurich and Swiss Finance Institute. Financial Analysts Journal, 4-12.
Delmas, M. A. and Burbano, V. C. (2011). The drivers of greenwashing. California Management Review 54(1), 4-9, 22.
Dumitrescu, A., Gil-Bazo, J., and Zhou, F. (2022). Defining greenwashing. Working Paper. ESADE Business School, Universitat Ramon Llull, Universitat Pompeu Fabra, and Toulouse Business School, 6-9,11.
Dyck, I. J. A., Lins, K. V., Roth, L., & Wagner, H. F. (2019). Do Institutional Investors Drive Corporate Social Responsibility? International Evidence. Journal of Financial Economics Volume 131, Issue 3, March 2019, Pages 693-714.
Dyck, I. J. A., Lins, K. V., Roth, L., Towner, M., & Wagner, H. F. (2024). Family- controlled firms and environmental sustainability: All bite and no bark. Finance Working Paper N° 983/2024. European Corporate Governance Institute (ECGI), Appendix A1, A2, 43-46.
Edmans, A., and Kacperczyk, M. (2022). Sustainable finance. Review of Finance, 26(6), 1309-1313.
Friede, G., Busch, T. and Bassen, A. (2015). ESG and financial performance: Aggregated evidence from more than 2000 empirical studies. Journal of Sustainable Finance and Investment 5(4), 210-212.
Gibson, B. R., Krueger, P. and Schmidt, P. S. (2021). ESG rating disagreement and stock returns. Finance Working Paper N° 651/2020, European Corporate Governance Institute, 4-18.
Gompers, P., Ishii, J., & Metrick, A. (2003). Corporate governance and equity prices. The Quarterly Journal of Economics, 118(1), 18-29.
Harford, J., S. Mansi, and W. Maxwell, 2008. Corporate governance and firm cash holdings in the US, Journal of Financial Economics, 87, 535-555.
Lins, K. V., Roth, L., Servaes, H., & Tamayo, A. (2024). Sexism, culture, and firm value: Evidence from the Harvey Weinstein scandal and the #MeToo movement. Journal of Accounting Research, 1-6.
Pollman, E. (2024). The making and meaning of ESG. Harvard Business Law Review, Vol. 14, 413-414.
Serafeim, G., & Yoon, A. (2020). Stock price reactions to ESG news: The role of ESG ratings and disagreement. Review of Accounting Studies, 3-6, 26-27.
Endnotes
1 https://www.bloomberg.com/professional/insights/markets/is-tesla-esg-many-funds-own-it-we-say-its- not-for-everyone/
2 https://www.morningstar.co.uk/uk/news/221629/this-is-why-teslas-esg-rating-isnt-great.aspx
3 https://corpgov.law.harvard.edu/2022/11/10/esg-ratings-a-call-for-greater-transparency-and-precision/#1b
4 LSEG. (2023). Environmental, social and governance scores methodology. London Stock Exchange Group. chrome-extension://efaidnbmnnnibpcajpcglclefindmkaj/https://www.lseg.com/content/dam/data- analytics/en_us/documents/methodology/lseg-esg-scores-methodology.pdf
5 Bloomberg. (2023). Bloomberg ESG scores: Overview & FAQ. chrome- extension://efaidnbmnnnibpcajpcglclefindmkaj/https://hr.bloombergadria.com/data/files/Pitanja%20i%20o dgovori%20o%20Bloomberg%20ESG%20Scoreu.pdf
6 https://www.csklegal.com/newsroom/publications/the-dark-side-of-building- green#:~:text=In%20addition%2C%20the%20cost%20to,and%20the%20cost%20to%20construct
Media Attributions
- LSEG 2023 1
- LSEG 2023 2
- Capture
- Capture
- Figure 1-1
- Figure 1-2
- Figure 1-3
- Figure 1-4
- Figure 1-5
- Figure 1-6
- Figure 1-7
