John and Marcia Price College of Engineering
24 Experimental Investigation of Hydraulic Fracturing Using 2D Digital Image Correlation (2D-DIC): Methodology, Results, and Implications.
Sunghyun Kim
Faculty Mentor: Shahrzad Roshankhah (Civil and Environmental Engineering, University of Utah)
Introduction: Case Study and Literature Review
Hydraulic fracturing is an important technology that enables the efficient extraction of resources such as oil, natural gas, and geothermal energy by injecting high-pressure fluids to create fractures in low-permeability rocks underground. Increasing the hydraulic conductivity of rocks can greatly aid in the extraction of otherwise inaccessible resources. Current laboratory studies use homogeneous, isotropic materials such as polymethylmethacrylate (PMMA) to mimic hydraulic fracturing. Bunger (2008) used PMMA to observe the egg-shaped deformation of circular cracks at shallow depths, which was found to be consistent with observations in the field. In addition, Detournay (2016) analyzed in detail the propagation mechanism of tensile cracks induced by fluid pressure, explaining the basic principles of hydraulic fracturing. However, these studies are limited by the simplicity of the experimental materials, which do not reproduce the complex geological conditions of the real world. This leads to the limitations that prevent them from reflecting the complex and heterogeneous structure of real natural rocks.
To overcome the limitation, field-scale monitoring techniques have been developed to infer fracture dynamics through indirect measurements such as acoustic emission or surface fluid pressure (Gandossi, 2013). However, these methods have low spatial resolution, which limits their ability to clearly understand the complex interactions between fluids and rock during crack initiation and propagation. Alternatively, advanced imaging techniques such as X-ray, computed tomography (CT), and neutron imaging have been used to observe internal structural changes during crack propagation (Roshankhah et al., 2018, Higo et al., 2011). However, the high cost and inaccessibility of these techniques, as well as safety concerns due to radiation exposure, have hindered their widespread use.
A promising technique, 2D digital image correlation (2D-DIC) has emerged to overcome these limitations. The work of Agha et al. (2022) demonstrates that 2D-DIC can capture the full-length strain contours and crack deformation under a range of loading conditions, making it an important tool in the study of crack behavior. Given its cost-effectiveness and direct observation compared to existing advanced imaging techniques, 2D-DIC is considered a suitable alternative for studying natural cracks in environments that mimic field conditions.
To optimize the design of hydraulic fracturing, it is important to understand the interaction between hydraulic fracturing and natural fractures (NF). According to a study by Guo et al. (2017), hydraulic fractures (HFs) can intersect NFs, propagate along them, or be captured by them, which has important implications for the resulting fracture network and fluid flow. In addition, Weng et al. (2011) showed that factors such as stress anisotropy, natural fracture orientation, and interfacial friction determine the geometry of HF-NF interactions, which can result in a range of outcomes from simple fractures to complex networks. These studies suggest that the nature of natural fractures and their interactions should be considered in increasing the efficiency of hydraulic fracturing.
This study aims to utilize 2D-DIC to observe the interaction of HF and NF between natural cracks in a laboratory environment, which aims to bridge the gap between simple laboratory experiments and complex field conditions, thus providing a more comprehensive understanding of the crack propagation mechanism. It is expected to increase the precision and efficiency of hydraulic fracturing, minimize the environmental impact during resource extraction, and eventually contribute to the development of optimized energy recovery technologies.
Methodology: Experimental Setup and Test Procedure for Hydraulic Fracture Analysis Using 2D-DIC
Specimen Preparation
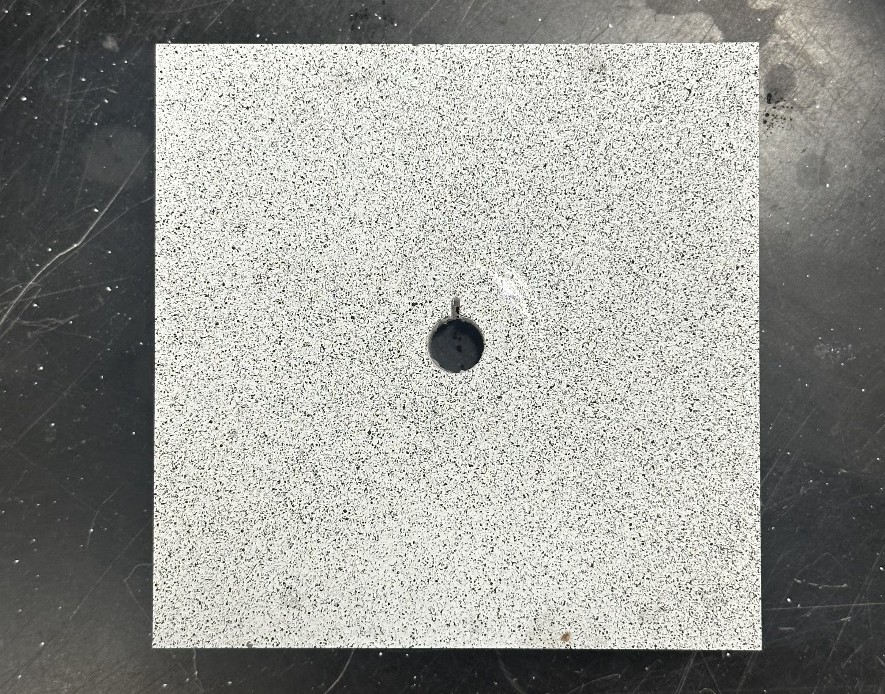
Figure 1. Specimen
A PMMA prismatic specimen with dimensions of 100 mm × 100 mm × 25 mm was prepared as the test specimen. PMMA has homogeneous and isotropic mechanical properties, which eliminates the anisotropy and heterogeneity found in natural rocks, allowing crack mechanics to be studied under controlled conditions. In addition, the optical transparency of PMMA allows direct observation of crack formation in real time, minimizing the need for advanced imaging techniques.
A 9.5 mm-diameter borehole was drilled in the center of each specimen, and a 3 mm-wide rectangular notch was machined starting at the edge of the borehole and running through the entire thickness. The notch is designed to ensure that the crack initiates at a constant origin, which increases the reproducibility of the crack behavior. The specimen surface was polished and then coated with a black-and-white speckle pattern to enable displacement and strain measurements for DIC analysis. The spray paint was uniformly applied from a distance of approximately 80 cm to achieve a 50:50 black-to- white ratio, and the density and size were verified using a speckle pattern generator.
Experimental Setup
The experiment consisted of a combination of a 2D-DIC system and hydraulic fracturing apparatus. The 2D-DIC system is based on a Lucid Vision Labs Atlas10 ATX470S-MT camera, equipped with a 47MP Sony IMX492 CMOS sensor. The camera has a resolution of 8,192 x 5,556 pixels and a pixel size of 9.24 μm, enabling the observation of highly detailed object variations. The monochrome sensor eliminates signal loss due to color filters and provides high contrast and light sensitivity; the square pixel design prevents data distortion.
The optical system uses a 100mm fixed-focus lens, which exhibits <0.05% distortion; this is most important in a DIC setup, where it is necessary to minimize the error of each shot with a very low distortion rate. The aperture range of f/5.6 to f/11 provides the optimal depth of focus and reduces diffraction effects for sharp images. Unlike zoom lenses, fixed-focus lenses provide stable performance by eliminating small vibrations during the imaging process, such as those from detailed parts, thus increasing the reliability of DIC analysis. The camera and data are connected via a 10GigE interface, and data can be transferred at frame rates up to 22.6 fps for accurate synchronization and data collection, even in time-sensitive experiments.
Test Procedure
First, the bottom plate is placed on the table, then a long rod is inserted and the nut is tightened to secure the plate. The reaction beam is then placed on the rod, and the left and right side plates are placed on the alignment of the bottom plate. The test object is inserted into the center hole of the side plate, and the injection tube is connected through the test object and the plate. All parts are fixed with vertical and horizontal bolts, and the tightening strength is gradually increased at each step to ensure structural stability.
After the specimen is prepared, the injection pump is operated at a flow rate of 9 ml/min to apply hydraulic pressure to the borehole. The pressure is increased and maintained until a crack is formed, at which point the pressure drops sharply with a popping sound. During this process, the DIC system records the surface deformation of the test piece in real time, and images are taken immediately after crack formation to increase the accuracy of the data.
Data Collection and Analysis
The camera’s exposure time can be adjusted from 125 μs to 10 seconds, which minimizes motion blur even during fast movements. The DIC system analyzes changes in the speckle pattern of the captured images to generate precise displacement and stress–strain data of the specimen. This data is utilized to understand the correlation between crack propagation mechanisms and experimental conditions. The pictures are analyzed after the experiment using correlated solution’s vic2d software.
Post-test Procedures
After the end of the test, the air and hydraulic valves are closed, and the system pressure is completely released through the pressure regulator. Then the structure of the test apparatus is disassembled, the surface of the test object and plate are cleaned, and the results are recorded by photographing all sides of the test object. The plate O-rings and injection tubing are cleaned of residue and debris, and then prepared for reuse. If there is a need to repeat the experiment, the procedure is repeated from the beginning, adjusting the pressure conditions.
Results Analysis
A comprehensive analysis of the four strain and displacement data was obtained by 2D-DIC.
Horizontal Strain
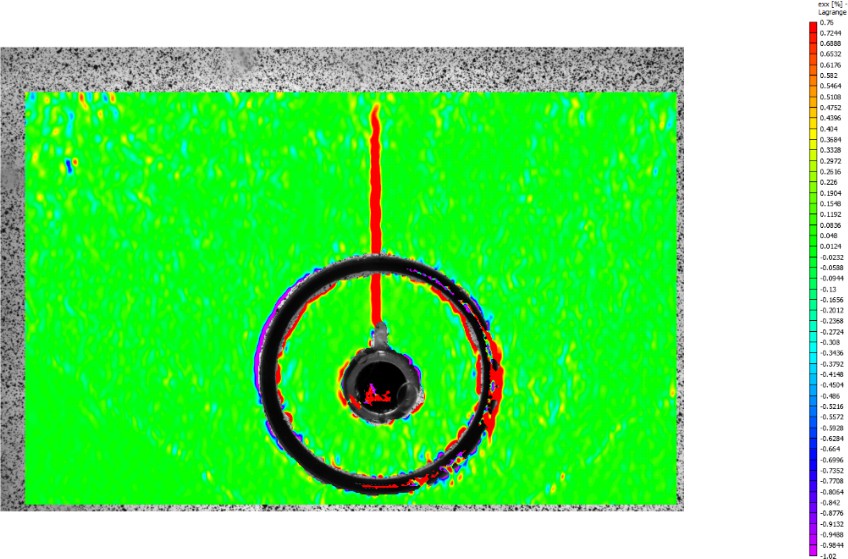
Figure 2. Horizontal Strain
Horizontal strain refers to the length change that occurs when an object is deformed in the horizontal direction. The strain plot around the borehole shows a very sharp red crack in the vertical direction. This shows a region of very high tensile strain, indicating a weak spot in the rock and the appearance of a crack. The vertical orientation of the cracks suggests that the principal stresses are acting in the horizontal direction, which is the same direction as our experimental design. The uniform green color of the background region is evidence that the error was almost non-existent, and the measurement was highly reliable.
Vertical Strain
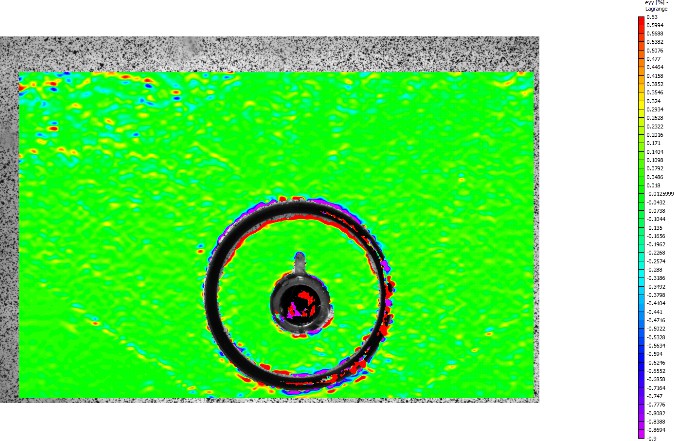
Figure 3. Vertical Strain
The symmetrical strain distribution centered on the borehole shows that the stress redistribution is uniform. The lack of pronounced vertical cracking observed in the vertical strain also suggests that the strain is directional, with the principal stresses being more dominant in the horizontal direction.
Magnitude of Displacements
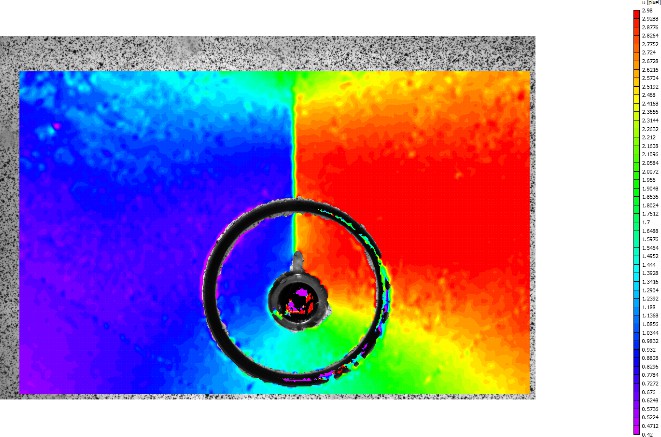
Figure 4. Displacements
Looking at the total displacement, the higher amount of displacement is colored red in the right region, indicating a large movement in the rightward direction. It can also be seem that the displacement is evenly distributed, indicating that the entire block moved together. The left region of the specimen shows the completely opposite behavior, indicating a leftward movement. The left-right bifurcation of movement around the center crack suggests that the rock moved in a left-right direction along the crack plane. The strain distribution was in the form of concentric circles centered on the center O-ring.
These DIC results effectively capture the complex strain and displacement fields generated during the hydraulic fracturing process and provide valuable data to precisely analyze the deformation mechanisms, especially during crack initiation and propagation. Each data set provides complementary information, enabling a comprehensive understanding of the hydraulic fracturing phenomenon.
Pressure vs. Time
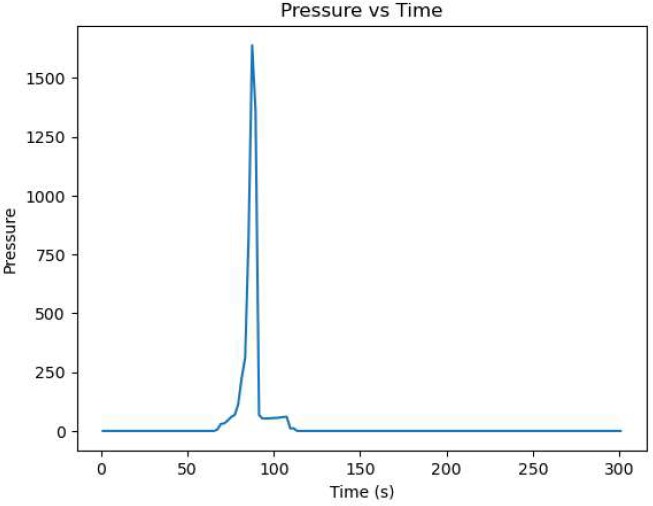
Figure 5. Pressure vs. Time
The graph shows pressure evolution over time. For the first 60 seconds, the pressure remains at 0 psi as the specimen is calibrated to this baseline pressure. Subsequently, a rapid pressure increase occurs, reaching a peak of approximately 1600 psi. After reaching this peak pressure, which triggers crack propagation, a sharp pressure drop occurs followed by stabilization at the initial pressure level.
This experiment shows a typical hydraulic fracturing pattern of an initial stabilization period, a rapid pressure/load increase, a rapid pressure drop at the point of crack initiation, and a subsequent stabilization phase. The pattern of change in pressure and load is similar, showing that the experiment and the setting were stable.
Conclusions
Validation of the experimental methodology with the simple experiment was successful. High- resolution images were obtained using the 47MP Sony IMX492 CMOS sensor and 100mm fixed-focus lens, which gave me the confidence to use this setup in the experimental design of the HF experiment with NF in the next semester. The successful experimental design, which closely followed the recommendations of the A Good Practices Guide for Digital Image Correlation (2018), led to the confidence that meaningful experimental results, such as identifying the location and direction of crack initiation through the horizontal strain rate and observing the reformation redistribution pattern through the vertical balance rule, can be observed with 2D DIC. Future results will inevitably pave the way for future improvements in the process in terms of precision, efficiency, and the minimization of environmental impact in resource extraction.
Bibliography
Agha, A., Badkul, A., Kulkarni, P., & Chavan, V. (2022). Effectiveness of 2D Digital Image Correlation in Capturing the Fracture Behavior of Sheet Metal Alloys. SAE International Journal of Materials and Manufacturing, 15(6), 437–445. https://doi.org/10.4271/10-15-06-0033
Roshankhah, S., Marshall, J., Tengattini, A., Rubino, V., & others. (2018). Neutron Imaging: A New Possibility for Laboratory Observation of Hydraulic Fractures in Shale? Géotechnique Letters, 8(4), 1–23. https://doi.org/10.1680/jgele.18.00129
Makhnenko, R. Y., Bunger, A., & Detournay, E. (2010). Deviation from Linear Elastic Fracture in Near-Surface Hydraulic Fracturing Experiments with Rock. In Proceedings of the 44th US Conference on Rock Mechanics/Geomechanics (ARMA 2010).
Detournay, E. (2016). Mechanics of Hydraulic Fractures. Annual Review of Fluid Mechanics, 48(1), 311–339. https://doi.org/10.1146/annurev-fluid-010814-014736
Gandossi, L., & Von Estorff, U. (2015). An overview of hydraulic fracturing and other formation stimulation technologies for shale gas production – Update 2015. EUR 26347. Luxembourg: Publications Office of the European Union. https://doi.org/10.2790/379646
Q., Latham, J. P., & Tsang, C. F. (2017). The use of discrete fracture networks for modelling coupled geomechanical and hydrological behaviour of fractured rocks. Computers and Geotechnics, 85, 151-176. https://doi.org/10.1016/j.compgeo.2016.12.024
Higo, Y., Oka, F., Kimoto, S., Sanagawa, T., & Matsushima, Y. (2011). Study of strain localization and microstructural changes in partially saturated sand during triaxial tests using microfocus X-ray CT. Soils and Foundations, 51(1), 95–111. https://doi.org/10.3208/sandf.51.95
International Digital Image Correlation Society, Jones, E.M.C. and Iadicola, M.A. (Eds.) (2018). A Good Practices Guide for Digital Image Correlation. https://doi.org/10.32720/idics/gpg.ed1
Guo, J., Luo, B., Lu, C., Lai, J., & Ren, J. (2017). Numerical investigation of hydraulic fracture propagation in a layered reservoir using the cohesive zone method. Engineering Fracture Mechanics, 186, 195–207. https://doi.org/10.1016/j.engfracmech.2017.10.013
Weng, X., Kresse, O., Cohen, C., Wu, R., & Gu, H. (2011). Modeling of Hydraulic-Fracture-Network Propagation in a Naturally Fractured Formation. SPE Production & Operations, 26(3), 368–380. https://doi.org/10.2118/140253-PA
