College of Social and Behavioral Science
136 Reconstruction of Tropical Dry Forest Disturbances Over the Last Seven Centuries
Ângelo Bueno Perillo III and Susana Velásquez-Franco
Faculty Mentor: Susana Velásquez-Franco (Environment, Society & Sustainability, Natural History Museum of Utah, University of Utah)
It is widely recognized that fire is an integral process of ecosystems, but the study of historical wildfires in the tropics has received limited attention compared to other regions. This work was focused on fire frequency reconstruction and identifying charcoal morphotypes for a tropical dry forest. The El Tabor Maar (ETM) is a type of volcano that holds a crater lake or maar-lake surrounded by a tropical dry forest, located in Tolima Department, Colombian Andes (Martínez Espinosa, 2025). Fire frequency reconstruction and morphometrics on charred botanical particles from this area allowed us to better understand how frequent and severe past drought cycles have been. Charcoal morphotypes and morphometrics (i.e., length/width) can also help to differentiate if there have been any significant changes in forest structure and land cover types of the surrounding plant communities in response to droughts or other climatic driven disturbances.
To help determine fire frequency, charcoal particles were counted for each sample using a stereomicroscope. About half (52.2%) of the ETM samples yielded ≤1 charcoal particles but there are at least two periods with significantly higher counts: one between 71.5-74.5 cm that peaked at 7 between 73.0-73.5 cm and a much larger and prolonged one between 78.5-86.5cm that peaked three times at 80.5-81.0 cm with 12, 83.0-83.5 cm with 64, and 85.5-86.0 cm with 12 (Figure 1).
The identification of morphotypes in the sediment core samples was based on previous work by Gray, et al. (2023) and Mustaphi & Pisaric (2014). Among the charcoal particles analyzed, morphotypes consistent with wood, monocot leaves, dicot leaves, and seeds were identified (figure 2).
To obtain the images in the plate (Figure 2), tangential macrophotography was used (Gray, et al., 2023). In addition to the charcoal fragments, other botanical macroremains were collected, including a seed, possibly a petiole, and a possible fern leaf with sori (Figure 2). Other unidentified remains may be of animal origin.
In addition to charcoal, the reflectance and elements concentrations were estimated using a Multisensor Core Logger (MSCL) with in-line magnetometer, spectrophotometer and pXRF at 1mm steps (figure 1). We used light ratios R660/670t as proxy for bioproductivity. Elementary ratios such as Si/Al and K/Al to measure weathering and erosion as they indicate how much sediment was being deposited in the maar-lake via rainfall and runoff. Authigenic Calcium Carbonate (Ca/∑TiAlFe) was used as an indicator of drought, and Phosphorus (P) was measured as it indicates periods of eutrophication that inhibited bioproductivity.
ETM24C2D1 Results and Interpretation
The history of the tropical dry forest during the last ~700 yrs is synthetized below into 11 major events throughout the record. These events are highlighted in figure 1 from the bottom to the top of the record. Each event is described by the values of the independent lines of evidence as follows: 1. ratio 660/670 (as indicator of biological productivity); 2. Phosphorous (ppm) (detrital input and inverse indicator of bioproductivity); 3. Si/Al and K/Al (detrital input/weathering/runoff/rainfall) and 4. Ca/∑TiAlFe (as proxy for droughts).
Event a.) (~32.5 cm, ca. 1383 CE). During this event R660/670presents values around 0.99 (min= 0.99728, max= 1.00095, x̄= 0.99941), indicating a peak of bioproductivity. Phosphorus concentrations on a downward trend at just above 200 ppm (min= 204.8, max= 218.37, x̄= 210.46), indicating a period of low disturbance in the areas around the maar. Si/Al and K/Al levels both dip to nearly 2 ppm for Si/Al (min=2.056753, max= 2.118529, x̄= 2.0855) and about 0.06 ppm for K/Al (min=0.053151, max=0.057442, x̄=0.055202), respectively indicating a decrease in rainfall/runoff with a tendency to increment. Ca/∑TiAlFe also dips (min=0.024775, max=0.026556, x̄= 0.025821) indicating drought was not occurring at the time. Charcoal values for this event are at 0, indicating a lack of wildfire activity. In general, this event indicates that bioproductivity was high and stable supported by an environment with a tendency to be oligotrophic during a period of rainfall/runoff decrease.
Event b.) (~28.1 cm, ca. 1472 CE). For this event, R660/670 presents around 0.99 (min=0.99367, max=0.99823, x̄=0.99628), indicating a peak of bioproductivity. Phosphorus concentrations in a fluctuating but generally downward trend at just above 160 ppm (min=160.78, max=162.23, x̄=161.2833), indicating a steady and low detrital contribution. Si/Al and K/Al both on an upward trend with Si/Al at around 2.3 ppm (min=2.243534, max=2.325243, x̄=2.284117) and K/Al at around 0.05 ppm (min=0.050638, max=0.053753, x̄=0.052492) indicating a small increase in rainfall/runoff. Ca/∑TiAlFe concentrations also fall (min=0.0276595, max=0.030946, x̄=0.029454) indicating there was no drought occurring at the time. Charcoal values in this period are at 0, indicating no wildfires occurred. In general, the numbers indicate high bioproductivity in an oligotrophic environment in which rainfall/runoff was increasing.
Event c.) (~22.0 cm, ca. 1590 CE) During this event, values for R660/670 hovered at around 1 (min=1, max=1.00496, x̄=1.00201), pointing to another peak in bioproductivity. Phosphorus remained fluctuous but relatively stable at around 128.5 ppm (min=121.42, max=132.44, x̄=128.5267), indicating little detrital contribution. Si/Al values experience a low of about 2.2 ppm (min=2.204391, max=2.267843, x̄=2.227462) and K/Al values are at about 0.09 ppm (min=0.087198, max=0.094612, x̄=0.090496) and gradually rising, indicating a general decrease in rainfall/runoff. Ca/∑TiAlFe fell to a low of around 0.02 ppm (min=0.024154, max=0.025687, x̄=0.024791) indicating no drought was occurring at the time. Charcoal counts for this event came in at 0. In general, the values indicate high bioproductivity, low rainfall/runoff, and no drought or wildfires.
Event d.) (~20.1-18.2 cm, ca. 1630-1665 CE) During this event R660/670 remained mostly steady around 0.99. Phosphorus first peaks around 323 ppm before falling to around 218 ppm and rising again (min=218.48, max=323.36, x̄=269.8725), indicating significant wildfire events. Si/Al peaks and falls between around 2.7 ppm and 2.3 ppm (min=2.309481, max=2.672114, x̄=2.455268) while K/Al begins at a downward trend, going as low as 0.07 ppm (min=0.072103, max=0.106785, x̄=0.087971). These values indicate a major decrease in rainfall/runoff during this period. Ca/∑TiAlFe also peaks at around 0.08 ppm before falling to about 0.045 ppm (min=0.045377, max=0.07759, x̄=0.056929), indicating a major drought that becomes significantly less severe. Charcoal counts (min=4, max=12, x̄=7.25) climb during and then peak just after this event at 64. In general, these values indicate falls in rainfall/runoff amidst a drought of first high and then lower severity with minor changes in bioproductivity. Charcoal counts indicate a major wildfire event(s) in and around this period of time.
Event e.) (~15.5-13.9, ca. 1719-1750 CE). In this event, values for R660/670 averaged about 0.99 (min=0.98428, max=0.99647, x̄=0.99119) but varied considerably. Phosphorus values peaked around 508 ppm before falling sharply to about 184 ppm (min=183.77, max=508.16, x̄=335.8124), indicating the occurrence of wildfires. Si/Al values peak around 2.8 ppm (min=2.546333, max=2.840042, x̄=2.68944) around the middle of this period while K/Al values follow a general downward trend (min=0.095263, max=0.117319, x̄=0.10797), indicating a rise and then fall in rainfall/runoff. Value for Ca/∑TiAlFe peaks around 0.09 ppm (min=0.065713, max=0.093883, x̄=0.078675) before falling sharply. Charcoal counts are higher in this period, peaking at 12 (min=4, max=12, x̄=7.75), indicating some wildfires in this period. In general, these values indicate at first the occurrence of extreme drought and wildfires before those conditions ameliorate because of increased rainfall. A rise and then fall is seen in bioproductivity as a result.
Event f.) (~12.0 cm, ca. 1790 CE). For this event, values for R660/670 fall to around 0.986 (min=0.98601, max=0.98624, x̄=0.98612). Phosphorus peaks at around 309 ppm (min=299.43, max=309.06, x̄=303.3267), indicating some detrital contribution. Si/Al values on a downward trend (min=2.261536, max=2.318524, x̄=2.290429) while K/Al experiences a low peak around 0.09 ppm (min=0.085266, max=0.090264, x̄=0.086986), indicating low rainfall/runoff. Ca/∑TiAlFe value low around 0.035 ppm (min=0.034985, max=0.035752, x̄=0.035453), indicating no drought. Charcoal counts come in at 0, suggesting wildfires did not contribute to Phosphorus values. In general, these values indicate low bioproductivity and rainfall/runoff amidst no drought conditions or wildfires.
Event g.) (~10.8 cm, ca. 1815 CE). In this event, values for R660/670 spiked greatly to around 1.009 (min=1.004862, max=1.00913, x̄=1.00665). Phosphorus began a gradual downward trend (min=244.43, max=274.01, x̄=257.28), indicating a reduction in detritus. Si/Al and K/Al both fall to around 2.19 ppm (min=2.196224, max=2.223398, x̄=2.205645) and 0.072 ppm (min=0.071629, max=0.077141, x̄=0.074172) respectively, indicating a significant reduction in rainfall/runoff. Ca/∑TiAlFe remains low around 0.029 ppm (min=0.026627, max=0.031853, 0.029065). Charcoal counts come in at 0, indicating wildfires did not occur. In general, these values indicate high bioproductivity, low rainfall/runoff, no wildfires, and no drought.
Event h.) (~9.1-8.2 cm, ca. 1848-1867 CE). For this event, R660/670 values started high before falling to around 0.9845 and rising back to around 0.999 (min=0.984556, max=0.998852, x̄=0.98959). Phosphorus values were initially stable before gradually trending down (min=158.99, max=258.51, x̄=217.502), indicating lower detrital contribution. Si/Al and K/Al values ranged from around 2.65-2.28 ppm (min=2.284591, max=2.655202, x̄=2.434083) and 0.156-0.106 ppm (min=0.106381, max=0.156276, x̄=0.126414) respectively, indicating a major decline in rainfall/runoff. Values for Ca/∑TiAlFe also fell from around 0.06-0.03 ppm (min=0.0311, max=0.060681, x̄=0.043018), indicating a reversal of drought conditions. Charcoal values for this event peak at 5, indicating small or less severe wildfires. In general, these values indicate an eventual increase in bioproductivity with falls in rainfall/runoff and lessened drought conditions.
Event i.) (~7.0 cm, ca. 1890 CE). Values for R660/670 fall to around 0.98 (min=0.982732, max=1, x̄=0.99368). Phosphorus values remain relatively steady, averaging around 120 ppm (min=104.64, max=132.47, x̄=119.9433), indicating lower but consistent contributions of detritus to the maar. Value for Si/Al and K/Al both peak around 2.7 ppm (min=2.626107, max=2.733374, x̄=2.689598) and 0.196 ppm (min=0.184061, max=0.195704, x̄=0.191056) respectively, indicating very high rainfall/runoff. Value for Ca/∑TiAlFe forms a low peak at around 0.05 ppm (min=0.048573, max=0.050237, x̄=0.049348) indicating a very mild drought. Charcoal counts for this event came in at 4, indicating some wildfire or possibly the clearing of cropland with fire. In general, these values indicate low bioproductivity due to very high rainfall/runoff.
Event j.) (~4.0 cm, ca. 1948 CE). For this event, values for R660/670 dropped to their lowest point at around 0.977 (min=0.976608, max=0.993174, x̄=0.98556). Phosphorus values were near the peak of an upward trend, averaging around 86.5 ppm (min=78.27, max=96.12, x̄=86.56667), indicating very low detrital contributions which point to a lack of major disturbances in the surrounding areas. Si/Al and K/Al values were relatively stable, averaging around 2.48 ppm (min=2.477254, max=2.485637, x̄=2.480143) and 0.11 ppm (min=0.110728, max=0.112821, x̄=0.111435) respectively, indicating a period of high but stable rainfall/runoff. Values for Ca/∑TiAlFe were near their lowest, averaging around 0.027 ppm (min=0.026225, max=0.027509, x̄=0.026969). Charcoal counts for this event are at 1, indicating minimal wildfires or land clearing with fire. These values indicate a period of higher rainfall/runoff, very low bioproductivity, and no drought.
Event k.) (~1.3 cm, ca. 2002 CE). In this event, values for R660/670 were at some of their highest around 1.025 (min=1.006652, max=1.024658, x̄=1.01697). Values for phosphorus were at 0 (min=0, max=0, x̄=0). Values for Si/Al had begun to go down, averaging 2.57 ppm (min=2.458097, max=2.647693, x̄=2.568935) while those for K/Al remained high, averaging 0.126 ppm (min=0.105518, max=0.148348, x̄=0.126196), indicating rainfall/runoff remained relatively high. Values for Ca/∑TiAlFe also remained low, averaging 0.033 ppm (min=0.031363, max=0.034847, x̄=0.032699). Charcoal values for this event came in at 0, indicating no wildfire activity. These values indicate very high bioproductivity and rainfall/runoff.
Conclusion
The use of charcoal counts and Multisensor Core Logger (MSCL) results to help determine fire frequency as well as other disturbances has shown itself to be a reliable method to do so. The comparisons between the different light and elementary ratios with the charcoal counts correlate with each other and the relationships each of the variables has with each other can easily be observed in the results.
In general, during the period examined (1350-2024 CE), a period of stability was observed until about 1600 CE when a period of large disturbances began before somewhat stabilizing again around 1900 CE. This coincides with the arrival of Europeans in the area and the founding of the town of Ibagué in 1550 (Martínez Espinosa, 2025). The frequency and intensity of these disturbances have been seen to be closely related to conditions that may have been present at the time, such as drought and rainfall/runoff levels and were probably influenced by the effects of different land use practices introduced by settlers.
In the future, more work comparing charcoal counts with light and elementary ratios should be done on other, deeper cores of El Tabor in order to build an even more complete history of disturbances, especially wildfires. Similar work should be done in other maars in the region to help build a larger regional timeline of disturbances.
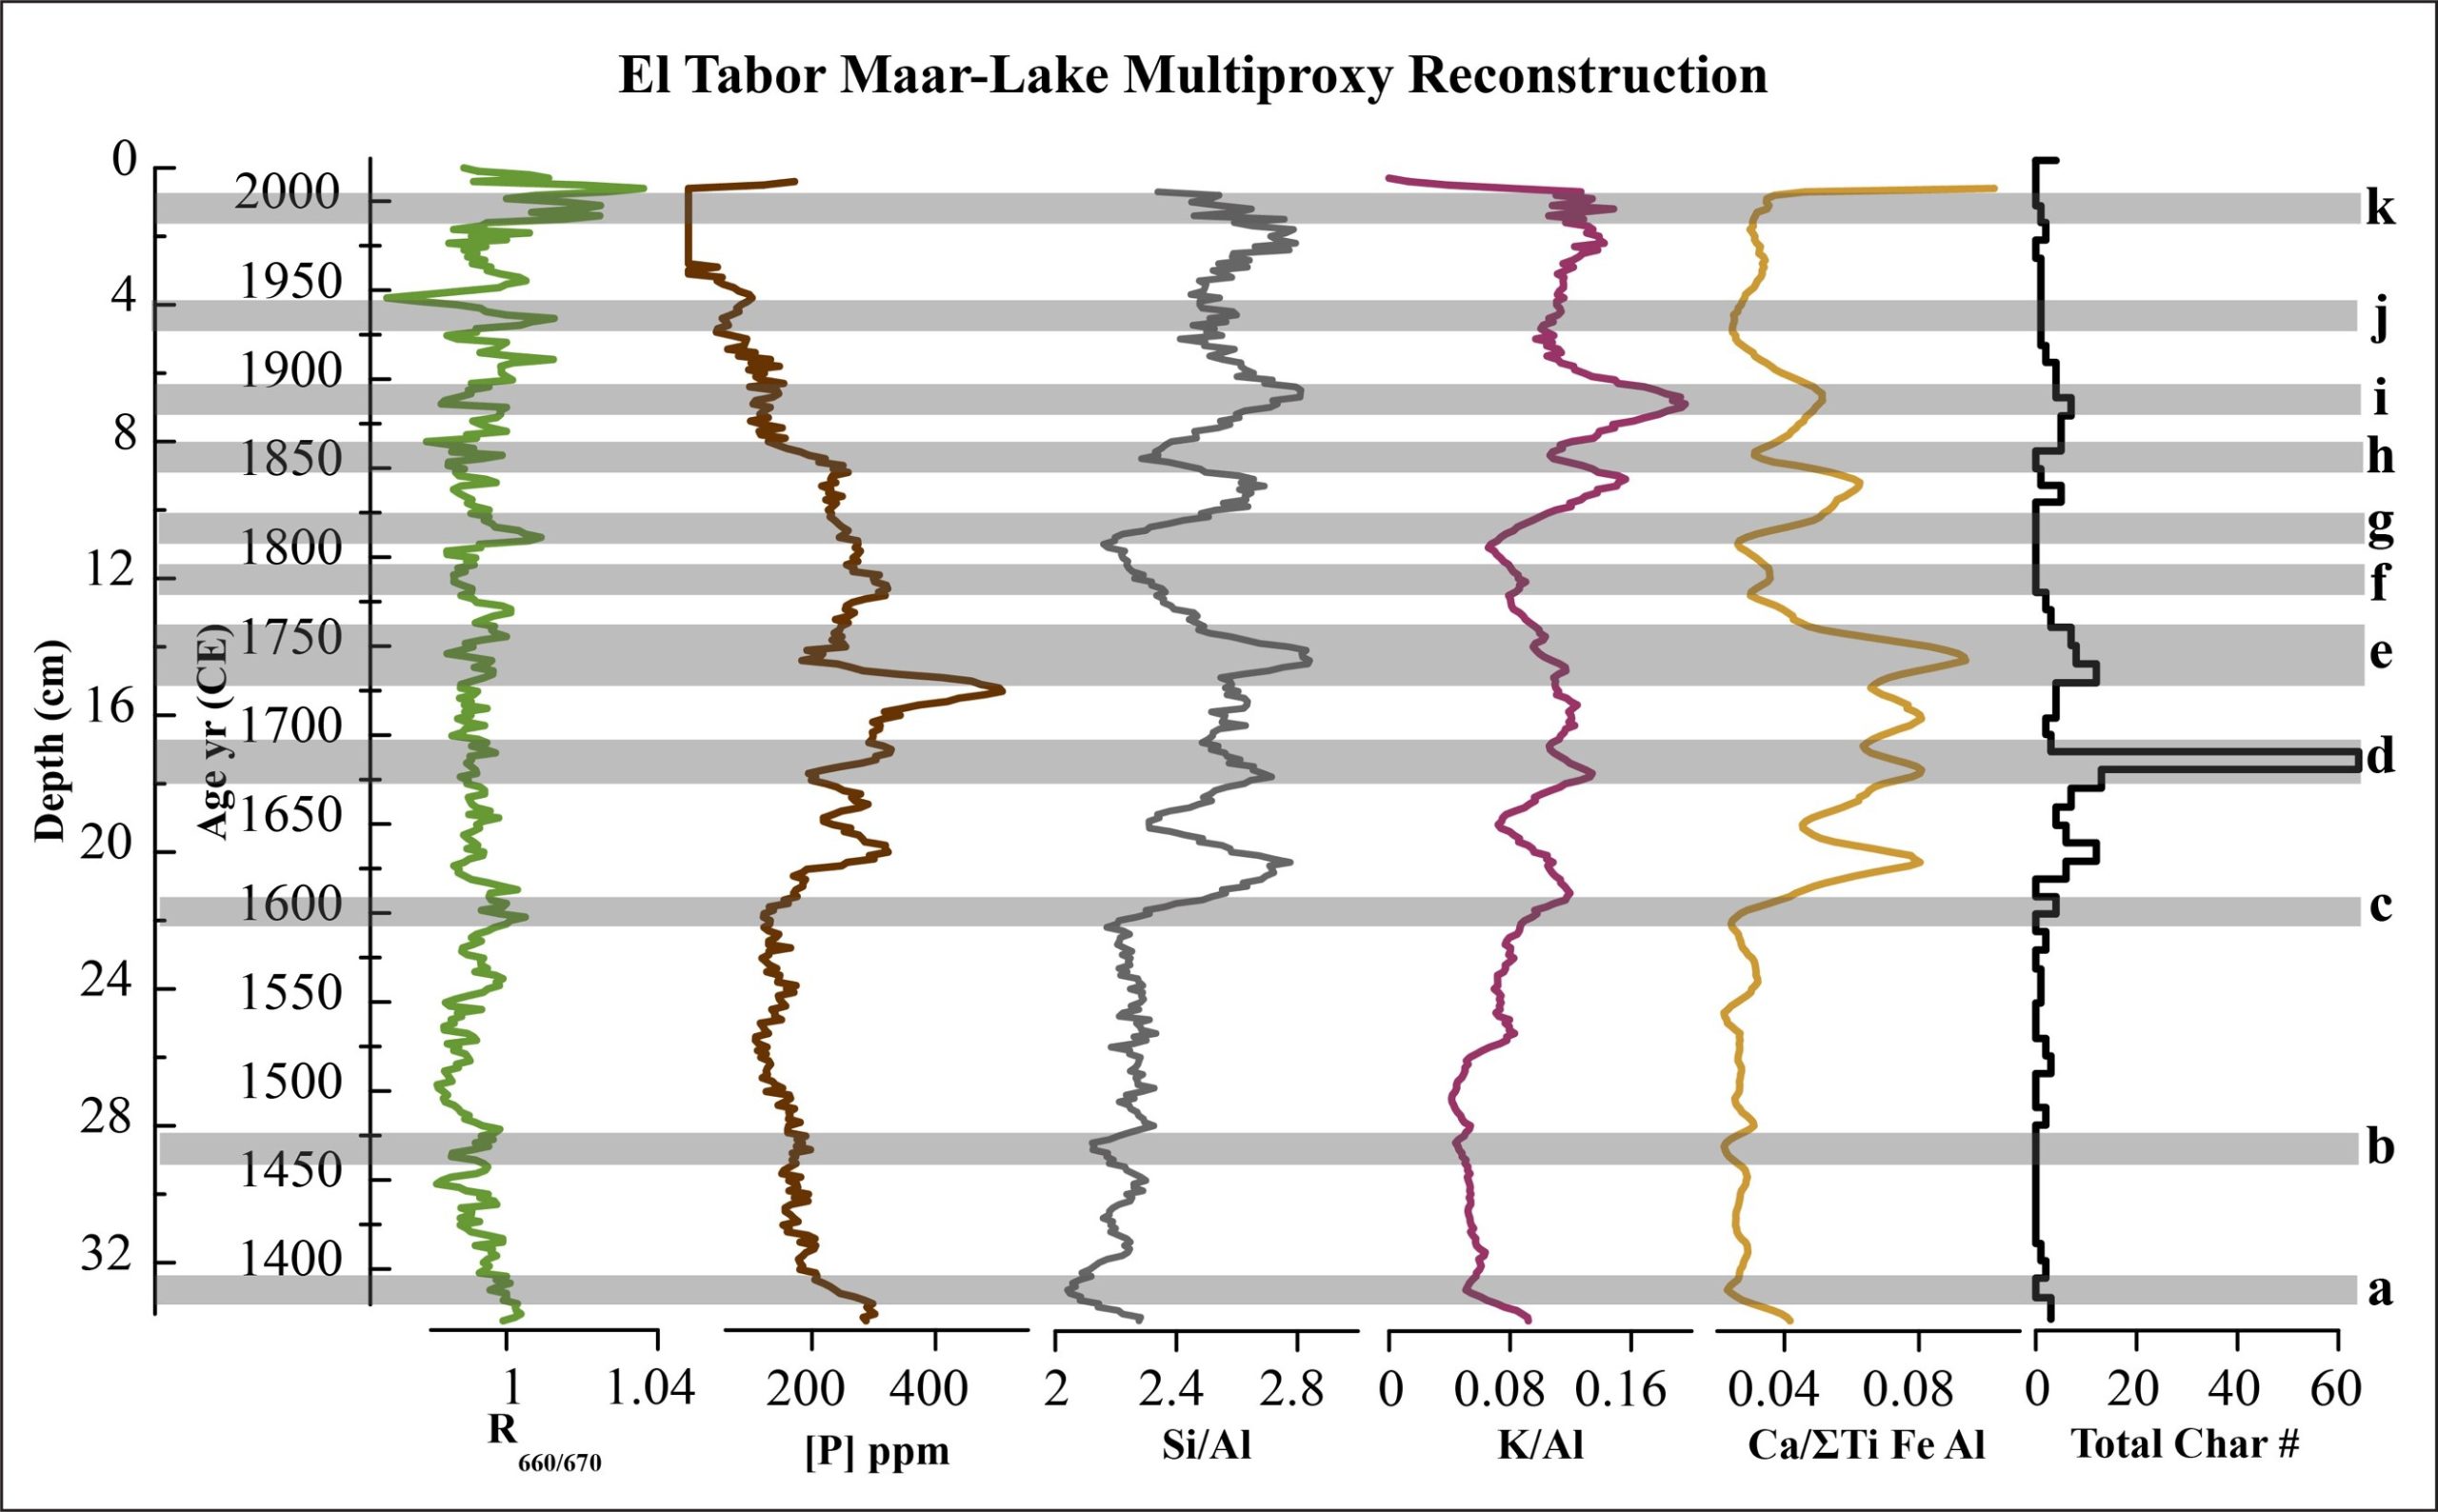
Figure 1. Light and elementary ratios and charcoal counts for El Tabor Maar for 1350-2025 CE. Ratios obtained via Multisensor Core Logger (MCL).
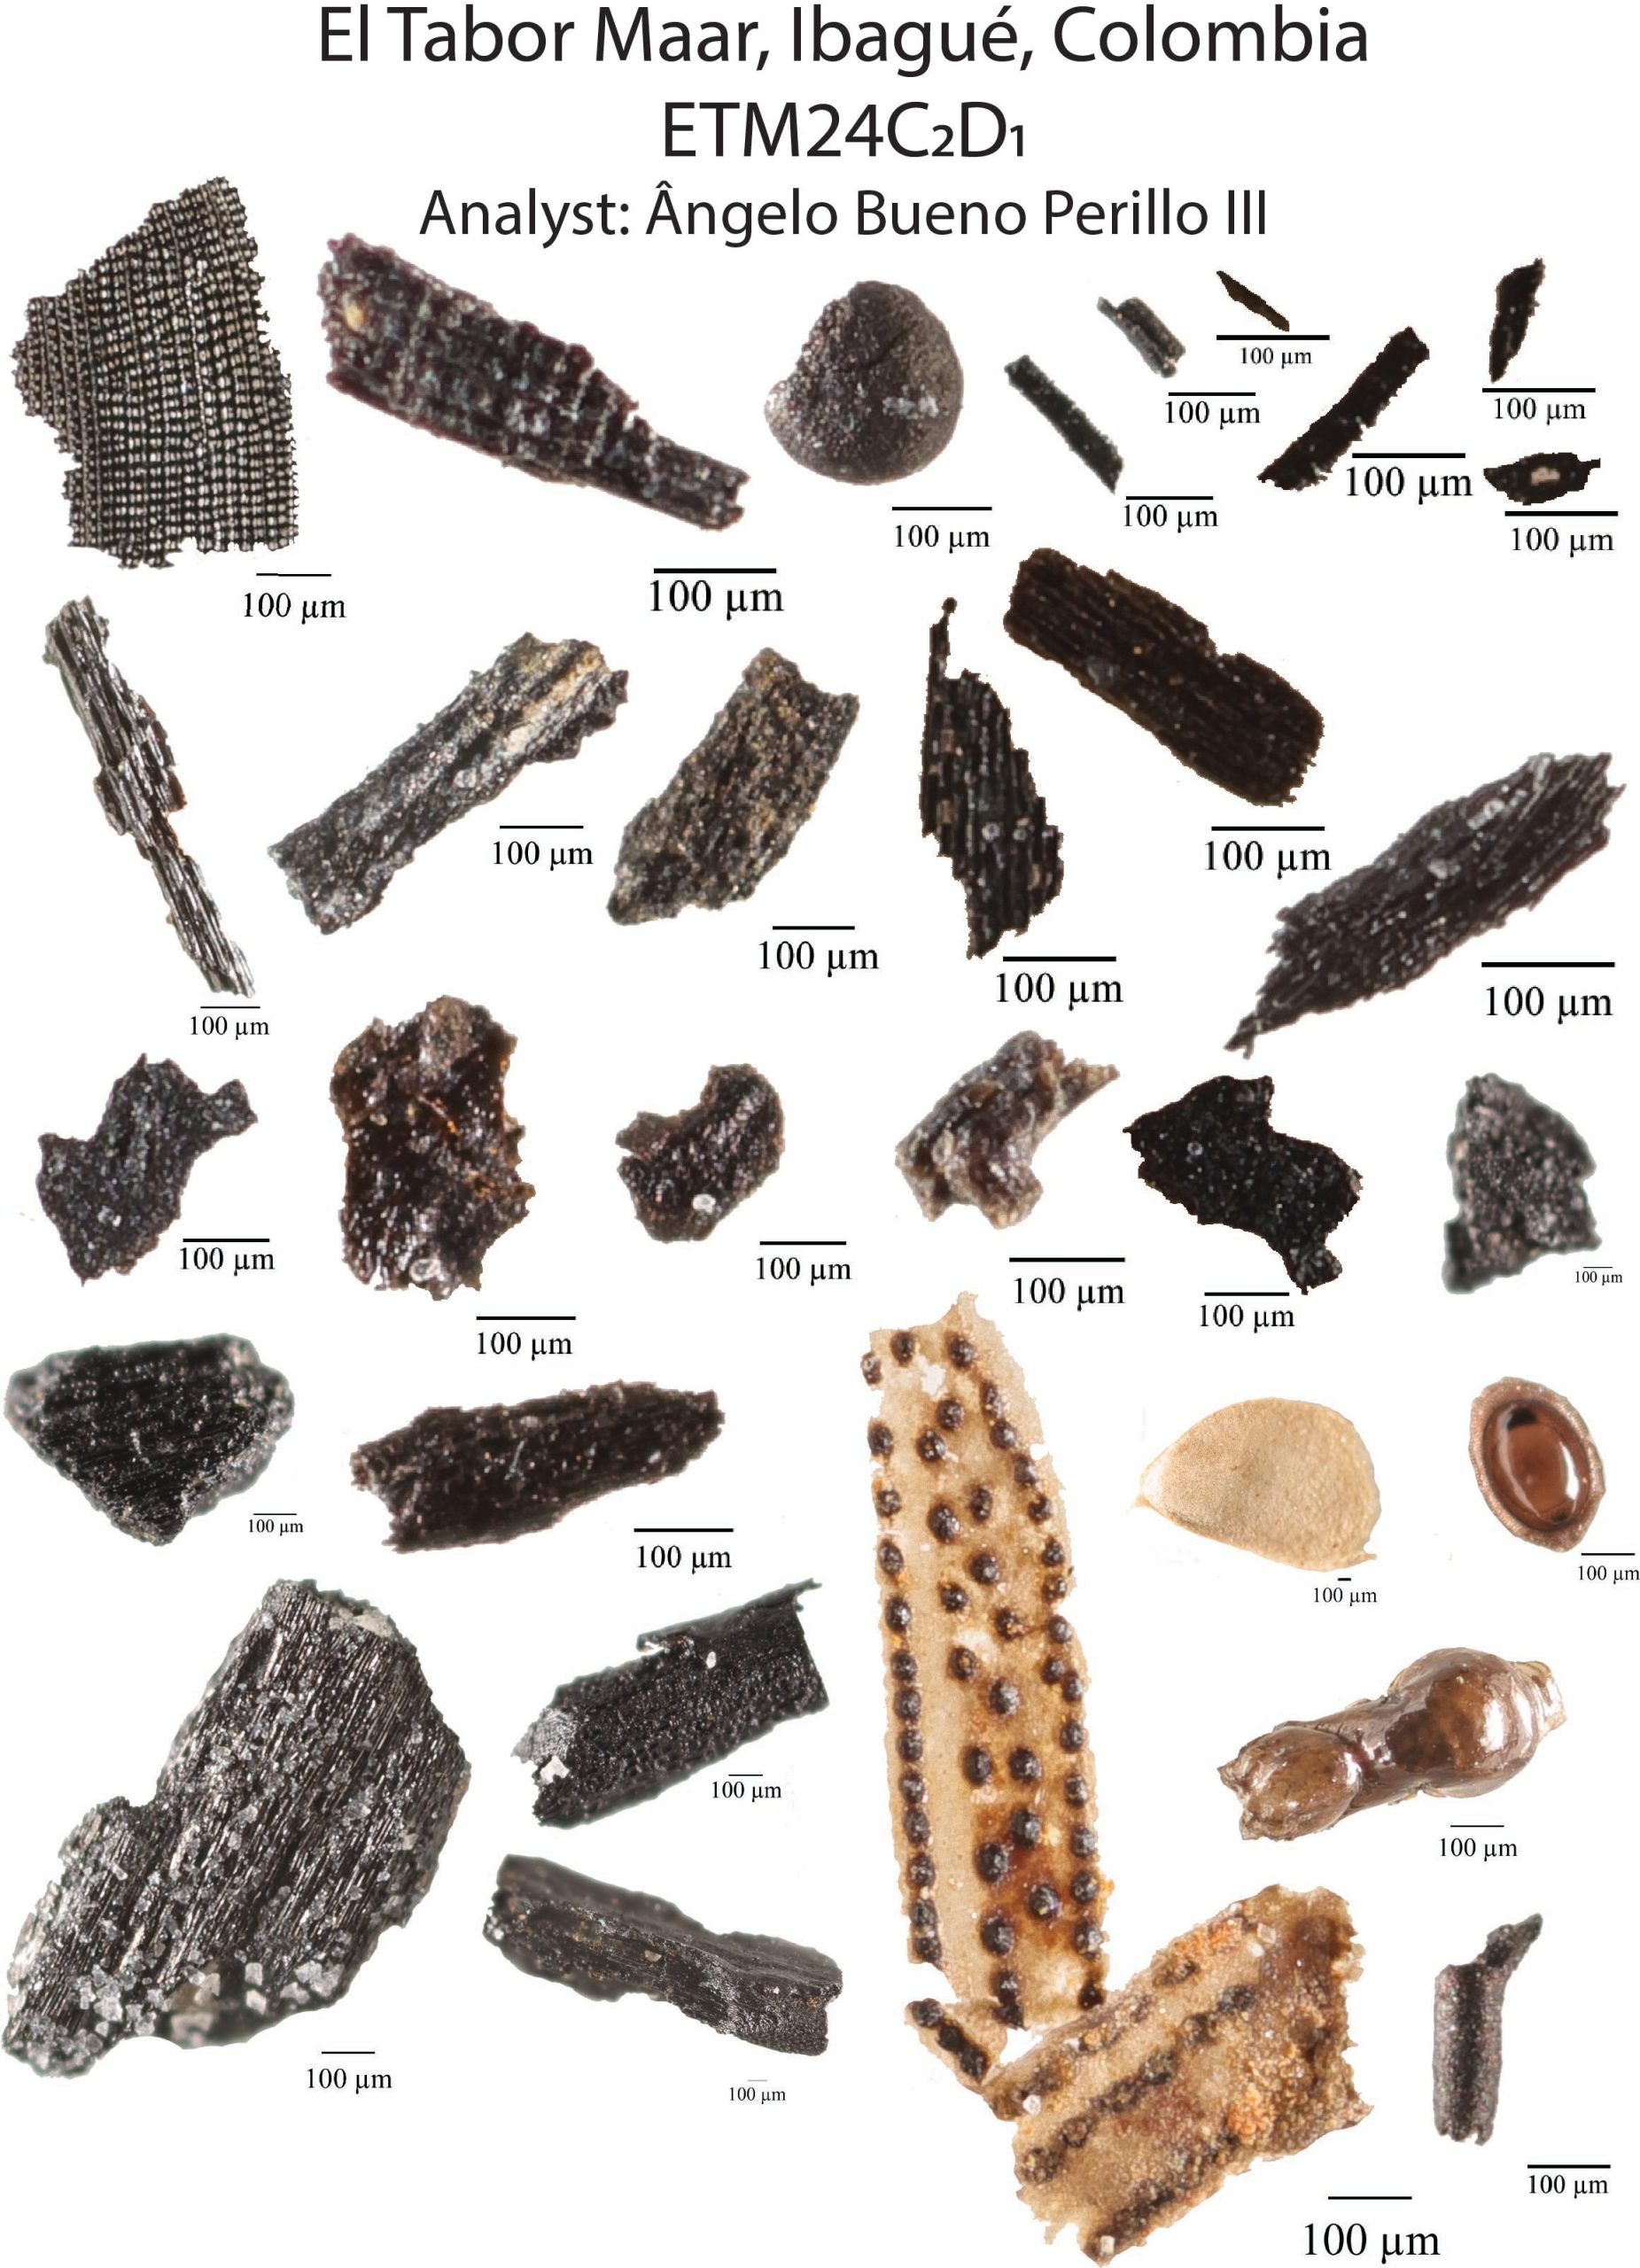
Figure 2. Images of charred botanical fragments and other biological macroremains obtained via tangential macrophotography. Charcoal morphotypes determined following Mustaphi & Pisaric (2014) and Snitker (2020):
Bibliography
Gray, W., Velásquez-Franco, S., Mosher, S., & Power, M. (2023, August 7). Visualizing Surface Morphology of Sedimentary Charred Botanical Particles Using Tangential Flash Macrophotography Creators. https://zenodo.org/records/8221934
Martínez Espinosa, L. F. (2025). Explorando disturbios ecológicos a través del registro sedimentario del maar El Tabor (Andes Colombianos). Universidad de Caldas Faculdad de Ciencias Exactas y Naturales.
Mustaphi, C. J. C., & Pisaric, M. F.J. (2014). A classification for macroscopic charcoal morphologies found in Holocene lacustrine sediments. Progress in Physical Geography Earth and Environment, 1-21. https://www.researchgate.net/publication/265014310_A_classification_for_macroscopic_charc oal_morphologies_found_in_Holocene_lacustrine_sediments.
Snitker, G. (2020). The Charcoal Quantification Tool (CharTool): A Suite of Open-source Tools for Quantifying Charcoal Fragments and Sediment Properties in Archaeological and Paleoecological Analysis. Ethnobiology Letters, 11(1), 103-115. https://doi.org/10.14237/ebl.11.1.2020.1653
