John and Marcia Price College of Engineering
12 Optimization of Smart Hydrogel Structures for Improved Glucose Response
Bryson Anderson and Lars Laurentius
Faculty Mentor: Lars Laurentius (Electrical and Computer Engineering, University of Utah)
Abstract
Diabetes, a global health epidemic, requires efficient and accessible methods for glucose monitoring to treat and maintain the disease. Traditional monitoring methods, such as fingerstick tests and continuous glucose monitoring (CGM) systems, have limitations in terms of cost, invasiveness, and biocompatibility, particularly in low-income settings. This study investigates the optimization of a glucose-sensitive smart hydrogel strand, which provides a promising alternative as a biosensor for glucose and could be used as a continuous and inexpensive glucose monitor. These hydrogel strands respond to glucose concentration changes by shrinking or swelling, making them ideal for a glucose biosensor. However, the hydrogel strands still have a slow glucose response. To optimize the hydrogel strand, structural features such as hydrogel strand diameter and porosity were explored to determine if they enhance the hydrogel strands glucose responsiveness. Adjusting the strand diameter and increasing porosity improved the hydrogel’s glucose response time, though further refinements are needed for practical implementation. Ultimately, glucose-sensitive hydrogels could provide a cost-effective, biocompatible, and non-invasive solution for diabetes management, particularly in low-income settings.
Index Terms—Porous Hydrogels, Biomedical Sensors, Microfluidic Channel, T90 Response Time, Hydrogel Swelling Kinetics
Introduction
Diabetes is a growing global health concern, affecting over 422 million people worldwide, as reported by the World Health Organization [1]. The condition is characterized by chronic hyperglycemia due to defects in insulin production or function, leading to long-term complications such as cardiovascular diseases, neuropathy, and retinopathy. The burden of diabetes is particularly severe in low- and middle- income countries, where healthcare systems are often under- equipped to manage the disease [2]. Effective disease management is essential to reducing complications and improving the quality of life for diabetic patients.
Glucose monitoring plays a crucial role in diabetes management by helping regulate blood sugar levels and minimizing complications. Consistent monitoring helps prevent both hypoglycemia (low blood sugar) and hyperglycemia (high blood sugar), which can cause serious health issues, including fainting, seizures, or even coma. Over the long term, proper glucose management through continuous monitoring significantly reduces the risk of chronic complications such as cardiovascular disease, kidney damage, nerve damage, and vision loss. However, current glucose monitoring methods, such as fingerstick blood tests and continuous glucose monitoring (CGM) systems, have notable drawbacks. Fingerstick tests are inconvenient and provide only point-in-time data, while CGM systems are typically expensive and require frequent sensor replacements. These challenges make widespread adoption difficult, particularly in low-income settings, highlighting the need for more accessible and affordable monitoring technologies [3,4].
The need for more accessible and minimally invasive glucose monitoring tools has led to increasing interest in smart hydrogels as potential biosensors for glucose. Smart hydrogels are hydrophilic polymer networks that can respond to specific solutes, such as glucose, by shrinking or swelling, offering real- time feedback on glucose concentrations [5]. These hydrogels present a unique opportunity to combine biocompatibility with high specificity for glucose, thereby providing an alternative to traditional monitoring techniques. While the idea of glucose- sensitive hydrogels has shown promise, key challenges remain in optimizing their structure for injectability, response time, and sensitivity to glucose concentrations [6].
The central question guiding this project is how to optimize the structure of smart hydrogels to improve their glucose response time and sensitivity. While previous research has demonstrated the potential of hydrogels for glucose monitoring, significant knowledge gaps remain in understanding how specific structural features, such as porosity, strand thickness, and crosslinking density, influence their performance [7,8]. These structural characteristics directly impact the hydrogel’s ability to respond to glucose fluctuations and maintain stability over time. For instance, porosity can affect the diffusion rate of glucose molecules through the hydrogel, while strand thickness and porous density have roles in mechanical strength [9]. Further investigation into these parameters is needed to optimize our hydrogel, enabling more precise, stable, and scalable glucose monitoring solutions.
To address these challenges, we focused on optimizing the structural design of our glucose-sensitive hydrogel by incorporating porous structures into the hydrogel. This approach involves testing various hydrogel strand configurations with and without pores, then assessing their glucose response using an optical imaging setup. Defining and optimizing these techniques is essential for ensuring consistent hydrogel performance in dynamic biological environments [10, 11]. By refining the hydrogels design and structure, our aim is to enhance their glucose monitoring capabilities, ultimately contributing to the development of a minimally invasive, cost- effective sensor for diabetes management.
Background
The current landscape of glucose monitors for diabetes management includes both point-in-time measurements of blood glucose and continuous glucose monitoring. Point-in- time measurements allows for daily tracking of blood glucose levels, aiding in therapy adjustments, but may overlook life- threatening hypoglycemic events or nocturnal hypoglycemia. In contrast, continuous glucose monitoring provides continuous data, making it particularly useful for adjusting insulin therapy in adults with Type 1 diabetes as well as monitoring lifestyle changes in adults with Type 2 diabetes. However, many continuous monitors are costly and involve invasive probes, which may trigger immune responses [3, 4]. Studies show that continuous monitoring significantly reduces HbA1c levels in adults with Type 2 diabetes compared to self-monitoring via point-in-time measurements. HbA1c is a clinical marker used to measure long-term glucose control, reflecting average blood sugar levels over the past two to three months [12].
Smart hydrogels offer a compelling alternative, given their biocompatibility and responsiveness to glucose. Smart hydrogels are hydrophilic polymers capable of responding to external stimuli like temperature, pH changes, or specific ions. Their responsiveness stems from tunable crosslinking structures, which enable them to absorb and release water based on environmental affects [6]. Hydrogels can be chemically crosslinked through covalent bonds or physically crosslinked via hydrogen bonding, ionic interactions, or hydrophobic forces [5]. Chemically crosslinked hydrogels generally provide higher stability and durability, making them suitable for long-term applications, while physically crosslinked hydrogels often offer greater flexibility and faster response times [13]. The choice of polymer, such as polyacrylamide, polyvinyl alcohol, or naturally derived materials like alginate and chitosan, influences properties like biocompatibility, swelling behavior, and degradation rate [14]. In glucose-sensitive hydrogels, functionalization with phenylboronic acid enhances specificity, allowing for precise detection of glucose concentrations [20]. However, challenges such as leaching of functional groups, mechanical degradation over time, and potential cytotoxicity still must be addressed to optimize their suitability for clinical applications [15]. With the ability to retain large amounts of water (>90%), smart hydrogels are inherently biocompatible and have already been applied in fields such as tissue engineering and artificial organs [5, 16]. They can also be designed to undergo controlled swelling and shrinkage in response to specific solutes such as glucose [7]. By including functional groups specific to the analyte these hydrogels can be tailored for high selectivity toward a wide range of solutes [17, 18, 19]. This swelling behavior offers a unique, non-invasive way to monitor glucose levels, as the swelling can be directly correlated to glucose concentration, providing both real-time and continuous monitoring. Their shrinkage and swelling behavior occur due to their capacity to retain large amounts of water. When glucose is introduced into the hydrogel matrix, it can alter the chemical potential and/or form new crosslinks, affecting the hydrogel’s swelling state by shifting water between its interior and exterior [20]. Various methods are available to measure hydrogel swelling changes, but optical imaging is favored as it provides a direct view of the hydrogel’s state. Imaging hydrogels is crucial in their scientific research, biomedical applications, and hydrogel analysis, offering insights into their structure, behavior, and interactions [13, 11, 21]. Optical imaging has numerous advantages for in vitro benchtop characterization such as ease of integration with microfluidics for automation, simplified handling, and streamlined analysis [22]. In this study, a hydrogel strand is fixed inside a microfluidic channel, and as it swells, the strand bends due to its confinement at both ends. This approach allows for direct observation of strands (the preferred structure for injection). Further imaging modalities such as ultrasound readout are currently being explored as a potential method for measuring the swelling state of smart hydrogels in in vivo. Ultrasound has the advantage of being non-invasive and portable, making it suitable for point-of-care applications. Its ability to penetrate deeper into tissues allows for monitoring hydrogels in the interstitial fluid, providing an affordable and accessible solution for continuous glucose monitoring in low-income areas [23].
Ultrasound offers several additional advantages over optical imaging, particularly in the context of in vivo applications. Unlike optical techniques, which are limited by tissue opacity, ultrasound waves can penetrate deeper into biological tissues, making it possible to monitor hydrogel behavior in the interstitial spaces where the glucose-sensitive hydrogels would be placed [24]. This ability to visualize hydrogel swelling and shrinkage within living tissues, is critical for assessing their function in a physiological environment. Moreover, ultrasound’s non-invasive nature means that it can be used repeatedly without discomfort to the patient [25]. The combination of high spatial resolution and the capability to measure hydrogel properties in vivo leaves ultrasound as a promising tool for evaluating these glucose-sensitive hydrogels, particularly when integrated with wearable devices [26]. As this technology advances, it could significantly improve the practicality and accessibility of continuous glucose monitoring, paving the way for more personalized and effective diabetes management.
METHODS
This section describes the synthesis and characterization of a glucose-responsive hydrogel with tunable porosity. The hydrogel was developed using an acrylamide-based pre-gel solution with phenylboronic acid groups. Hydrogels with varying diameters, pore structure, and pore spacing were evaluated for their glucose response. To evaluate glucose responsiveness, hydrogels were conditioned and monitored for swelling-induced bending within a custom-designed microfluidic channel. Optical imaging and quantitative analysis were then used to assess the hydrogel’s swelling kinetics, with T90 values calculated through function fitting in MATLAB. The following subsections detail each step of the hydrogel fabrication, experimental setup, and data analysis.
A. Hydrogel Synthesis
In this study a glucose-responsive hydrogel was studied. This hydrogel was based on prior compositions from Dr. Solzbacher with some minor modifications. The glucose- responsive hydrogel was developed using a phenylboronic acid (PBA)-based polymer matrix, as outlined in prior research [27]. To prepare the pre-gel solution, a 1 mM HEPES buffer solution (4-(2-hydroxyethyl) piperazine-1-ethane sulfonic acid; Sigma- Aldrich, USA) was made in deionized water and adjusted to pH8. Then, 57.3 mg of 3-acrylamidophenylboronic acid (3-APB, Achemo, China) was dissolved in 261 µL of dimethyl sulfoxide (DMSO, Fisher Scientific, USA) and vortexed for 20 seconds. Next, 711 µL of a 30 wt% acrylamide (Aam, Polysciences Inc., USA) solution in HEPES buffer was added and vortexed for another 10 seconds. Following this, 579 µL of a 2 wt% N,N’- methylene bisacrylamide (BIS, Sigma-Aldrich, USA) solution in HEPES buffer and 849.5 µL of buffer were added to the mixture and vortexed for 10 seconds. Finally, 61.5 µL of N-[3- (dimethylamino)propyl] methacrylamide (DMAPAA, Polysciences Inc., USA) was added and vortexed for 10 seconds. For free-radical polymerization, 154.8 µL of a 4 wt% solution of lithium phenyl-2,4,6-trimethylbenzoyl phosphinate (LAP, Sigma-Aldrich, USA) in HEPES buffer was added as a UV initiator. This pre-gel solution was then used to create the desired hydrogel structure.
To create the hydrogel strands pre-gel solution was drawn into tubing with the desired diameter using a syringe. The tubing was then secured in and exposed to UV light (THORLABS M365L3). This initiated a free radical polymerization to form the hydrogel. Exposure time was for 25 seconds at 365nm. Following exposure, the tubing was then flushed with 1x PBS to remove any uncured pre-gel solution.
The addition of the porous structures was also achieved through UV-mediated synthesis similar to the synthesis of the non-porous strands. However, before UV polymerization a polymer-based photomask (Mylar Mask, Fineline Imaging Inc., USA) with the desired pattern was then positioned directly against the UV transparent tubing and secured with clamps. The polymer-based photo mask contained circular cutouts with diameters of 100 µm and 200 µm along with pore spacing of 400 µm and 800 µm, resulting in circular pores with the corresponding spacings (Figure 1). Examples of hydrogel pores produced this way are shown in Figure 2. After polymerization each hydrogel was conditioned by cycling through 1x PBS to 1/4x PBS and back to 1x PBS over three cycles (24 hours). Once done conditioning the hydrogel was fixed to a microfluidic channel and used to study its glucose responsiveness.
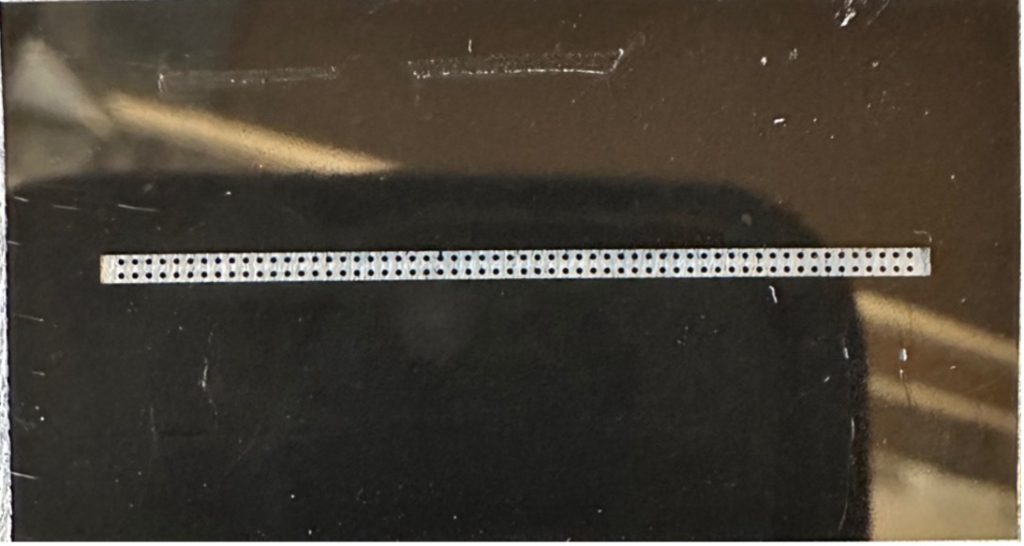
Figure 1. An example of a mylar shadow mask from Fineline Imaging with 200 µm circular disks with 400 µm spacing above and below each disk. This shadow mask was used during polymerization of the hydrogel strands to create pores with the desired size and spacing of the shadow mask.
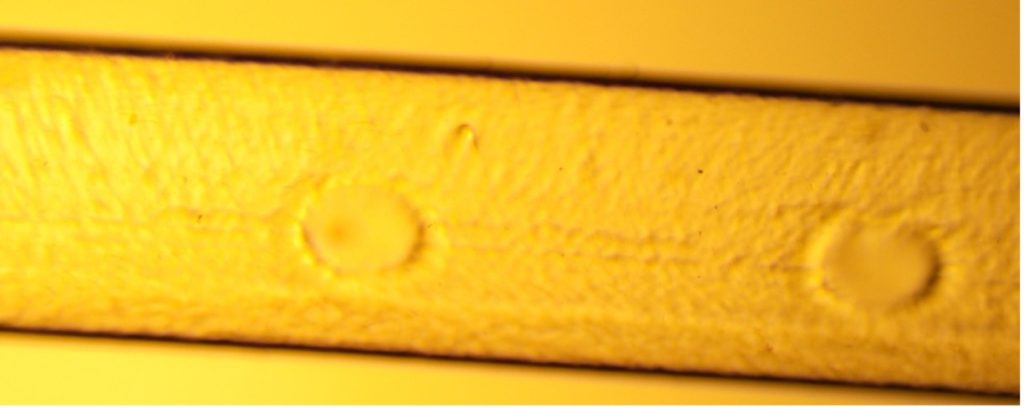
Figure 2. The hydrogel shown above is an example of a porous hydrogel strand (1.5 mm) with 100 µm pores. The hydrogel was synthesized using the method outlined in the Hydrogel Synthesis section.
B. Glucose Responsiveness of Hydrogels
Two separate glucose transitions were conducted for each hydrogel with varying diameters of 0.79 mm, 1 mm, 1.5 mm, and 2 mm. The two transitions observed were 10 mM to 5 mM and 5 mM to 0 mM. To do these solutions were prepared with glucose concentrations of 0 mM (1x PBS), 5 mM, and 10 mM in 1x PBS. After conditioning the strands were placed in 10 mM glucose for 24 hours to equilibrate them. After reaching equilibrium the strands were placed into a microfluidic channel and fixed at both ends to allow for bending when the strands swelled (Figure 3). After the strands were fixed, the solution was changed to 5 mM glucose, and the strands bending was observed over 12 hours. Pictures were taken every 10 minutes for the first 2 hours and then every 30 minutes for the subsequent 10 hours. After the 12 hours and the strand was equilibrated in 5 mM glucose the solution was changed to 0 mM glucose (1x PBS) and further bending was observed. During all experiments, a flow rate of 1 mL/hr was maintained to flush old solution that may have been diluted and/or concentration from the hydrogels swelling. The exact same procedure outlined above was used for the hydrogel strands containing varying porous structures. However, the strand diameter was fixed at 1.5 mm and the pore size and spacing was varied (200 µm diameter with 400 µm spacing, 200 µm diameter with 800 µm spacing, and 100 µm diameter with 400 µm spacing).
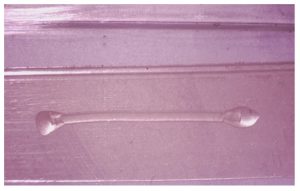

Figure 3. The hydrogel shown above is an example of the method used to analyze the swelling capacity of the hydrogel strand. The desired strand was fixed at both end points in its lowest swelling state and then as the hydrogel was introduced to lower glucose concentrations it swelled and induced the buckling which was then used to quantitatively analyze the hydrogel’s swelling.
C. Microfluidic Channel
The microfluidic channel design was made specifically to observe the hydrogel strand’s bending and maintain a constant flow of solution into the channel [11]. The channel was fabricated in three layers with outer dimensions of 18 mm × 80mm. The top layer, made from acrylic G-UVT, which was selected for its UV transparency and compatibility with laser cutting. The middle layer was made from acrylic and was used to accommodate the height of the hydrogel strands. Lastly, a polycarbonate layer (McMaster-Carr, USA) formed the base. The layers were cut out using a laser cutter (PLS6.150D, Universal Laser Inc., USA), with the top layer containing two cutouts, each with a radius of 0.75 mm and spaced 65 mm apart, serving as fluidic inlet and outlet for the glucose solutions. The channel layers were adhered together using a double-sided biocompatible adhesive tape (ARCare 90445Q, Adhesive Research Inc., USA), and was cut into a 3 mm × 68 mm channel using a razor blade cutting plotter (Cameo 4, Silhouette America, USA). Acrylic tubing adapters (thickness: 5 mm) were laser-cut with a 3.1 mm hole to fit the tubing. The tubing was secured to the adapters (Tygon PVC Tubing, diameter: 3.2 mm, McMaster-Carr, USA) using UV-cured medical-grade epoxy glue (Loctite 3321, Henkel AG, Düsseldorf, Germany). Figure 4 shows the completed microfluidic channel.
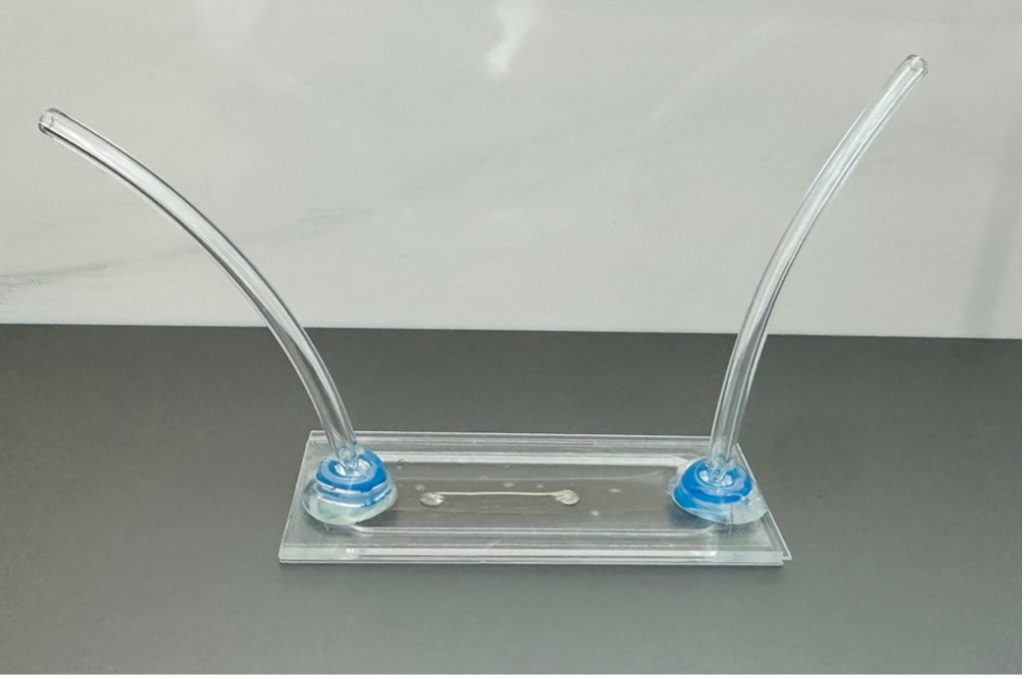
Figure 4. The device shown above is an example of a microfluidic channel used to analyze the hydrogel strands. The middle of the channel contains glucose solution and where the hydrogel is housed. It also contains a fluidic inlet and outlet for attachment to a syringe pump. More details are outlined in the Microfluidic Channel section.
D. Optical Measurement System
The optical measurement system used to record pictures of the hydrogel was designed to measure the hydrogel strands optically to characterize the hydrogel’s swelling through its bending. Figure 5 presents an overview of the optical evaluation platform. At the center of the setup is a microfluidic channel that houses the hydrogel strands (Figure 4). This channel is clamped on both ends to the microscope and includes tubing on either side for attachment to a syringe pump system, enabling automated glucose solution delivery over the course of the trial (1 mL/hr) [11].
The optical measurement system comprises of a microscope (AmScope SM-2T) and a camera (AmScope MU1003) connected to the microscope using the AmScope FMA050 fixed microscope adapter. Positioned in center of the setup, the light source connected to the microscope backlights the hydrogel within the microfluidic channel. The microscope also functions as an adjustable mechanical stage to hold the microfluidic channels, allowing for positioning along the optical axis for focusing on the hydrogel structures. Additionally, the image sensor’s position is adjustable to align its field of view with the hydrogel strands. The microscope was used to take optical pictures of the hydrogel’s bending for evaluation. The overall optical measurement setup is pictured in Figure 5.
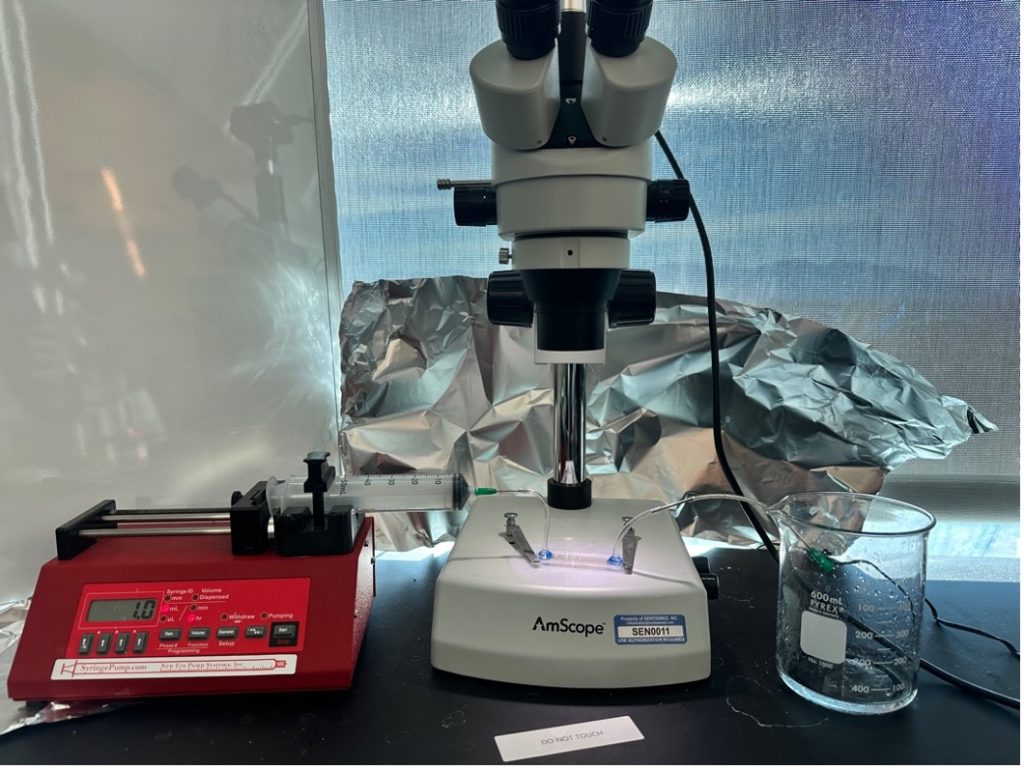
Figure 5. The figure above outlines the entire optical readout system. In the figure the microfluidic channel is attached to a syringe pump (left fluidic inlet) to maintain a constant glucose concentration. It is also connected to a waste beaked (right fluidic outlet) for the excess glucose solution to drain. An optical camera (AmScope MU1003) is attached to the microscope (AmScope SM-2T) to take pictures of the hydrogel while it swells.
E. Hydrogel Swelling Characterization
The bending data was normalized to the surface area of the hydrogel’s maximum swelling point. The data points used to calculate T90 represent the average normalized area under the curve in percent. This was calculated using the opensource platform FIJI [28]. To determine the T90 values, which represent the time taken for each hydrogel strand to reach 90% of its maximum swelling response, a polynomial fitting approach was employed in MATLAB. The corresponding swelling percentages for each trial were taken into MATLAB. For each trial a polynomial was fitted to the data using MATLAB’s polyfit function to generate a smooth curve that accurately represents the trend in swelling over time [29].
The maximum swelling percentage from the fitted polynomial curve was identified and used to calculate the target swelling percentage for T90 as the time it takes to reach 90% of this maximum swelling. A custom MATLAB function was then applied to pinpoint the time at which the polynomial curve reached this T90 value. This function takes as inputs the time vector, the fitted curve, the target Y-value, and a specified tolerance (10-3%). It then returns the time points where the swelling percentage is within the tolerance range. Finally, the T90 times were visualized on a plot of the swelling data, with the polynomial fit and a vertical line marking the T90 point.
RESULTS
A. Comparison of Strand Diameters
The swelling response of glucose-sensitive hydrogel strands was evaluated across four varying strand diameters: 0.79 mm, 1.0 mm, 1.5 mm, and 2.0 mm. The objective of these trials was to analyze the effect of strand diameter on the time required to reach 90% of the maximum swelling state (T90). Hydrogel strands were synthesized using a uniform fabrication method to ensure consistency in diameter, as outlined in the Hydrogel Synthesis section. By comparing the swelling responses across different strand sizes, we aimed to assess how diffusion dynamics and hydrogel structure influence swelling behavior when exposed to varying glucose concentrations.
To investigate this behavior, all hydrogel strands were subjected to two glucose concentration transitions: the first transition from 10 mM to 5 mM glucose and the second transition from 5 mM to 0 mM glucose. The results from these experiments are summarized in Figures 6 and 7, which presents the average T90 values for each strand diameter. The bar charts highlight a clear trend: smaller strand diameters exhibit significantly lower T90 values, indicating a faster swelling response, while larger strand diameters take longer to reach their T90.
Among the tested diameters for the glucose transition of 10 mM to 5 mM, the 0.79 mm strands exhibited the fastest response times with an average of 28.8 minutes, reaching their T90 in the shortest duration. The 1.0 mm and 1.5 mm strands displayed intermediate T90 values, while the 2.0 mm strands exhibited the slowest response with the average strand taking 469.6 minutes, requiring significantly more time to reach their T90. The observed trends were consistent across both glucose transitions.
To further illustrate the swelling kinetics, Figure 8 presents the swelling behavior of the 0.79 mm hydrogel strands over time for both glucose transitions. This figure displays individual trial data, with swelling percentage plotted as a function of time. The dotted line represents the average T90 for both glucose transitions. Additionally, the small variation across multiple trials suggests a high degree of reproducibility in the swelling behavior of these strands. The overall trend observed in the 0.79 mm strands is consistent with the trend for larger diameters with the strand just swelling slower. A compiled table of all T90 values is shown in the appendix (Tables 1 & 2).
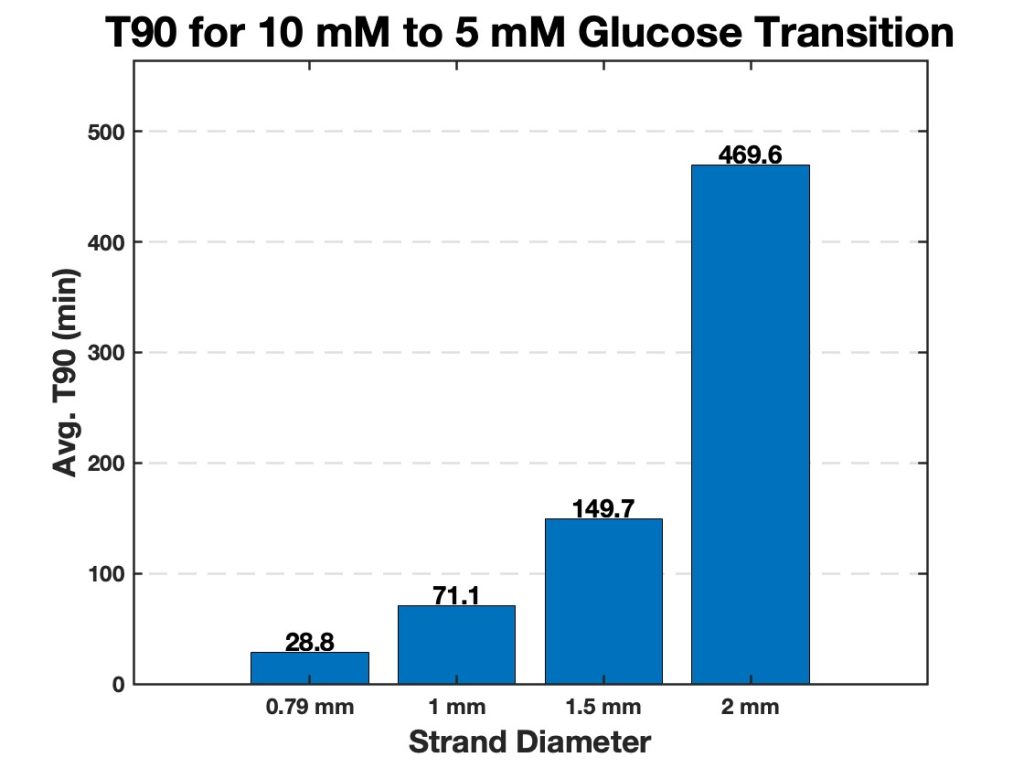
Figure 6. Average T90 values for hydrogel strands of varying diameters (0.79 mm, 1.0 mm, 1.5 mm, and 2.0 mm). The bar chart displays the time required for each strand diameter to reach 90% of its maximum swelling (T90) when transitioning from 10 mM to 5 mM glucose. Smaller diameter strands exhibit significantly faster swelling responses, while larger strands require more time to reach their T90.
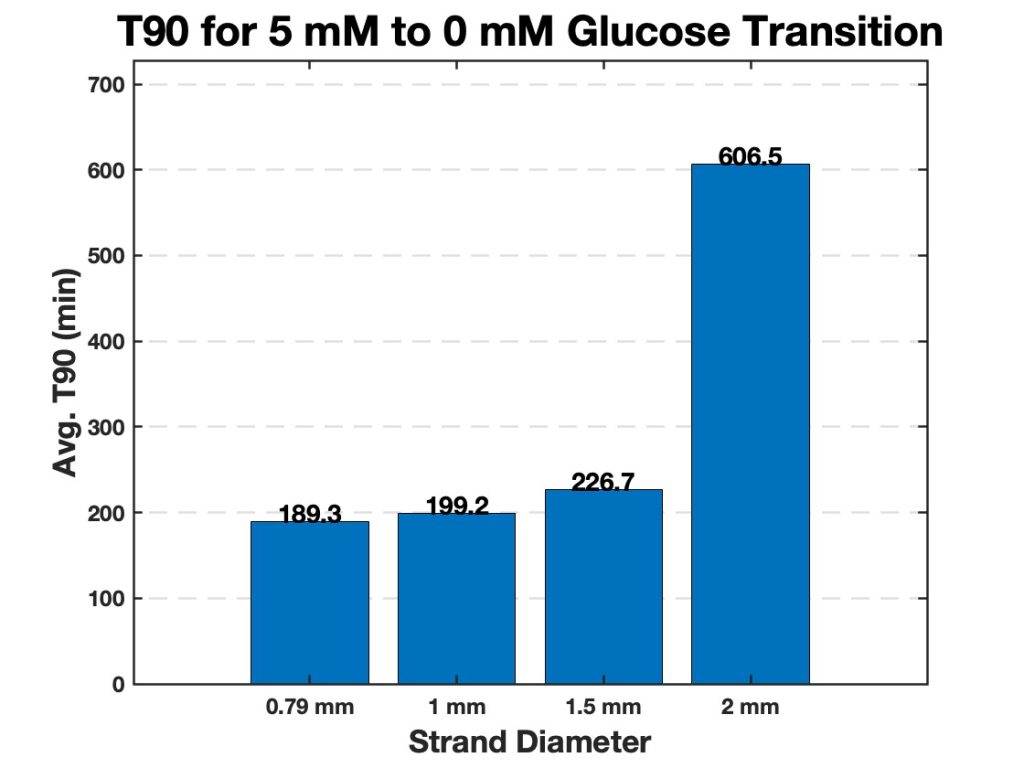
Figure 7. Average T90 values for hydrogel strands of varying diameters (0.79 mm, 1.0 mm, 1.5 mm, and 2.0 mm). The bar chart displays the time required for each strand diameter to reach 90% of its maximum swelling (T90) when transitioning from 5 mM to 0 mM glucose. Smaller diameter strands exhibit significantly faster swelling responses, while larger strands require more time to reach their T90.
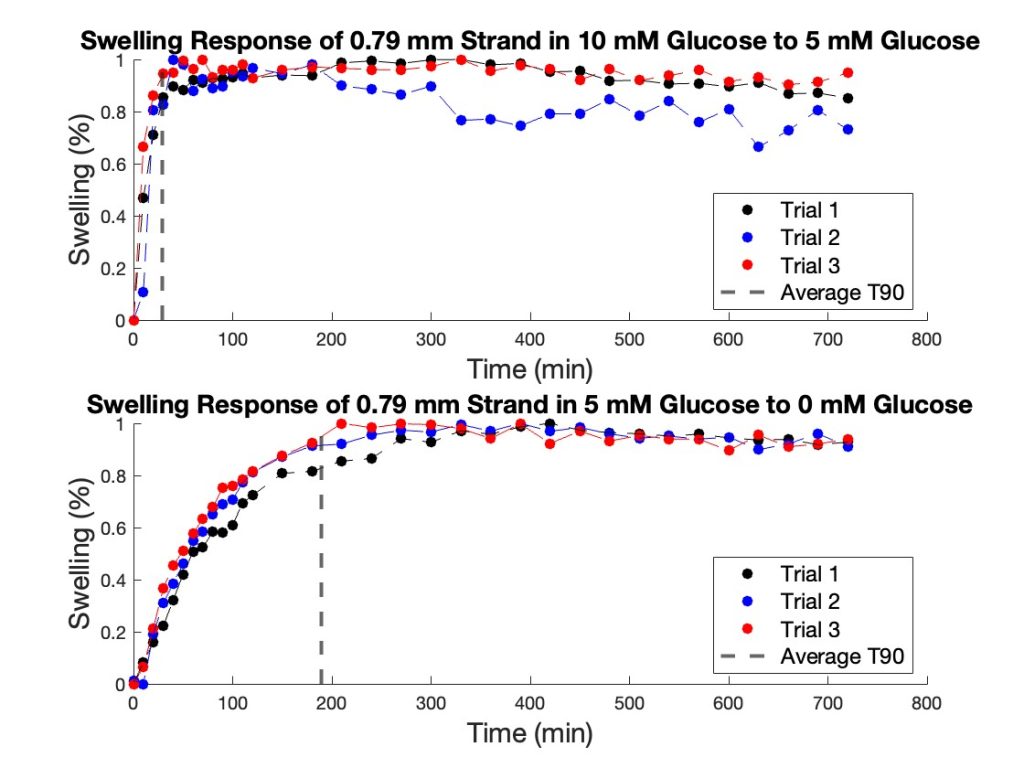
Figure 8. Swelling response of 0.79 mm hydrogel strands. The top graph illustrates the strand’s response when transitioning from 10 mM glucose to 5 mM glucose, with the dashed line indicating the average T90 value (28.83 min). The bottom graph depicts the response when transitioning from 5 mM glucose to 0 mM glucose, with a T90 value of 189.31 min.
B. Comparison of Porous Strands
The swelling response of porous hydrogel strands was evaluated under three different porous configurations. All strands maintained a consistent diameter of 1.5 mm to ensure uniformity in size. Three porous hydrogel configurations tested were 200 µm pores with 400 µm spacing, 200 µm pores with 800 µm spacing, and 100 µm pores with 400 µm spacing. Using these hydrogel configurations the same two glucose concentration transitions used for testing the hydrogel diameters were used (10 mM glucose to 5 mM glucose and from 5 mM glucose to 0 mM glucose).
In the first transition, from 10 mM glucose to 5 mM glucose, strands with 200 µm pores and 400 µm spacing exhibited the shortest T90. The strands with the same pore size (200 µm) but a larger spacing of 800 µm displayed a longer T90, indicating a slower swelling process compared to the denser configuration. The strands with 100 µm pores and 400 µm spacing had the longest T90, suggesting that both smaller pore size and less pore density contributed to a slower swelling response (Figure 9).
Similarly to the diameters tested, in the second transition, from 5 mM glucose to 0 mM glucose, the trends in T90 values were consistent with those observed in the first transition. Hydrogel strands with 200 µm pores and 400 µm spacing once again showed the fastest swelling response, followed by strands with 200 µm pores and 800 µm spacing. The 100 µm pore strands with 400 µm spacing showed the slowest response for this glucose transition as well (Figure 10). The differences in T90 between configurations were comparable across both transitions. To further highlight the swelling mechanism of the porous hydrogel strands Figure 11 highlights the swelling kinetics of the strands with 200 µm pores and 400 µm pore spacing. It shows the normalized swelling percentage as a function of time during both glucose transitions. It also presents individual trial data, with the dotted line marking the average T90 for each transition.
Overall, T90 values decreased as pore size increased and pore spacing increased, for both glucose concentration transitions. The strands with 200 µm pores and 400 µm pore spacing consistently had a lower T90 compared to other pore configurations for both transitions. This demonstrates the role of large pores and high pore density in facilitating rapid swelling. The results indicate a relationship between the porous structure of the hydrogel strands and their swelling behavior in response to glucose concentration changes. Strands with larger and more densely spaced pores exhibited the fastest response, while smaller pores or wider spacing led to slower T90 values and therefore a slower swelling response. A compiled table of all T90 values is shown in the appendix (Tables 3 & 4).
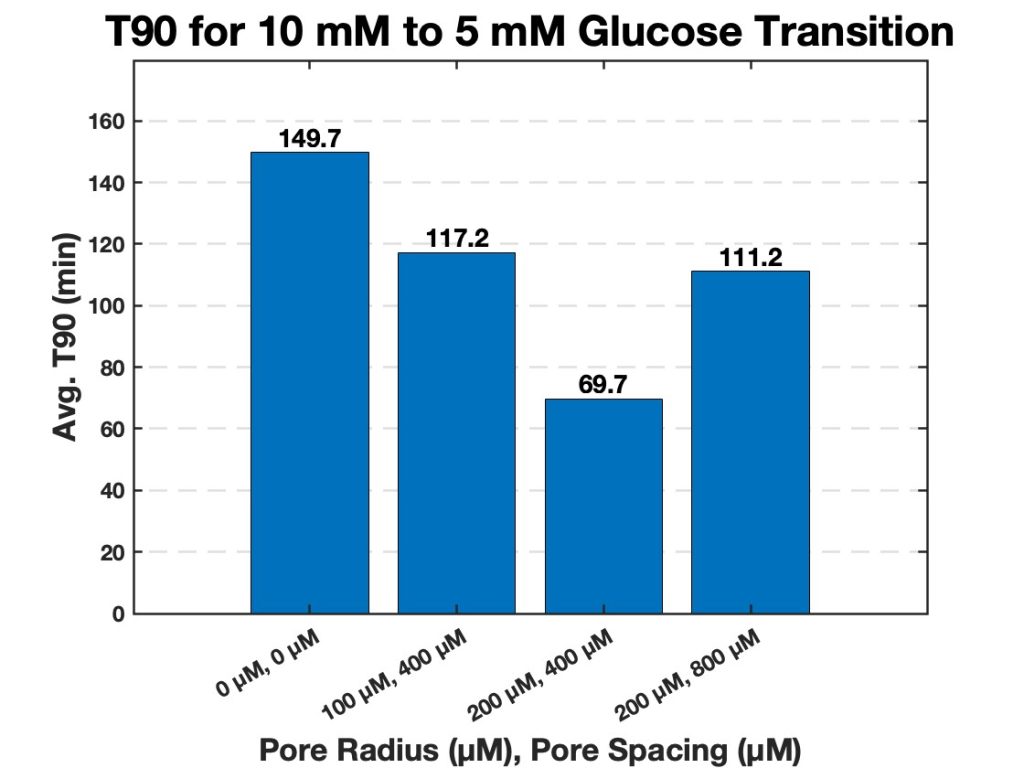
Figure 9. Average T90 values for hydrogel strands of varying pores and pore spacing (0 µm with 0 µm spacing, 100 µm with 400 µm spacing, 200 µm with 400 µm spacing, and 200 µm with 800 µm spacing). The bar chart displays the average time required for each strand diameter to reach 90% of its maximum swelling (T90) when transitioning from 10 mM to 5 mM glucose.
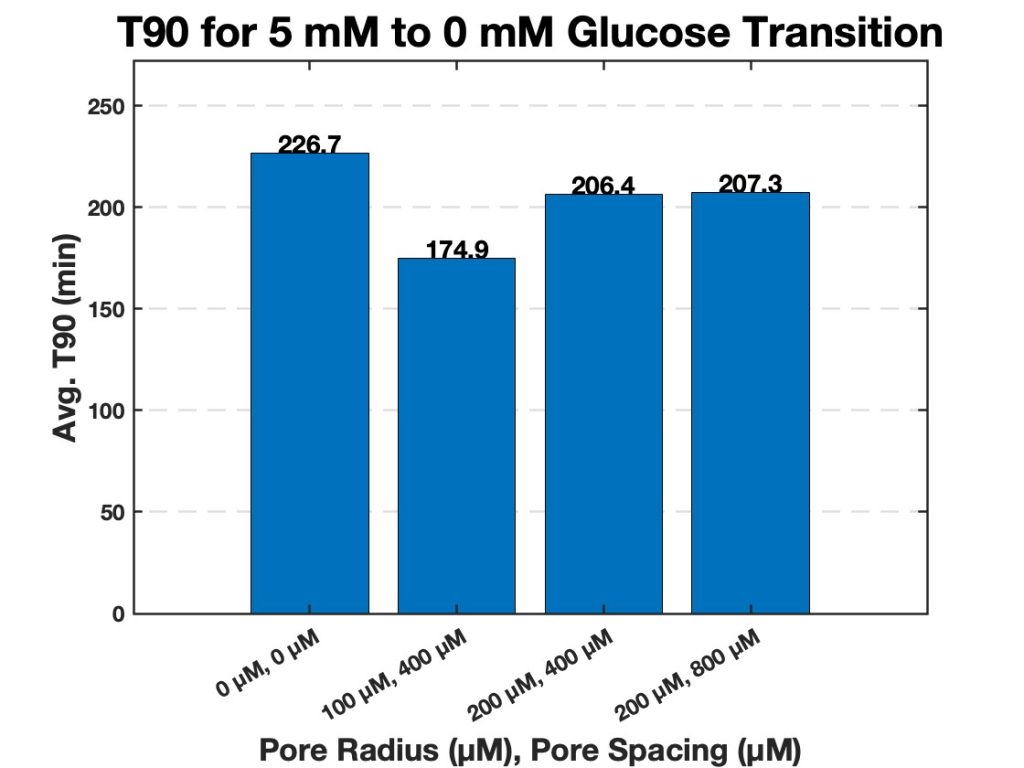
Figure 10. Average T90 values for hydrogel strands of varying pores and pore spacing (0 µm with 0 µm spacing, 100 µm with 400 µm spacing, 200 µm with 400 µm spacing, and 200 µm with 800 µm spacing). The bar chart displays the average time required for each strand diameter to reach 90% of its maximum swelling (T90) when transitioning from 5 mM to 0 mM glucose.
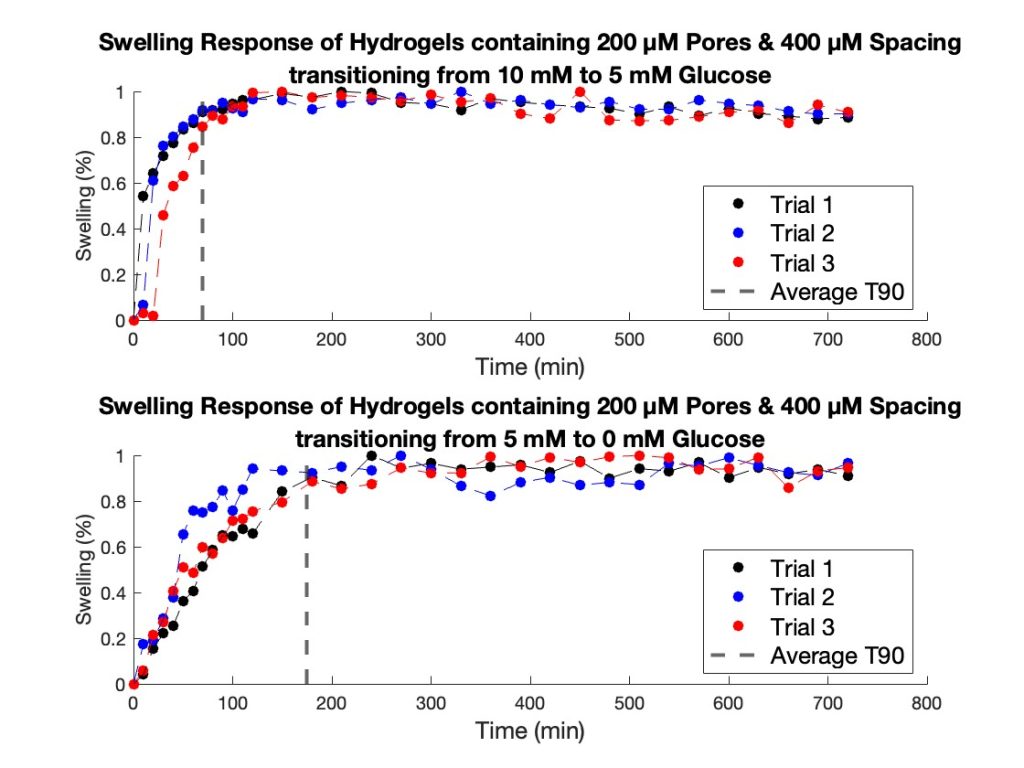
Figure 11. Swelling response of 1.5 mm hydrogel strands with 200 μM pores and 400 μM spacing. The top graph illustrates the strand’s response when transitioning from 10 mM glucose to 5 mM glucose, with the dashed line indicating the average T90 value (69.67 min). The bottom graph depicts the response when transitioning from 5 mM glucose to 0 mM glucose, with a T90 value of 174.89 min.
Discussion
The purpose of this study was to optimize the structural design of our glucose-sensitive hydrogel to improve its responsiveness and glucose sensitivity for potential use in a continuous glucose monitor. Specifically, our research focused on evaluating the effects of strand diameter and porosity on the hydrogel’s response time to reach 90% of its maximum swelling state (T90). Understanding how these structural features influence glucose response will enable the development of hydrogels that are not only responsive to glucose fluctuations but also practical for real-world applications, such as a minimally invasive and cost-effective glucose biosensor.
A. Influence of Strand Diameter
The inverse relationship between hydrogel strand diameter and T90 shows the importance of minimizing strand diameter to achieve faster glucose responses. Smaller-diameter strands exhibited significantly lower T90 values compared to larger strands, indicating their higher responsiveness to glucose concentration changes. This trend can be attributed to the higher surface area-to-volume ratio in smaller strands, which facilitates faster glucose diffusion and more efficient interaction with the hydrogel’s matrix [17, 23].
However, the mechanical stability of thinner strands must also be considered in practical applications. While smaller diameters improve responsiveness, they may be more susceptible to breakage or deformation during handling or implantation. Balancing mechanical strength and response time will be critical for the translation of these findings into clinically viable devices [30, 31].
B. Impact of Porosity
Porous structures in the hydrogel strands further enhanced glucose responsiveness, particularly in strands with higher pore density. Increased porosity likely improves glucose diffusion through the hydrogel matrix by reducing barriers to molecular transport and enabling more rapid changes in swelling. Furthermore, the presence of pores may allow for more efficient water exchange during glucose-induced swelling and shrinkage, enhancing the hydrogel’s overall responsiveness [9].
While the benefits of increased porosity are evident, excessive porosity may compromise the hydrogel’s structural integrity and reduce its lifespan in physiological environments. Optimizing the pore size and density is essential to ensure a balance between the hydrogel’s performance and degradability. Future studies could also explore the mechanical properties of these porous hydrogels under simulated physiological conditions to further refine their design.
C. Implications for Diabetes Management
The results of this study highlight the potential of glucose- sensitive hydrogels as transformative tools in diabetes management. These hydrogels present a promising alternative to conventional glucose monitoring technologies such as finger- stick blood tests and continuous glucose monitors (CGMs). Unlike existing systems that can be expensive or difficult to access in low-resource settings, hydrogel-based sensors offer a simpler and more cost-effective solution [3, 4].
One key advantage of these hydrogels is their biocompatibility. Traditional CGMs involve subcutaneous sensors that may cause discomfort or skin irritation, particularly in individuals who require long-term monitoring. In contrast, glucose-sensitive hydrogels can be engineered to function as implantable CGM as they have the ability to measure low concentrations of glucose [31, 32]. Their ability to integrate with non-invasive imaging techniques, such as ultrasound- based monitoring further enhances their appeal [21, 24, 27]. Such a setup could allow individuals with diabetes to monitor their glucose levels in real time without the need for frequent sensor replacements or invasive procedures [33, 34].
The inexpensiveness of hydrogels also has significant implications for global health. In many low- and middle-income countries, where the prevalence of diabetes is rising rapidly, access to advanced glucose monitoring technologies remains limited due to their high cost. Glucose-sensitive hydrogels could bridge this gap providing a reliable alternative for continuous glucose monitoring in low-income settings [35].
D. Limitations and Future Directions
Despite the promising results, several limitations must be addressed in future research. First, this study was conducted in vitro, and the hydrogels’ performance in vivo remains unknown. Biological factors such as enzymatic degradation, immune response, and variable glucose diffusion in subcutaneous tissues may influence the hydrogels behavior. Investigating these factors through animal models and eventually clinical trials will be necessary to confirm the hydrogels’ efficacy in clinical applications.
Second, while optical imaging was effective for evaluating swelling behavior in this study, it is limited to benchtop characterization. The integration of ultrasound technology for in vivo monitoring should be explored further, particularly given its non-invasive and portable nature. Additionally, further refinement of hydrogel strands structural parameters could influence the ultrasound readout from the hydrogel strand.
Finally, scalability and cost-effectiveness must be assessed to ensure that these hydrogels can be manufactured and distributed affordably, especially in low- and middle-income countries, while also overcoming the cost barriers posed by existing glucose sensors on the market to enhance their competitive edge.
Appendix
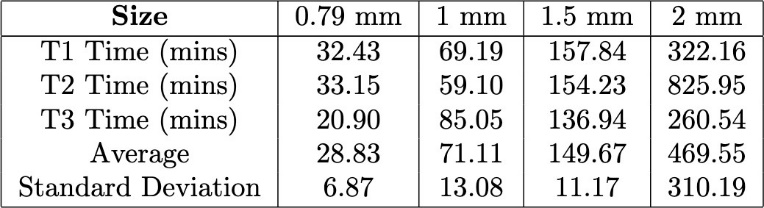
Table 1. Comparison of the T90 values for hydrogel strands of varying diameters during the transition from 10 mM glucose to 5 mM glucose.
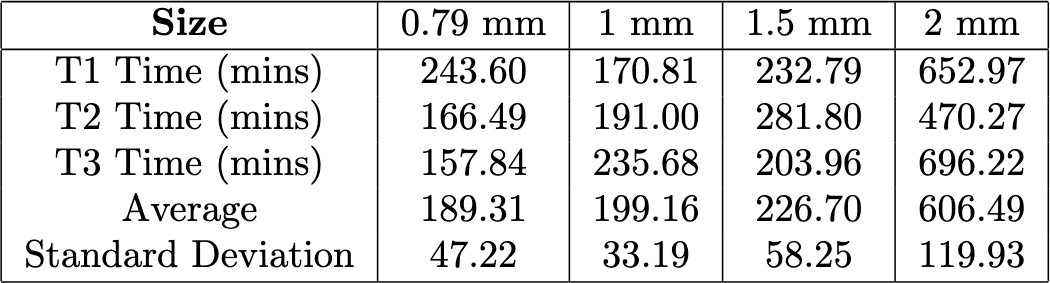
Table 2. Comparison of the T90 values for hydrogel strands of varying diameters during the transition from 5 mM glucose to 0 mM glucose.
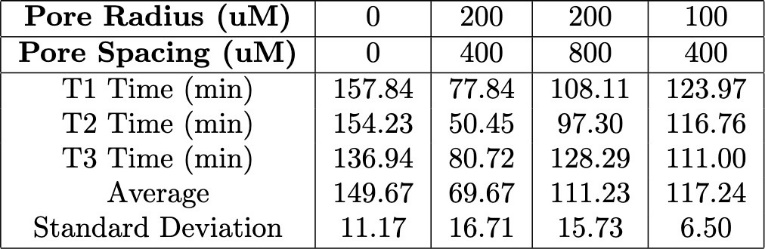
Table 3. Comparison of the T90 values for varying hydrogel porous structures with pore radii ranging from 100–200 μM and pore spacing between 400–800 μM during the transition from 10 mM glucose to 5 mM glucose.
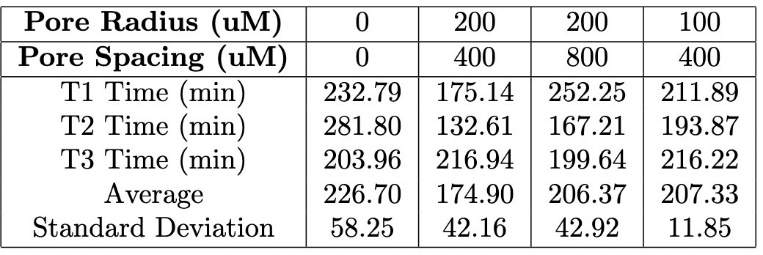
Table 4. Comparison of the T90 values for varying hydrogel porous structures with pore radii ranging from 100–200 μM and pore spacing between 400–800 μM during the transition from 5 mM glucose to 0 mM glucose.
Acknowledgements
Thanks to all of the members of Dr. Lars Laurentius’ lab for their guidance and resources throughout this project. Also, a special thanks to Saeed Borooman, PhD, and Jessica Owsley, Undergraduate Researcher, for their expertise and support throughout this project. I also acknowledge the Biomedical Engineering Department at the University of Utah for providing a collaborative and innovative environment. Lastly, I deeply appreciate the Office of Undergraduate Research at the University of Utah for their funding and resources, which made this research possible. This work was also supported by the U.S National Science Foundation (NSF) under grant number 2212977, awarded to Sentiomed, Inc.
Reference
- “Diabetes.” [Online]. Available: https://www.who.int/news-room/fact-sheets/detail/diabetes
- CDC, “Diabetes Basics,” Diabetes. [Online]. Available: https://www.cdc.gov/diabetes/about/index.html
- A. E. Manov et al., “The Effectiveness of Continuous Glucose Monitoring Devices in Managing Uncontrolled Diabetes Mellitus: A Retrospective Study,” Cureus, vol. 15, no. 7, Jul. 2023, doi: 10.7759/cureus.42545.
- “Systematic review and meta-analysis of the effectiveness of continuous glucose monitoring (CGM) on glucose control in diabetes | Diabetology & Metabolic Syndrome | Full Text.” [Online].Available: https://dmsjournal.biomedcentral.com/articles/10.1186/1758- 5996-5-39
- N. A. Peppas, J. Z. Hilt, A. Khademhosseini, and R. Langer, “Hydrogels in Biology and Medicine: From Molecular Principles to Bionanotechnology,” Advanced Materials, vol. 18, no. 11, pp. 1345–1360, 2006, doi: 10.1002/adma.200501612.
- M. C. Koetting, J. T. Peters, S. D. Steichen, and N. A. Peppas, “Stimulus-responsive hydrogels: Theory, modern advances, and applications,” Materials Science and Engineering: R: Reports, vol. 93, pp. 1–49, Jul. 2015, doi: 10.1016/j.mser.2015.04.001.https://doi.org/10.1016/j.mser.201 5.04.001
- J. Sawayama, T. Okitsu, A. Nakamata, Y. Kawahara, and S. Takeuchi, “Hydrogel Glucose Sensor with In Vivo Stable Fluorescence Intensity Relying on Antioxidant Enzymes for Continuous Glucose Monitoring,” iScience, vol. 23, no. 6, Jun. 2020, doi: 10.1016/j.isci.2020.101243.
- H. Shibata, Y. J. Heo, T. Okitsu, Y. Matsunaga, T. Kawanishi, and S. Takeuchi, “Injectable hydrogel microbeads for fluorescence-based in vivo continuous glucose monitoring,” Proceedings of the National Academy of Sciences, vol. 107, no. 42, pp. 17894–17898, Oct. 2010, doi: 10.1073/pnas.1006911107.
- “Porous Hydrogels: Present Challenges and Future Opportunities | Langmuir.” [Online]. Available: https://pubs.acs.org/doi/10.1021/acs.langmuir.2c02253
- K. Rückmann, G. Mu, J. J. Magda, F. Solzbacher, C. F. Reiche, and J. Körner, “A reliable and easy-to-implement optical characterization method for dynamic and static properties of smart hydrogels,” Polymer, vol. 246, p. 124713, Apr. 2022, doi: 10.1016/j.polymer.2022.124713.
- S. Borooman et al., “Optical Imaging of Microfluidic Integrated Smart Hydrogels for Research and Sensing Applications,” Jul. 02, 2024, ChemRxiv. doi: 10.26434/chemrxiv-2024-91317.
- E. Eyth and R. Naik, “Hemoglobin A1C,” in StatPearls, Treasure Island (FL): StatPearls Publishing, 2025. [Online]. Available: http://www.ncbi.nlm.nih.gov/books/NBK549816/
- W. Hu, Z. Wang, Y. Xiao, S. Zhang, and J. Wang, “Advances in crosslinking strategies of biomedical hydrogels,” Biomater. Sci., vol. 7, no. 3, pp. 843–855, Feb. 2019, doi: 10.1039/C8BM01246F.
- J. Maitra and V. K. Shukla, “Cross-linking in Hydrogels – A Review,” American Journal of Polymer Science, vol. 4, no. 2, pp. 25–31, 2014.
- T.-C. Ho et al., “Hydrogels: Properties and Applications in Biomedicine,” Molecules, vol. 27, no. 9, p. 2902, May 2022, doi: 10.3390/molecules27092902.
- H. M. El-Husseiny et al., “Smart/stimuli-responsive hydrogels: Cutting-edge platforms for tissue engineering and other biomedical applications,” Materials Today Bio, vol. 13, p. 100186, Jan. 2022, doi: 10.1016/j.mtbio.2021.100186.
- J. Erfkamp, M. Guenther, and G. Gerlach, “Hydrogel- based piezoresistive sensor for the detection of ethanol,” Journal of Sensors and Sensor Systems, vol. 7, no. 1, pp. 219– 226, Apr. 2018, doi: 10.5194/jsss-7-219-2018.
- J. Erfkamp, M. Guenther, and G. Gerlach, “Enzyme- Functionalized Piezoresistive Hydrogel Biosensors for the Detection of Urea,” Sensors, vol. 19, no. 13, Art. no. 13, Jan. 2019, doi: 10.3390/s19132858.
- J. Erfkamp, M. Guenther, and G. Gerlach, “Piezoresistive Hydrogel-Based Sensors for the Detection of Ammonia,” Sensors, vol. 19, no. 4, Art. no. 4, Jan. 2019, doi: 10.3390/s19040971.
- M. Elsherif, M. U. Hassan, A. K. Yetisen, and H. Butt, “Glucose Sensing with Phenylboronic Acid Functionalized Hydrogel-Based Optical Diffusers,” ACS Nano, vol. 12, no. 3, pp. 2283–2291, Mar. 2018, doi: 10.1021/acsnano.7b07082.
- P. D. Kairy, S. Binder, F. Solzbacher, L. B. Laurentius, and C. F. Reiche, “Probing glucose-sensitive hydrogel resonators with a portable medical ultrasound imaging system,” in 2024 46th Annual International Conference of the IEEE Engineering in Medicine and Biology Society (EMBC), Jul. 2024, pp. 1–4. doi: 10.1109/EMBC53108.2024.10782116.
- M. Wu et al., “A smart hydrogel system for visual detection of glucose,” Biosensors and Bioelectronics, vol. 142, p. 111547, Oct. 2019, doi: 10.1016/j.bios.2019.111547.
- “Detecting and Monitoring Hydrogels with Medical Imaging | ACS Biomaterials Science & Engineering.” [Online]. Available: https://pubs.acs.org/doi/10.1021/acsbiomaterials.0c01547
- P. D. Kairy et al., “Catheter-mounted smart hydrogel ultrasound resonators for intravenous analyte monitoring,” in 2021 43rd Annual International Conference of the IEEE Engineering in Medicine & Biology Society (EMBC), Nov. 2021,pp.7476–7479.doi: 10.1109/EMBC46164.2021.9630671.
- M. J. Matthews and M. F. Stretanski, “Ultrasound Therapy,” in StatPearls, Treasure Island (FL): StatPearls Publishing, 2025. Accessed: Apr. 03, 2025. [Online]. Available: http://www.ncbi.nlm.nih.gov/books/NBK547717/
- N. Farhoudi, H.-Y. Leu, L. B. Laurentius, J. J. Magda, F. Solzbacher, and C. F. Reiche, “Smart Hydrogel Micromechanical Resonators with Ultrasound Readout for Biomedical Sensing,” ACS Sens., vol. 5, no. 7, pp. 1882–1889, Jul. 2020, doi: 10.1021/acssensors.9b02180.
- J. Anzai, “Recent progress in electrochemical biosensors based on phenylboronic acid and derivatives,” Materials Science and Engineering: C, vol. 67, pp. 737–746, Oct. 2016, doi: 10.1016/j.msec.2016.05.079.
- J. Schindelin et al., “Fiji: an open-source platform for biological-image analysis,” Nat Methods, vol. 9, no. 7, pp. 676– 682, Jun. 2012, doi: 10.1038/nmeth.2019.
- “What Is MATLAB?” [Online]. Available: https://www.mathworks.com/discovery/what-is-matlab.html
- “Injectable Hydrogels: From Laboratory to Industrialization.”[Online].Available: https://www.mdpi.com/2073-4360/13/4/650
- G. Lin et al., “Osmotic swelling pressure response of smart hydrogels suitable for chronically implantable glucose sensors,” Sensors and Actuators B: Chemical, vol. 144, no. 1, pp. 332–336, Jan. 2010, doi: 10.1016/j.snb.2009.07.054.
- W. Bai, N. A. Gariano, and D. A. Spivak, “Macromolecular Amplification of Binding Response in Superaptamer Hydrogels,” J. Am. Chem. Soc., vol. 135, no. 18, pp. 6977–6984, May 2013, doi: 10.1021/ja400576p.
- J. Körner, C. F. Reiche, H.-Y. Leu, N. Farhoudi, J. Magda, and F. Solzbacher, “A Sensor Platform for Smart Hydrogels in Biomedical Applications,” Proceedings, vol. 2, no. 13, Art. no. 13, 2018, doi: 10.3390/proceedings2131006.
- H.-Y. Leu et al., “Low-Cost Microfluidic Sensors with Smart Hydrogel Patterned Arrays Using Electronic Resistive Channel Sensing for Readout,” Gels, vol. 4, no. 4, Art. no. 4, Dec. 2018, doi: 10.3390/gels4040084.
- E. Caló and V. V. Khutoryanskiy, “Biomedical applications of hydrogels: A review of patents and commercial products,” European Polymer Journal, vol. 65, pp. 252–267, Apr. 2015, doi: 10.1016/j.eurpolymj.2014.11.024.
Media Attributions
- 137489262_figure1
- 146879582_figure2
- 146879585_figure3.1 (1)
- 146879585_figure3.1
- 146881870_figure4
- 146882801_figure5
- 146883688_figure6
- 146883866_figure7
- 146883898_figure8
- 146883953_figure9
- Figure10
- Figure11
