John and Marcia Price College of Engineering
22 Image Processing of X-rays of the Spine and Spinal Cord Stimulation Implants
Chimdi Ihediwa and Ashley Dalrymple
Faculty Mentor: Ashley Dalrymple (Biomedical Engineering and Physical Medicine & Rehabilitation, University of Utah)
Abstract
Spinal cord stimulation (SCS) is an emerging therapy for restoring motor function in individuals with neurological impairments. While SCS has shown promise in both pain management and locomotor rehabilitation, its clinical success depends heavily on accurate electrode placement along the spinal cord. Currently, electrode localization is performed manually using intraoperative X-ray fluoroscopy and trial-and-error methods, which are time-consuming, subjective, and prone to inconsistency. To address this, we developed an automated image segmentation pipeline using a U-Net convolutional neural network to identify spinal vertebrae and SCS electrodes from anterior-posterior X-ray images. A total of 209 fluoroscopic images from people who received SCS implants were manually annotated and augmented to a training dataset of 624 images. The U-Net model achieved a global pixel accuracy of 83.9% and demonstrated stable convergence. However, segmentation of electrodes and vertebrae underperformed as they were frequently misclassified as background. These misclassifications were due to class imbalance favoring background and the small size of target objects. These limitations highlight the need for more robust architectures, larger datasets, and adaptive augmentation strategies. Future efforts will focus on implementing nnU-Net, a self-configuring deep learning framework that optimizes architecture, preprocessing, and augmentation dynamically. This model will support future intraoperative applications where EMG signals from leg muscles are mapped to electrode locations, enabling the generation of patient-specific functional maps for improved SCS placement and rehabilitation outcomes.
Introduction
Neural injuries, such as spinal cord injury (SCI) and stroke cause significant motor impairments, severely impacting an individual’s quality of life. Combined, stroke and SCI account for 57.3% of all paralysis cases in the United States [1]. Approximately one-third of these patients regain the ability to walk independently or with the assistance of ambulatory devices. Rehabilitation outcomes, including increased independence and mobility, can be greatly improved using specialized implants that interface with and control the patient’s neuroanatomy. One example of such a neural control device is spinal cord stimulation (SCS).
SCS delivers electrical impulses to the spinal cord. While SCS is well established as a method for managing chronic pain [2], growing evidence suggests that SCS may also enable locomotor recovery and is currently being investigated in clinical trials for SCI rehabilitation[3], [4], [5], [6], [7].
Regardless of the intended clinical application, the precise placement of electrodes along the spinal cord is critical for achieving optimal outcomes. In pain management, electrodes are typically positioned more midline over the dorsal columns; for motor function recovery, they are placed more laterally, targeting the dorsal roots. However, conventional SCS lacks specificity in muscle activation because it indirectly stimulates motoneurons through reflexive pathways.
Recognizing the limitation, there is a need to explore electrode placement strategies that enable more precise muscle activation and improved therapeutic effects. Understanding the anatomical location of electrode placement is essential to correlate the stimulation site with the resulting muscle activation patterns.
Currently, electrode placement is determined largely through a trial-and-error process. During implantation, real-time X-ray fluoroscopy is used to visually guide the insertion of electrode leads into the epidural space along the spinal cord [8]. Electrode positioning is then paired with its functional output. In the case of locomotor rehabilitation, functional output is assessed using electromyography (EMG). This process is repeated until an optimal muscle response is observed. However, this manual approach is time-consuming and prone to inaccuracies, which compromises the reliability of correlating EMG signals with electrode position.
To overcome these limitations, X-ray image analysis and machine learning techniques are proposed to automate the identification of electrode locations relative to spinal vertebral levels. This project aims to develop a method for automatically segmenting SCS electrodes and vertebrae from X-ray fluoroscopy images. By using automated image processing, motor responses can be more precisely correlated with the exact site of stimulation along the spine.
Improving this correlation enhances both the accuracy and efficiency of electrode placement. Ultimately, this approach is intended to increase the effectiveness of SCS by supporting more targeted muscle activation and improving patient rehabilitation outcomes.
Background
Effects of Motoneuron-prostheses on Rehabilitation.
Motor neuro-prostheses are devices that deliver electrical stimulation to parts of the nervous system that are involved in generating motor movement with the goal of restoring motor function after neuromotor disorders or injury [9]. Spinal cord stimulators are a neuroprosthesis that involves implanting leads with electrodes into the epidural space dorsal to the spinal cord (Figure 1).
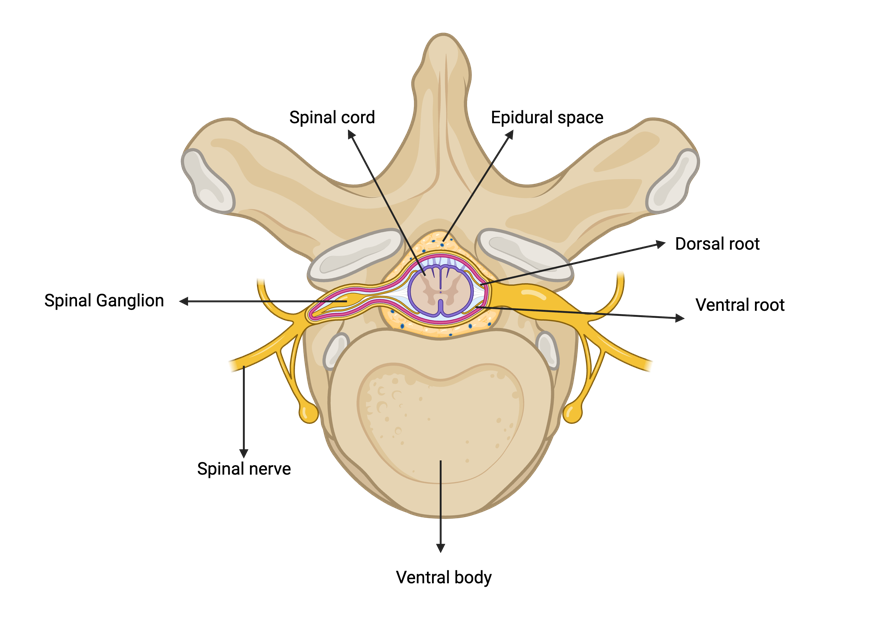
Figure 1. Cross-sectional anatomy of the spinal cord and vertebra, highlighting the dorsal and ventral roots which join to form the spinal nerve. The diagram also illustrates the spinal epidural space. Figure made in BioRender.
For rehabilitation, SCS leads are placed laterally over the dorsal spinal roots. Electrical stimulation is delivered through the electrodes, activating large-diameter afferent (sensory) fibers [2]. The activation of large-diameter afferents results in monosynaptic activation of the spinal motor neurons, which are in the ventral horn, indirectly via reflexive pathways (Figure 2). These motor reflexive responses can be recorded in the muscles using EMG [6], [10].
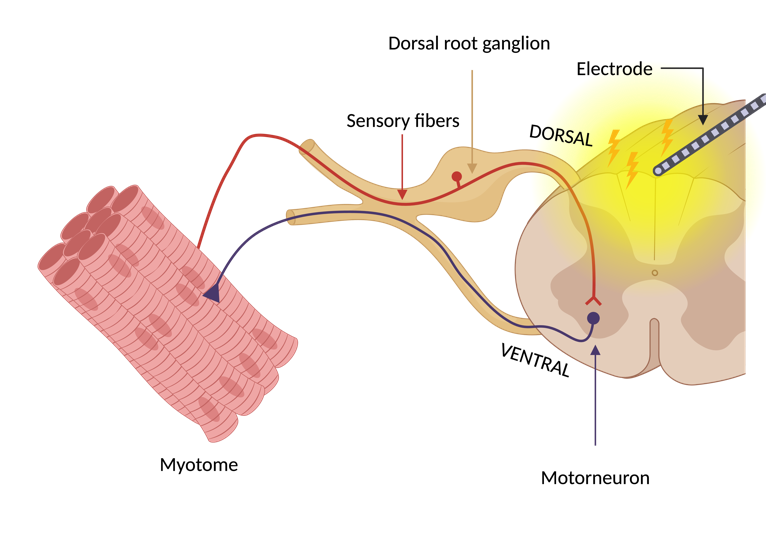
Figure 2. Reflex pathway leading to indirect motor neuron activation due to SCS. This approach leads to myotome-specific muscle responses. Figure made with BioRender.
Electrode Placement Matters.
The precise placement of electrodes in the epidural space is essential for maximizing the therapeutic effectiveness of SCS [11]. This specificity directly influences the stimulation’s ability to target individual dorsal roots that correlate with specific myotomes [3],[4]. They are linked to motor neurons located in spinal cord enlargements that innervate the upper and lower limbs [12]. The lumbosacral enlargement ranges from the 11th thoracic to the sacral vertebral levels, innervating the legs.
Myotomes are anatomical regions where individual spinal nerves correspond to motor function in specific muscles. For example, the lumbar spinal nerves typically control muscles associated with hip flexion, knee extension and planter flexion of the ankle [13]. During intraoperative mapping, stimulation of dorsal spinal roots within the lumbosacral enlargement helps determine which myotomes are activated by specific electrode positions. This mapping process ensures targeted activation of motor neurons and muscle groups, which is critical for improving functional outcomes, such as locomotion or spasticity management.
Previous studies have demonstrated that stimulation of dorsal spinal roots can predict corresponding myotomes based on the anatomical placement of electrode arrays [10],[14]. A statistical model was then used to correlate EMG data to a population model of stimulated spinal cord levels. A key conclusion was that the selectivity of the motor neuron pool activated by SCS can predict corresponding myotomes, providing a more systematic and precise approach for electrode placement based on the anatomical positioning of the electrode arrays [10].
Problems analyzing X-ray images
X-ray fluoroscopy is used intraoperatively to guide the SCS electrodes to spinal locations that offer the most therapeutic relief for patients. This imaging technique is favored for providing real-time visualization of electrode position. However, X-ray analysis poses several challenges that limit its effectiveness for precise anatomical localization.
X-rays provide two-dimensional depictions of complex three-dimensional anatomy, which causes a loss of depth information and leads to the overlap of structures such as vertebrae, soft tissues, and implants. There is also limited contrast for soft tissues such as muscles and nerves, making it difficult to differentiate them from the surrounding anatomical background. However, spinal electrodes are typically made from platinum or platinum-iridium. These materials have radiopaque properties that cause distinct diffraction patterns, resulting in high contrast on X-ray fluoroscopy [15]. As a result, electrodes are relatively easy to identify on X-ray images.
Anatomical variation among patients adds another layer of complexity. Differences in vertebral size, curvature, and alignment due to age, injury, or prior surgery make it more difficult to apply consistent localization methods across individuals. Furthermore, X-ray fluoroscopy image quality may be affected by artifacts such as motion blur, scatter from metallic implants, and high noise levels, especially in intraoperative imaging environments [16].
Interpretation of X-ray images is generally carried out manually by trained clinicians. However, this process remains inherently subjective and is often influenced by differences in clinical interpretation, which limits its reliability in identifying subtle anatomical details and ensuring consistent results across patients [17].
Convolution Neural Networks in Medical Image processing.
To overcome these challenges, advances in automating electrode identification will utilize Convolutional Neural Networks (CNNs). CNNs are deep learning algorithms used to process and analyze visual data. CNN architecture is inspired by neocognitron, which is a neural network originally designed to simulate the visual processing observed in the human visual cortex [18], [19]. This makes CNNs powerful for medical image-related tasks such as classification, detection, and segmentation. CNNs are designed to automatically learn hierarchical representations of features from raw input data, including patterns, textures, and shapes [20], [21].
CNNs have been widely applied in biomedical imaging to support diagnostic tasks that require accurate image interpretation. In one study, CNNs were used to analyze X-ray images for the purpose of enhancing spine segmentation in patients with scoliosis [22]. A U-Net was used to achieve pixel-level segmentation of spinal structure.
The U-Net architecture is a type of CNN that has been commonly used in X-ray image segmentation because of its symmetric encoder and decoder paths, which enable both precise localization and feature extraction (Figure 3)[23]. The encoder extracts feature through repeated applications of convolutions with Rectified Linear Unit (ReLU) activations and max-pooling operations. This process captures semantic information while reducing spatial dimensions.
The decoder then reconstructs the original image resolution by applying up-convolution layers and integrating features from corresponding encoder layers using copy-and-crop operations. The final segmentation map is generated through a 1×1 convolution layer, which assigns class labels to each pixel.
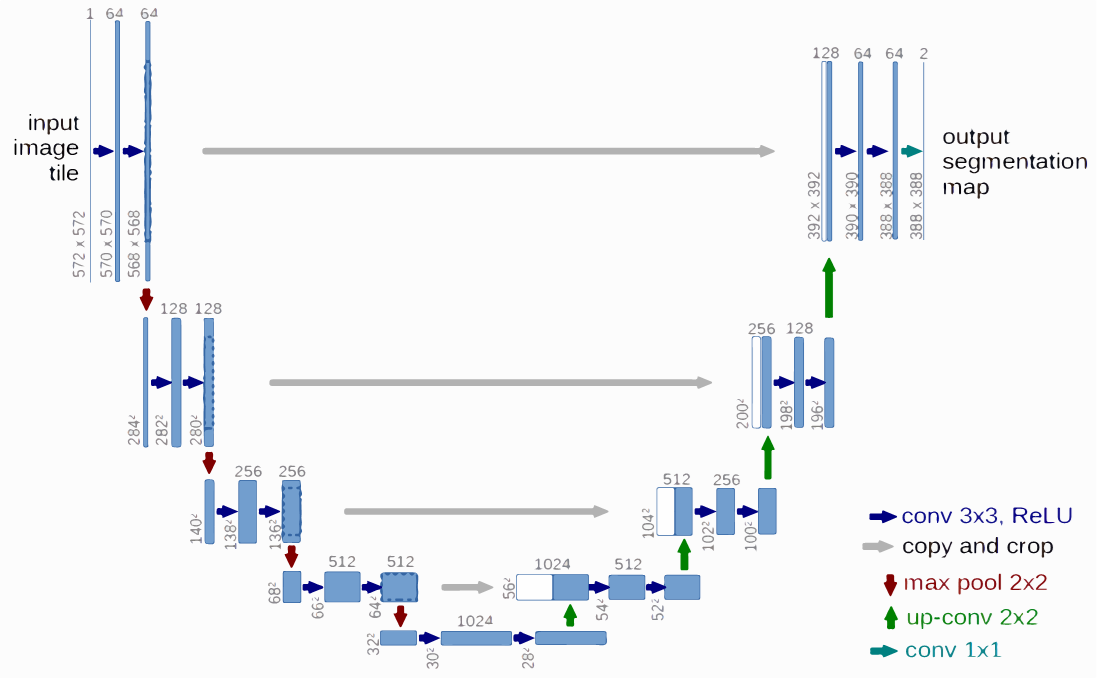
Figure 3. The U-Net architecture for X-ray image segmentation, showing the symmetric encoder (downstream path) and decoder (upstream path) used for feature extraction [23].
The U-Net architecture is particularly well suited for segmenting complex anatomical structures in X-ray images due to its ability to integrate high-resolution spatial features with deep semantic representations. This capability allows the network to maintain fine structural detail while understanding broader contextual patterns. As a result, U-Net can support accurate segmentation of vertebrae and SCS electrodes, even in low-contrast X-ray images.
Methods
Dataset Generation
Under an approved IRB protocol (IRB_00072431), a retrospective search was conducted to identify patients who had undergone an SCS implant procedure between 2014 – 2024. Electronic health records, imaging archives, and clinical notes were reviewed to verify eligibility. A total of 2,075 patients were initially screened. From this group, 210 anterior-posterior (AP) fluoroscopic X-ray images were selected based on visibility of electrode arrays and vertebrae between vertebral levels T7 and S2. Patients ranged in age from 18 to 85 years and included those with chronic pain or muscle spasticity. Patients were excluded if they had dorsal root ganglion or sacral implants, spinal fixation hardware in the region of interest, or poor-quality images.
Image Preprocessing
All selected images were anonymized and preprocessed using MATLAB R2024a. Images were resized and center-cropped to a resolution of 512 × 512 pixels while maintaining aspect ratio. Histogram equalization was applied to enhance contrast, particularly around vertebral structures, and implanted electrodes.
Annotation and Data Augmentation
Manual pixel-level annotations were completed using MATLAB’s Image Labeling App. Vertebrae (T7–L5) and electrodes were labeled as separate classes. A standardized protocol was followed for consistency, and all annotations were reviewed by a second annotator.
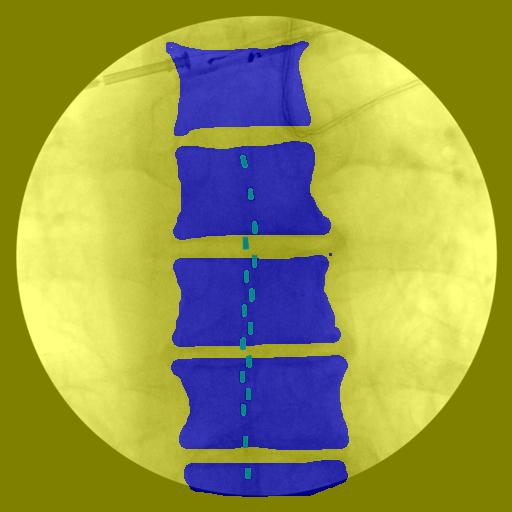
Figure 4. Manual pixel-level annotations were performed to label vertebrae and electrodes, with each class assigned a distinct color for segmentation. The background class included all remaining pixels that did not correspond to vertebrae or electrodes.
Following annotation, data augmentation was applied to increase dataset diversity. Augmentation methods included random vertical and horizontal translations, random rotations, and center cropping. The resulting dataset was expanded from 209 annotated images to 624 image-label pairs. These augmented images were used to form the ground truth dataset for training and evaluation.
U-Net Architecture and Model Training
A U-Net architecture was used for multi-class image segmentation. The encoder path consisted of four down sampling blocks, each containing two 3×3 convolutional layers with ReLU activations followed by 2×2 max-pooling operations. The decoder path included four up sampling blocks using transposed convolutions and skip connections from the corresponding encoder layers via copy-and-crop operations. A 1×1 convolution was used at the output layer to generate the final segmentation map. A SoftMax activation function was applied to enable multi-class prediction.
The network was implemented in MATLAB trained using the Adam optimizer with a learning rate of 1 × 10⁻³. A mini-batch size of 64 was used, and training was carried out for up to 40 epochs. The training data were shuffled at the start of each epoch. A custom output function was implemented to monitor performance and apply early stopping when necessary. The dataset was split into 80% training (n = 499) and 20% testing (n = 125).
Evaluation Metrics
Model performance was evaluated using several metrics: Dice coefficient, Intersection over Union (IoU), pixel accuracy, precision, and recall. Additional metrics included global accuracy, mean accuracy, mean IoU, weighted IoU, and the mean boundary F1-score (BF Score). These metrics were calculated for the entire image and for individual classes, including background, vertebrae, and electrodes. A confusion matrix was generated to assess misclassification trends across classes and overall accuracy.
(1) Dice Coefficient (DSC)
Measures the overlap between the predicted and ground truth masks
\[DSC = \frac{2\times |A\cup B|}{|A|+|B|}\]
where A is the predicted segmentation mask and B is the ground truth mask.
(2) Intersection over Union (IoU)
Evaluates the ratio of intersection to union between the predicted and ground truth masks
\[IoU = \frac{|A\cap B|}{|A\cup B|}\]
(3) Global Accuracy (GA)
Measures the overall proportion of correctly classified pixels
\[GA = \frac{\sum{TP}+\sum{TN}}{\sum{TP}+\sum{TN}+\sum{FP}+\sum{FN}}\]
where TP is the number of true positives, TN is the number of true negatives, FP is the number of false positives, and FN is the number of false negatives.
(4) Mean Accuracy (MA)
Computes the average accuracy per class
\[MA = \frac{1}{n}\,\sum_{i=1}^{n}\,\frac{TP_i}{TP_i+FN_i}\]
where n is the number of classes and $i$ is the index of a specific class.
(5) Mean IoU (M IoU)
Calculates the average IoU across all classes
\[MIoU = \frac{1}{n}\,\sum_{i=1}^{n}\,\frac{TP_i}{TP_i+FP_i+FN_i}\]
(6) Weighted IoU (W IoU)
Computes a class-weighted IoU that accounts for class imbalances:
\[WIoU = \frac{\sum_{i=1}^{n},w_i\cdot IoU_i}{\sum_{i=1}^{n},w_i}\]
where wi is the weight assigned to each class and IoU.
(7) Mean Boundary F1-Score (Mean BF Score)
Evaluates the segmentation quality at object boundaries by comparing the predicted and ground truth contours
\[BF=\frac{2\times Precision \times Recall}{Precision+Recall}\]
Results
The U-Net model was trained and evaluated on a dataset of 624 fluoroscopic X-ray images for segmentation of spinal vertebrae and SCS electrodes. Segmentation performance was assessed using standard pixel-wise classification metrics, including accuracy, intersection over union (IoU), and boundary precision.
Network Performance
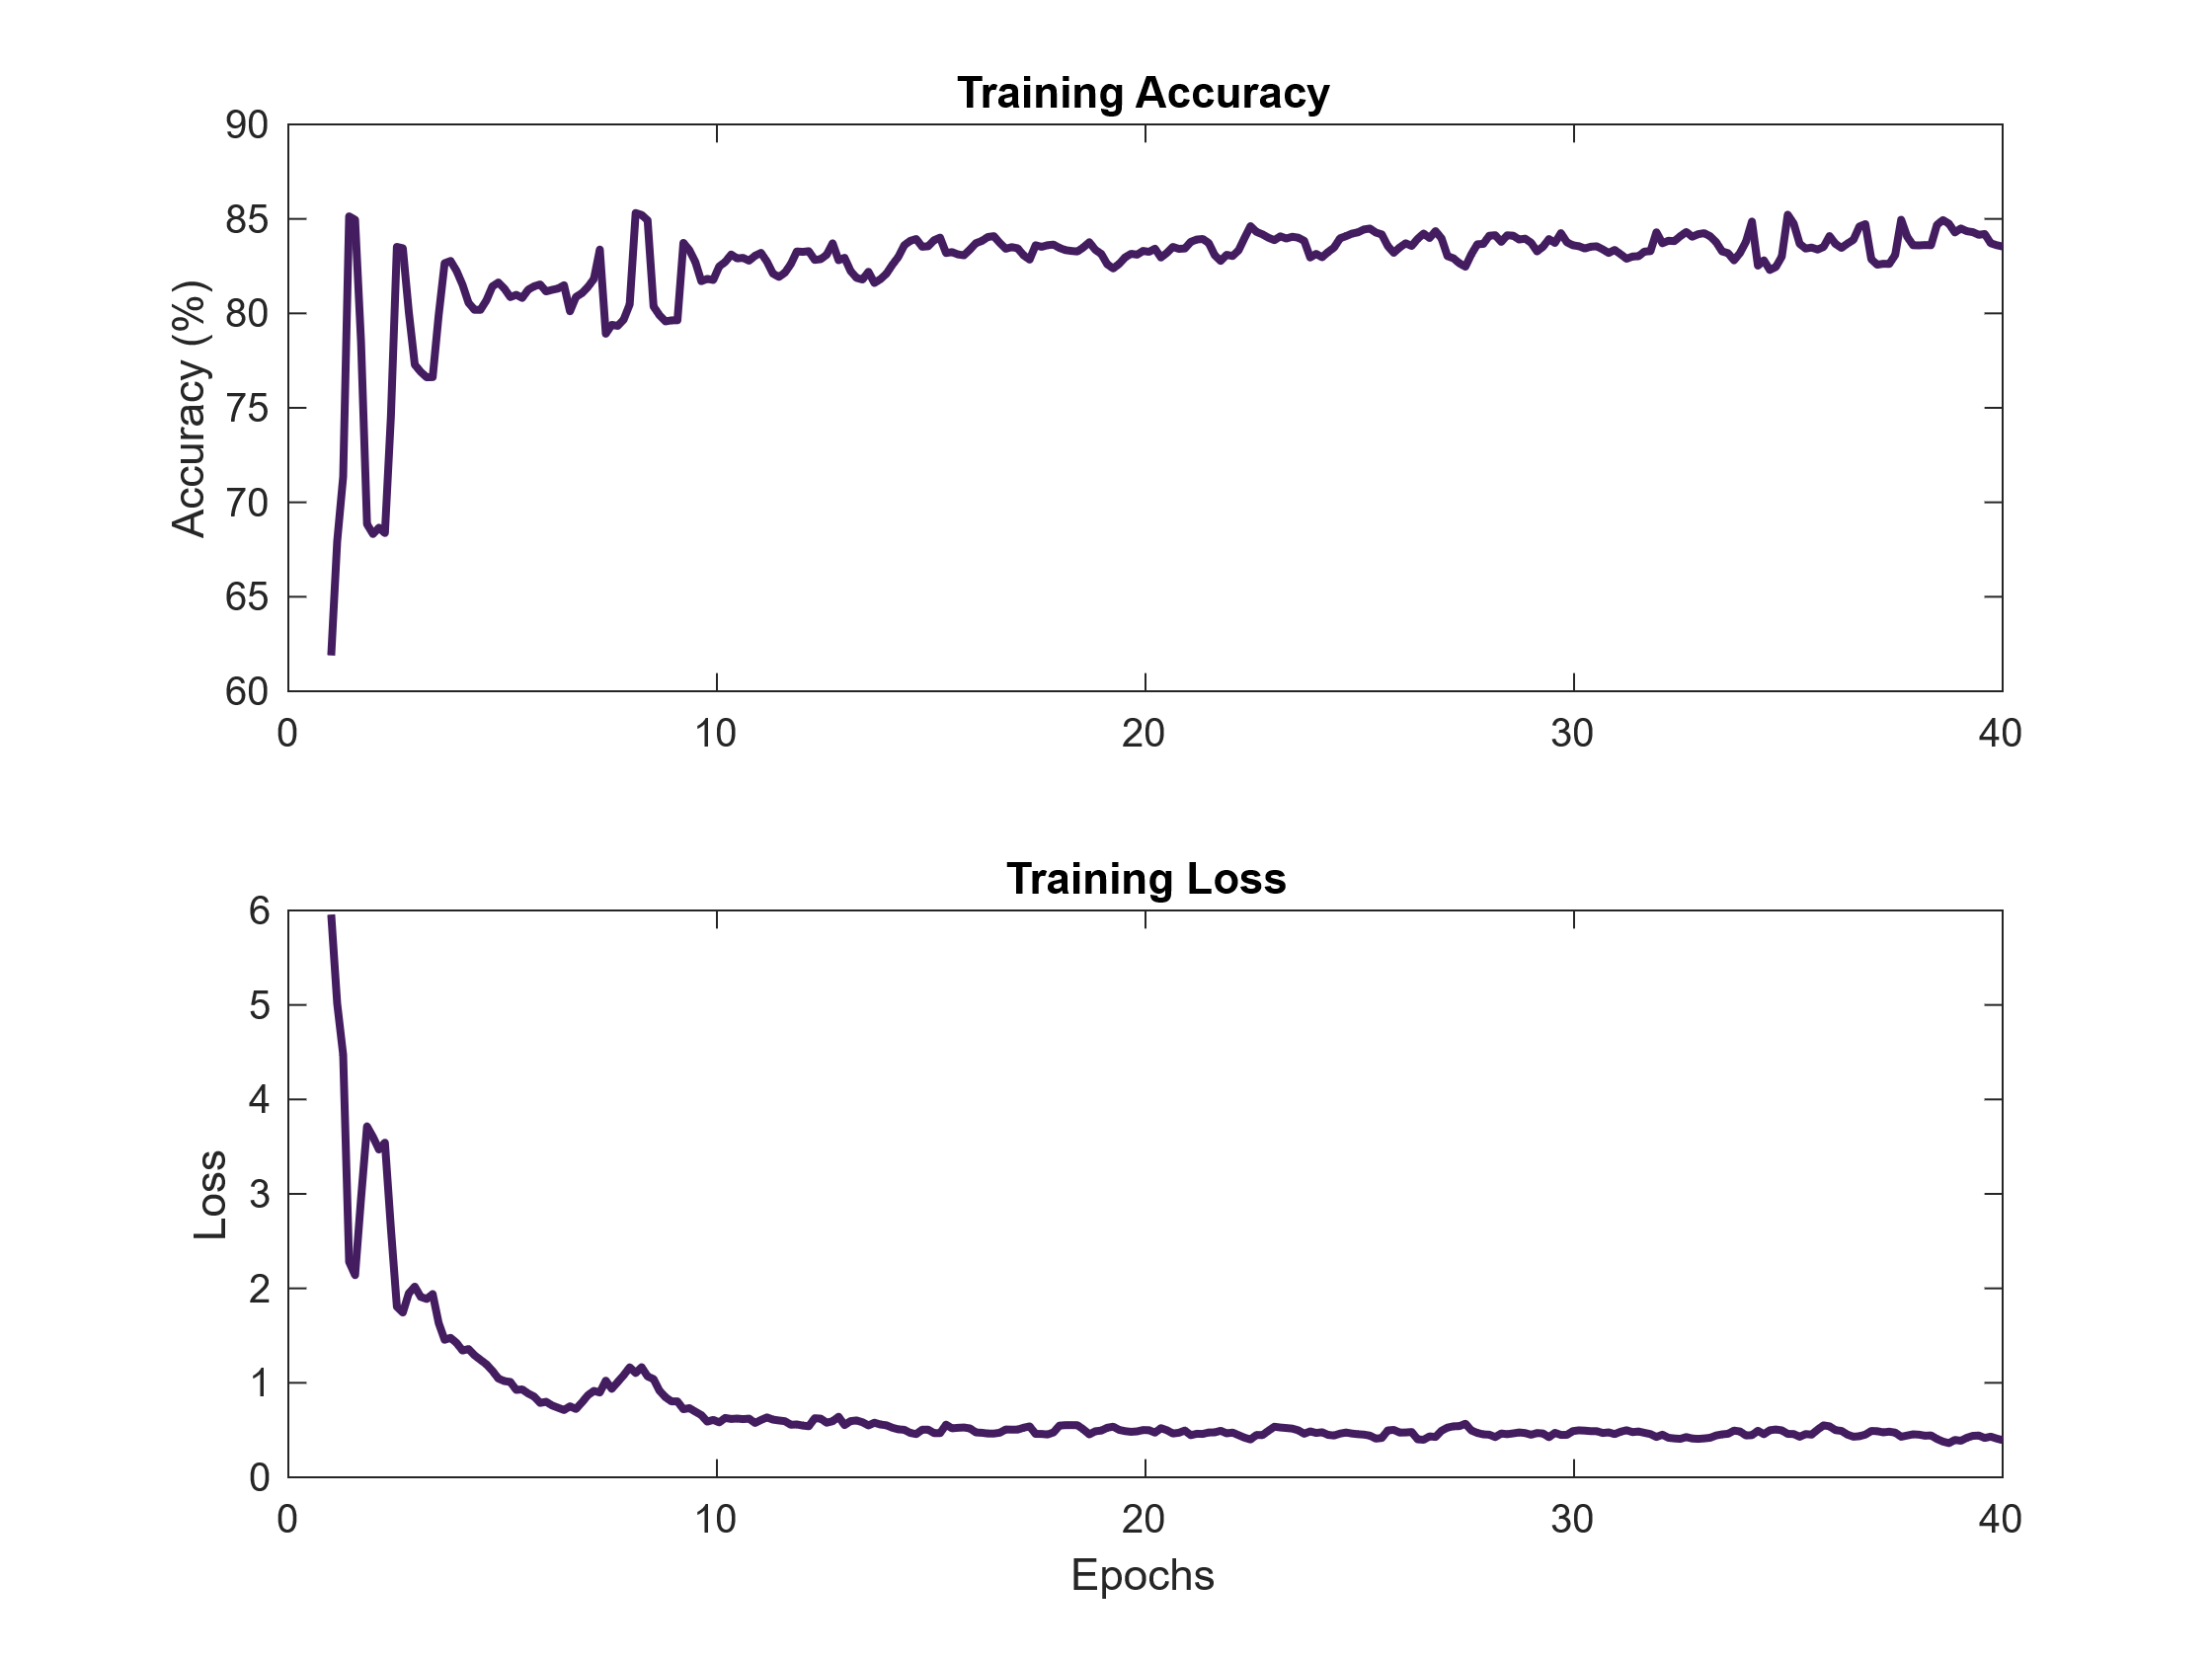
Figure 5. Training accuracy and loss curves over 40 epochs. The U-Net model demonstrated consistent learning behavior, with increasing accuracy and decreasing loss indicating proper convergence during training.
Model convergence during training was monitored using accuracy and loss curves over 40 epochs. As shown in Figure 5, training accuracy increased and stabilized at 83.9%, while loss decreased steadily and plateaued at 0.51. This trend suggests effective learning without signs of overfitting, as there were no sharp fluctuations or divergence in performance throughout training.
Segmentation Output and Qualitative Results
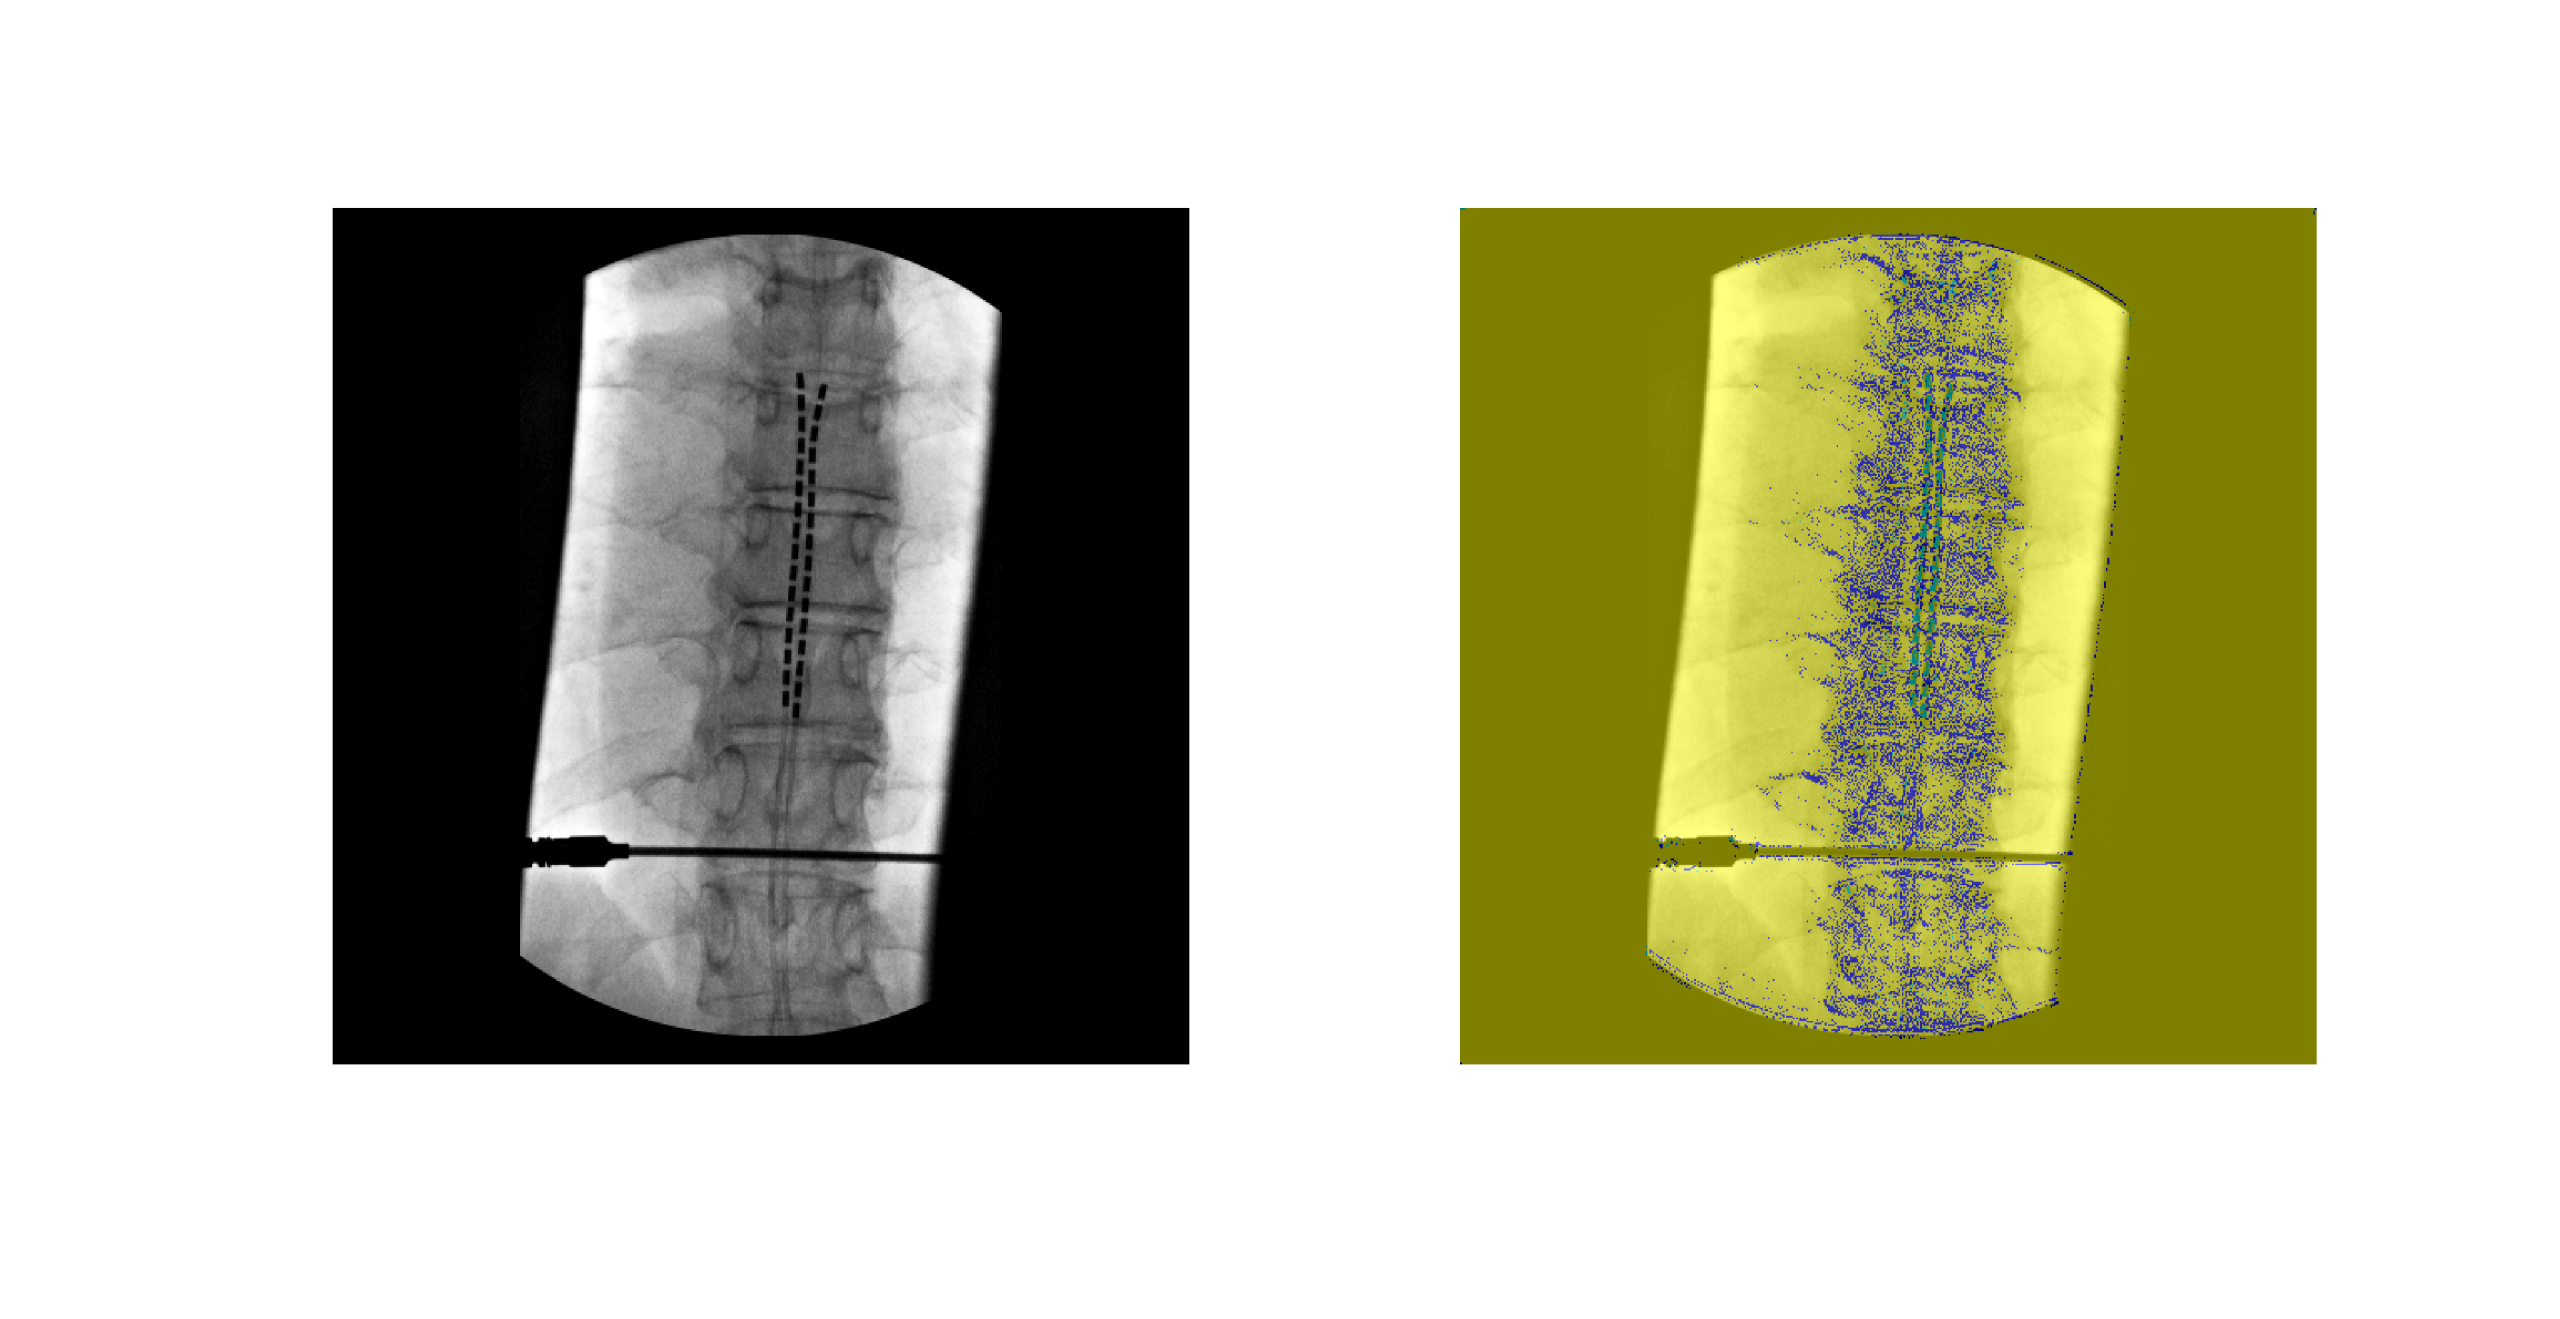
Figure 6. Example of input X-ray image (left) and corresponding U-Net output segmentation (right). Vertebrae (blue) and electrodes (green) are segmented from background pixels and visualized in different color classes.
The U-Net model successfully produced segmentation masks identifying the local region of vertebral column and electrode locations in the X-ray images. An example of the input-output comparison is shown in Figure 6, where vertebrae and electrodes are accurately identified despite challenges such as overlapping anatomical features and varying contrast. Visual inspection indicates overall poor segmentation due to patchy appearance of segmented mask.
Overall Segmentation Performance
Table 1: Overall segmentation performance metrics of the U-Net model, including global accuracy, mean accuracy, mean IoU, weighted IoU, and mean boundary F1-score (BF Score).
|
Metric |
Value (%) |
|
Global Accuracy |
83.924 |
|
Mean Accuracy |
37.168 |
|
Mean IoU |
31.92
|
|
Weighted IoU |
73.85 |
|
Mean Boundary F1-Score |
28.215 |
Quantitative metrics for model performance are presented in Table 1. The model achieved a global accuracy of 83.92%, indicating strong overall pixel-wise classification. However, mean accuracy and mean IoU were lower at 37.17% and 31.92%, respectively. This reflects class imbalances between the dominant class group and smaller anatomical targets. A weighted IoU of 73.85% further highlights the model’s bias toward larger classes. The mean boundary F1-score (BF Score) was 28.21%, suggesting limited precision at object boundaries.
Class-Specific Performance
Table 2. Class-specific evaluation metrics for background, vertebrae, and electrodes. Metrics include class accuracy, IoU, and boundary F1-score.
|
Class |
Accuracy (%) |
IoU (%) |
Mean BF (%) |
|
Background |
94.86 |
83.76 |
41.84 |
|
Vertebrae |
14.77 |
11.23 |
33.19 |
|
Electrodes |
1.85 |
0.76 |
9.87 |
Class-wise metrics are shown in Table 2. The background class achieved the highest accuracy (94.86%) and IoU (83.76%), confirming that the model performs well in identifying background. In contrast, segmentation of vertebrae and electrodes was more difficult. Vertebrae reached 14.77% accuracy and 11.23% IoU, while electrodes had the lowest performance, with only 1.85% accuracy and 0.76% IoU.
Confusion Matrix Analysis
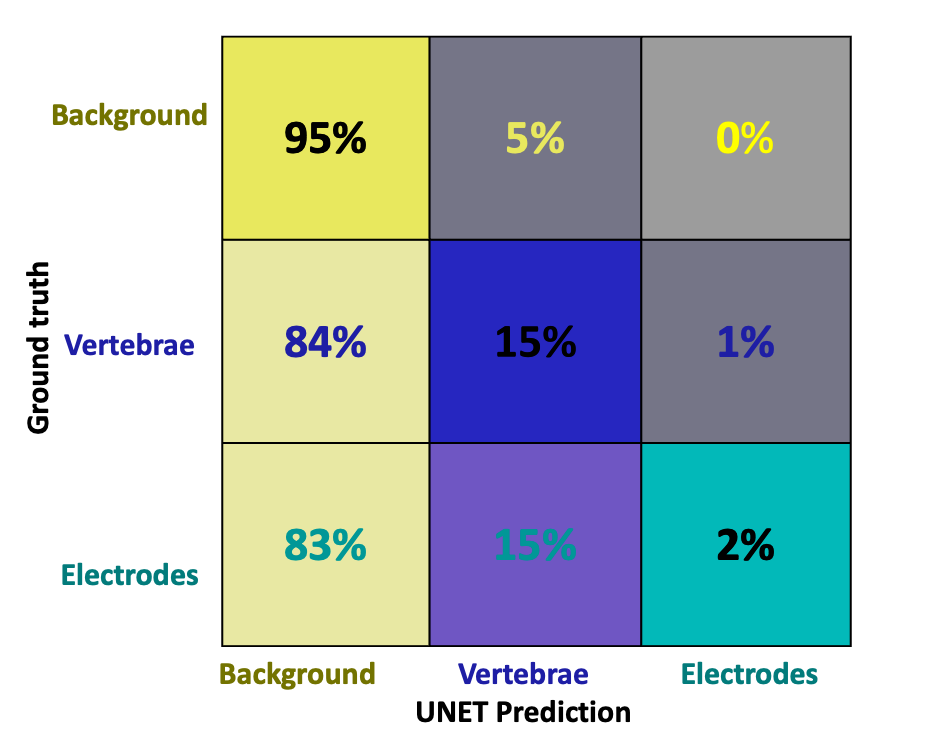
Figure 7. Confusion matrix showing classification performance across background, vertebrae, and electrode classes. Correct classifications are located along the diagonal, while off-diagonal values represent misclassifications between predicted and true labels based on manual annotation.
A confusion matrix in Figure 7 illustrates the model’s difficulty in distinguishing vertebrae and electrodes from the background. Most misclassifications occurred in these two classes, consistent with the observed drop in IoU and class accuracy metrics.
Discussion
SCS has shown significant potential for improving mobility in individuals with motor impairments [24] but the success of this therapy heavily depends on precise electrode placement. Surgeons currently use imaging guidance combined with trial-and-error methods to find the best location for electrode implantation. Manual electrode localization during SCS implantation is time-consuming, subjective, and prone to variability [25],[8]. Recognizing these problems, a U-Net segmentation model was trained on manually annotated X-ray images to automate the detection of electrode and vertebral structures with pixel-level precision.
Model performance of the U-Net was evaluated using both quantitative metrics and qualitative analysis. As shown in Figure 5, the model demonstrated stable learning behavior, with training accuracy steadily increasing and loss decreasing over the course of 40 epochs. The final training accuracy reached 83.9%, while the loss converged to 0.51, indicating effective model convergence.
Early-stage oscillations in accuracy, particularly during the first 10 epochs. These fluctuations are normal during training and occur due to the model adjusting its learning rate as it encounters newer images in the dataset in each batch [26]. After this initial phase, both accuracy and loss curves stabilized, suggesting that the model had learned meaningful features and was no longer underfitting or overfitting. The absence of sharp spikes and the smooth plateau observed in both curves confirm that the U-Net architecture was able to extract what it thought were relevant features consistently during training [27].
Figure 6 presents an example of a raw input X-ray alongside the model’s segmentation output. The vertebrae and electrodes were correctly identified in their respective regions despite the overlapping of the electrodes over the vertebrae. The clear separation of classes visually confirms the model’s ability to globally localize the object. This qualitative result aligns with previous findings in medical imaging, where U-Net-based architectures have been successfully used to segment only the cervical vertebrae from lateral X-ray images [28].
Quantitative results in Table 1 show that the U-Net achieved a global accuracy of 83.92%, which suggests that the model performed well overall in pixel classification. However, mean accuracy (37.17%) and mean IoU (31.92%) were substantially lower, indicating uneven performance across classes. The higher weighted IoU (73.85%) reveals a class imbalance skewed in favor of the background class, which comprised the greatest number of the pixels. The mean boundary F1-score (28.21%) further shows limited performance in capturing precise object boundaries, especially for small structures like electrodes.
Table 2 reveals class-specific segmentation performance. The background class achieved the highest performance, with 94.86% accuracy and 83.76% IoU, confirming that the model effectively ignored irrelevant structures and distinguished between target and non-target regions. The model was also able to exclude medical tools, such as SCS insertion needles, which occasionally appeared in the field of view. In contrast, vertebrae segmentation had reduced performance, with 14.77% accuracy and 11.23% IoU, likely due to variable vertebral shapes and overlapping structures. Electrode segmentation had the lowest performance, achieving only 1.85% accuracy and 0.76% IoU. This decline in performance can be attributed to the small size of electrodes, which are comprised of a fewer number of pixels and are therefore more difficult for the model to detect reliably. In addition, the limited number of annotated training examples further reduced the network’s ability to generalize. These observations are consistent with known challenges in segmenting small, low-contrast targets in medical imaging, which often require specialized architectures or targeted loss functions to improve model sensitivity [29].
The confusion matrix shown in Figure 7 highlights the model’s tendency to misclassify pixels as background, reflecting the class imbalance and difficulty in distinguishing the smaller electrodes and vertebrae. This pattern is consistent with prior findings where CNNs have struggled to segment small spinal components from X-ray fluoroscopy images [30]. This further explains the low mean accuracy and electrode-specific scores reported in Tables 1 and 2.
Limitation
This study has several limitations that may have affected model performance and generalizability. The dataset included 209 manually annotated X-ray images. Although augmentation tripled the dataset to 624 images, the process was performed using static augmentation, where modified images were generated ahead of training. While this helped increase the number of training samples, static augmentation shows the model the same transformed images repeatedly. This can limit variability, reduce robustness, and increase the risk of overfitting. In contrast, real-time augmentation applies random transformations during training. This approach creates more diverse image inputs and has been shown to improve generalization and model performance [31].
Manual pixel-level annotation introduced another challenge. While necessary to create accurate ground truth masks, this process is time-consuming and can introduce variability in labeling, especially in low-contrast regions. Although each annotation was reviewed for consistency, observer variation could still affect label accuracy. Future improvements could include semi-automated labeling tools to increase consistency and efficiency.
Another important limitation was the use of 2D anterior-posterior X-ray images. These images do not provide depth information, making it difficult to localize electrodes in three-dimensional space. Overlapping anatomical structures and the low contrast typical of X-rays further complicate the segmentation task. Although this 2D approach was selected with future applications in mind, it inherently limits segmentation precision.
Future Work
Despite these limitations, the project demonstrates the potential for using machine learning to automatically identify electrodes and vertebrae in X-ray fluoroscopic spinal images. Building on this foundation, several key areas can be targeted for future work. One priority is to increase the size and diversity of the dataset. A larger dataset will improve the model’s ability to generalize across different patient anatomies, imaging conditions, and electrode placements. This will also help address the class imbalance that affected electrode and vertebrae segmentation accuracy.
A major upgrade involves adopting nnU-Net architecture, which is a self-configuring deep learning framework developed specifically for biomedical image segmentation. Unlike traditional U-Net implementations, nnU-Net automatically adapts its own architecture, preprocessing steps, and training parameters based on the input data [32]. It also incorporates adaptive augmentation techniques during training, helping the model learn from a more varied set of transformations and reducing overfitting. By tailoring itself to the characteristics of the dataset, nnU-Net can directly address several of the challenges identified in this study, including static augmentation, poor sensitivity to small structures, and architectural limitations.
Significance
The trained U-Net segmentation model developed in this study will be an essential tool for future intraoperative testing during SCS procedures. By recording leg muscle activity using (EMG), we will be able to correlate the anatomical position of the segmented electrodes with specific patterns of lower-limb muscle activation. This will enable the automated construction of a functional map that links spinal stimulation sites with evoked muscle responses. Such a tool has significant potential to improve the precision and efficiency of SCS implantation, especially for locomotor rehabilitation applications. Rather than relying on trial-and-error methods to identify effective stimulation sites, clinicians will be able to use this functional map to guide electrode placement based on predicted muscle outcomes. This can reduce operating time, minimize repositioning, and enhance therapeutic results.
As SCS becomes increasingly available as a neuromodulation therapy for motor recovery, the demand for automated, personalized tools that bridge imaging with functional data will continue to grow. This model application offers a scalable solution that can help both researchers and clinicians generate patient-specific activation maps of leg muscles, paving the way for more effective and targeted neurorehabilitation strategies.
References
[1] R. Lapointe, Y. Lajoie, O. Serresse, & H. Barbeau, “Functional community ambulation requirements in incomplete spinal cord injured subjects,” Spinal Cord, vol. 39, no. 6, pp. 327–335, Jun. 2001, doi: 10.1038/sj.sc.3101167.
[2] J. Caylor, Reddy, R., Yin, S., Cui, C., Huang, M., Huang, C. Rao, R., Baker, D.G., Simmons, A., Souza, D., Narouze, S., Vallejo, R., & Lerman, I., “Spinal cord stimulation in chronic pain: evidence and theory for mechanisms of action,” Bioelectron Med, vol. 5, p. 12, Jun. 2019, doi: 10.1186/s42234-019-0023-1.
[3] A. Rowald, Komi, S., Demesmaeker, R, Baaklini, E., Hernandez-Charpak, S.D., Paoles, E., Montanaro, H., Cassara,A., Becce, F., Lloyd, B., Bewton, T., Ravier, J., Kinany, N., D’Ercole, M., Paley, A., Hankov, N., Varescon, C., McCracken, L., Vat, M., Caban, M., Watrin, A., Jacquet, C., Bole-Feysot, L., Harte, C., & Courtine, G., “Activity-dependent spinal cord neuromodulation rapidly restores trunk and leg motor functions after complete paralysis,” Nat Med, vol. 28, no. 2, pp. 260–271, Feb. 2022, doi: 10.1038/s41591-021-01663-5.
[4] F. B. Wagner, J.-B. Mignardot, C. G. Le Goff-Mignardot, R. Demesmaeker, S. Komi, M. Capogrosso, A. Rowald, I. Seáñez, M. Caban, E. Pirondini, M. Vat, L. A. McCracken, R. Heimgartner, I. Fodor, A. Watrin, P. Seguin, E. Paoles, K. Van Den Keybus, G. Eberle, B. Schurch, E. Pralong, F. Becce, J. Prior, N. Buse, R. Buschman, E. Neufeld, N. Kuster, S. Carda, J. von Zitzewitz, V. Delattre, T. Denison, H. Lambert, K. Minassian, J. Bloch, and G. Courtine, “Targeted neurotechnology restores walking in humans with spinal cord injury,” Nature, vol. 563, no. 7729, pp. 65–71, Nov. 2018, doi:10.1038/s41586-018-0649-2.
[5] M. L. Gill, P. J. Grahn, J. S. Calvert, M. B. Linde, I. A. Lavrov, J. A. Strommen, L. A. Beck, D. G. Sayenko, M. G. Van Straaten, D. I. Drubach, D. D. Veith, A. R. Thoreson, C. Lopez, Y. P. Gerasimenko, V. R. Edgerton, K. H. Lee, and K. D. Zhao, “Neuromodulation of lumbosacral spinal networks enables independent stepping after complete paraplegia,” Nat. Med., vol. 24, no. 11, pp. 1677–1682, Nov. 2018; Publisher Correction, vol. 24, no. 12, p. 1942, Dec. 2018, doi:10.1038/s41591-018-0175-7 / 10.1038/s41591-018-0248-7.
[6] Dalrymple, A.N., Bose, R., Sarma, D., Petersen, B.A., Barra, B., Nanivadekar, A.C., Madonna, T.J., Liu, M.F., Levy, I., Helm, E.R., Miele, V.J., Capogrosso, M., Fisher, L.E., & Weber, D.J. (2023). Reflex modulation and functional improvements following spinal cord stimulation for sensory restoration after lower-limb amputation. medRxiv.
[7] C. A. Angeli, M. Boakye, R. A. Morton, J. Vogt, K. Benton, Y. Chen, C. K. Ferreira, and S. J. Harkema, “Recovery of Over‑Ground Walking after Chronic Motor Complete Spinal Cord Injury,” N. Engl. J. Med., vol. 379, no. 13, pp. 1244–1250, Sep. 27, 2018, doi:10.1056/NEJMoa1803588.
[8] A. Delmotte, L. Jacques, K. Kumar, K. Poon, O. Monlezun, M. Roulaud, A. Prevost, R. Munson, F. Guetarni, B. Bataille, and P. Rigoard, “The Franco‑Canadian multicolumn spinal cord stimulation prospective study: A subgroup analysis focusing on the decisive role of lead positioning,” Neurochirurgie, vol. 61, Suppl. 1, pp. S83–S89, Mar. 2015, doi:10.1016/j.neuchi.2014.06.005.
[9] A. Gupta, N. Vardalakis, and F. B. Wagner, “Neuroprosthetics: from sensorimotor to cognitive disorders,” Commun Biol, vol. 6, no. 1, pp. 1–17, Jan. 2023, doi: 10.1038/s42003-022-04390-w.
[10] U. S. Hofstoetter, S. M. Danner, B. Freundl, H. Binder, W. Mayr, F. Rattay, and K. Minassian, “Periodic modulation of repetitively elicited monosynaptic reflexes of the human lumbosacral spinal cord,” J. Neurophysiol., vol. 114, no. 1, pp. 400–410, Jul. 2015, doi:10.1152/jn.00136.2015.
[11] C. M. Schirmer, J. L. Shils, J. E. Arle, G. R. Cosgrove, P. K. Dempsey, E. Tarlov, S. Kim, C. J. Martin, C. Feltz, M. Moul, and S. Magge, “Heuristic map of myotomal innervation in humans using direct intraoperative nerve root stimulation,” J. Neurosurg. Spine, vol. 15, no. 1, pp. 64–70, Jul. 2011, doi:10.3171/2011.2.SPINE1068.
[12] J. T. Kaiser and J. G. Lugo-Pico, “Neuroanatomy, Spinal Nerves,” in StatPearls, Treasure Island (FL): StatPearls Publishing, 2024. Accessed: Sep. 15, 2024. [Online]. Available: http://www.ncbi.nlm.nih.gov/books/NBK542218/
[13] N. Bogduk, “The Innervation of the Lumbar Spine,” Spine, vol. 8, no. 3, p. 286, Apr. 1983.
[14] S. Hashimoto, T. Murohashi, S. Yamada, N. Iesato, I. Ogon, M. Chiba, A. Tsukamoto, R. Hitrota, and M. Yoshimoto, “Broad and Asymmetric Lower Extremity Myotomes: Results from Intraoperative Direct Electrical Stimulation of the Lumbosacral Spinal Roots,” Spine (Phila Pa 1976), vol. 49, no. 11, pp. 805–810, Jun. 1, 2024, doi:10.1097/BRS.0000000000004737.
[15] M. Ekielski, W. Głowadzka, K. Bogdanowicz, M. Rygała, M. Mikulicz, P. Śpiewak, M. Kowalski, M. Gębski, M. Motyka, A. Szerling, T. Czyszanowski, Monolithic High Contrast Grating Integrated with Metal: Infrared Electrode with Exceptionally High Conductivity and Transmission. Adv. Funct. Mater. 2024, 34, 2312392. https://doi.org/10.1002/adfm.202312392
[16] Lee, H. W., Lim, H. W., Jeon, D. H., Park, C. K., Lee, D. Y., Cho, H. S., Seo, C. W., Kim, K. S., Kim, G. A., Park, S. Y., Kang, S. Y., Park, J. E., Kim, W. S., Lim, Y. H., & Woo, T. H. (2018). Eliminating artifacts in single-grid phase-contrast x-ray imaging for improving image quality. Computers in biology and medicine, 97, 74–82. https://doi.org/10.1016/j.compbiomed.2018.04.013
[17] Q. Liu, Y. Han, L. Shen, J. Du, and M. H. Tania, “Adaptive enhancement of shoulder x-ray images using tissue attenuation and type-II fuzzy sets,” PLoS One, vol. 20, no. 2, p. e0316585, Feb. 2025, doi: 10.1371/journal.pone.0316585.
[18] K. Fukushima, “Analysis of the process of visual pattern recognition by the neocognitron,” Neural Networks, vol. 2, no. 6, pp. 413–420, Jan. 1989, doi: 10.1016/0893-6080(89)90041-5.
[19] S.-C. B. Lo, H.-P. Chan, J.-S. Lin, H. Li, M. T. Freedman, and S. K. Mun, “Artificial convolution neural network for medical image pattern recognition,” Neural Networks, vol. 8, no. 7, pp. 1201–1214, Jan. 1995, doi: 10.1016/0893-6080(95)00061-5.
[20] R. Yamashita, M. Nishio, R. K. G. Do, and K. Togashi, “Convolutional neural networks: an overview and application in radiology,” Insights Imaging, vol. 9, no. 4, pp. 611–629, Aug. 2018, doi: 10.1007/s13244-018-0639-9.
[21] S. M. Anwar, M. Majid, A. Qayyum, M. Awais, M. Alnowami, and M. K. Khan, “Medical Image Analysis using Convolutional Neural Networks: A Review,” J Med Syst, vol. 42, no. 11, p. 226, Oct. 2018, doi: 10.1007/s10916-018-1088-1.
[22] S. Sacharisa and I. Kartowisastro, “Enhanced Spine Segmentation in Scoliosis X-ray Images via U-Net,” Ingénierie des systèmes d information, vol. 28, Aug. 2023, doi: 10.18280/isi.280427.
[23] O. Ronneberger, P. Fischer, and T. Brox, “U-Net: Convolutional Networks for Biomedical Image Segmentation,” in Medical Image Computing and Computer-Assisted Intervention – MICCAI 2015, N. Navab, J. Hornegger, W. M. Wells, and A. F. Frangi, Eds., Cham: Springer International Publishing, 2015, pp. 234–241. doi: 10.1007/978-3-319-24574-4_28.
[24] M. M. Iversen, A. T. Harrison, C. T. Stanley, and A. N. Dalrymple, “Rehabilitation of Motor and Sensory Function Using Spinal Cord Stimulation: Recent Advances,” Current Opinion in Biomedical Engineering, p. 100566, Oct. 2024, doi: 10.1016/j.cobme.2024.100566.
[25] Capogrosso, M., Wenger, N., Raspopovic, S., Musienko, P., Beauparlant, J., Bassi Luciani, L., Courtine, G., & Micera, S. (2013). A computational model for epidural electrical stimulation of spinal sensorimotor circuits. The Journal of neuroscience : the official journal of the Society for Neuroscience, 33(49), 19326–19340. https://doi.org/10.1523/JNEUROSCI.1688-13.2013
[26] S. Ruder, “An overview of gradient descent optimization algorithms,” Jun. 15, 2017, arXiv: arXiv:1609.04747. doi: 10.48550/arXiv.1609.04747.
[27] J. Heaton, “Ian Goodfellow, Yoshua Bengio, and Aaron Courville: Deep learning,” Genet Program Evolvable Mach, vol. 19, no. 1, pp. 305–307, Jun. 2018, doi: 10.1007/s10710-017-9314-z.
[28] S. M. M. R. Al Arif, K. Knapp, and G. Slabaugh, “Fully automatic cervical vertebrae segmentation framework for X-ray images,” Comput Methods Programs Biomed, vol. 157, pp. 95–111, Apr. 2018, doi: 10.1016/j.cmpb.2018.01.006.
[29] Zhao, L., Wang, T., Chen, Y., Zhang, X., Tang, H., Lin, F., Li, C., Li, Q., Tan, T., Kang, D., & Tong, T. (2025). A novel framework for segmentation of small targets in medical images. Scientific reports, 15(1), 9924. https://doi.org/10.1038/s41598-025-94437-9
[30] M.-H. Horng, C.-P. Kuok, M.-J. Fu, C.-J. Lin, and Y.-N. Sun, “Cobb Angle Measurement of Spine from X-Ray Images Using Convolutional Neural Network,” Computational and Mathematical Methods in Medicine, vol. 2019, no. 1, p. 6357171, 2019, doi: 10.1155/2019/6357171.
[31] C. Shorten and T. M. Khoshgoftaar, “A survey on Image Data Augmentation for Deep Learning,” Journal of Big Data, vol. 6, no. 1, p. 60, Jul. 2019, doi: 10.1186/s40537-019-0197-0.
[32] F. Isensee, P. F. Jaeger, S. A. A. Kohl, J. Petersen, and K. H. Maier-Hein, “nnU-Net: a self-configuring method for deep learning-based biomedical image segmentation,” Nat Methods, vol. 18, no. 2, pp. 203–211, Feb. 2021, doi: 10.1038/s41592-020-01008-z.
