College of Science
92 Establishing a Sample Preparation Protocol for Nanoscopic Fluorescence Electron Microscopy (nano-fEM)
Sophia Dahlen; Brittany Graham; Brian Mueller; and Erik Jorgensen
Faculty Mentor: Erik Jorgensen (School of Biological Sciences, University of Utah)
Abstract
Nanoscopic Fluorescence and Electron Microscopy (nano-fEM) is a tool that combines the advantages of both fluorescence and electron microscopy – specific protein localization and subcellular context, respectively. However, the sample preparation methods for the two techniques are vastly different from one another, posing a challenge in using the sample for both types of microscopy. Yielding results that maintain optimal fluorescence and membrane contrast comparable to if the techniques had been performed independently is a key obstacle in establishing a protocol for nano- fEM. These experiments made necessary modifications to the standard protocols for the two techniques. Here, animals stained with fluorophores were high-pressure frozen, fixed, and embedded in resin, then checked to see if fluorescence was preserved. The concentration of osmium tetroxide was reduced to prevent the black staining from blocking emitted fluorescence. Lowicryl resin did not emit fluorescence but maintained sample fluorescence. The next steps for this experiment include microtome sectioning at the animal’s pharynx, followed by superresolution microscopy and transmission electron microscopy. Successfully establishing a sample preparation protocol will reveal protein localization in the context of the cell morphology in the nerve ring.
Introduction
Problem
The ultrastructure of cells can only be visualized by electron microscopy (EM). Such images can provide nanometer resolution images of organelles and biological membranes and reveal how diseases disrupt cell function. Nevertheless, EM cannot provide information on the location of proteins of interest within the cell. Protein localization can be visualized by fluorescence microscopy but lacks subcellular context. Superresolution fluorescence microscopy using blinking dyes can provide the location of proteins at nanoscale resolution in relation to other fluorescently labelled proteins.
Nanoscopic fluorescence electron microscopy (nano-fEM) combines the advantages of both types of microscopy to identify the locations of proteins in relation to the ultrastructure of the cell.
An electron micrograph of a neuromuscular junction can show many vesicles present at the synapse, but the identity of the vesicle can only be determined by its protein composition. Larger proteins such as ribosomes are visible with EM but small proteins, like those that occupy the membranes of synaptic vesicles, cannot be seen with EM alone. For example, ATG-9 positive vesicles are present at the pre-synapse and do not carry or release neurotransmitter1. ATG-9 vesicles are indistinguishable from other synaptic vesicles visible by EM.
Superresolution microscopy overcomes the diffraction limits of conventional fluorescence and light microscopy to provide high spatial resolution of proteins2. This technique provides highly accurate information about the specific locations of proteins, but only in relation to other proteins that are labeled within the sample. Nonetheless, superresolution microscopy is a tool that can make meaningful contributions to understanding protein-protein interactions and examining spatial relations between different proteins. Superresolution microscopy, however, cannot provide accurate and precise information about a protein’s absolute location within an organism at nanoscale resolution unless correlated to electron microscopy.
When attempting to use the same sample for both fluorescence and electron microscopy, the largest obstacle is the major differences in the sample preparation between the two techniques. For instance, fluorescence microscopy requires appropriate selection and labeling with fluorophores and fixation of the sample. Sample preparation for electron microscopy is more extensive, requiring steps such as heavy metal staining, dehydration, and resin-embedding.
Relevant Background and Previous Limitations
To use the same sample for both fluorescence and electron microscopy, and later correlate the images, is not a new concept. In recent decades, there has been substantial work conducted on establishing a protocol for Correlated Light and Electron Microscopy, or CLEM, sometimes referred to as correlative microscopy3. Like nano-fEM, CLEM could be used to identify the locations of proteins within the biological ultrastructure. Establishing a sample protocol for CLEM has a nearly identical goal to that of nano-fEM: to find the perfect balance between preserving fluorescence and the EM imaging contrast without altering the biological ultrastructure.
As opposed to CLEM, nano-fEM focuses on higher specificity rather than the general location of the proteins within an organism, with the ultimate goal of locating proteins with the same nanometer resolution as EM.
Previous attempts to combine fluorescence and electron microscopy relied on fluorescent proteins such as GFP. However, fixed samples embedded in resin lacked the ability to fluoresce. GFP requires water to excite and fluoresce4, but EM samples must be dehydrated prior to resin embedding. A further drawback of fluorescent proteins imaged using conventional fluorescence microscopes is that they are diffraction limited. In the case of green light, localization of individual molecules at <450 nm is not possible. The fluorescent signal from a single GFP molecule would fill an entire synapse.
As opposed to GFP, the dyes that bind to SNAPtags and HALOtags do not require water to fluoresce. The tag genetically fuses to the protein of interest, and the chromophores covalently bind to the proteins, rather than the proteins themselves being fluorescent. This is an irreversible linkage between the chromophore and protein, eliminating the concern for denaturation5. These tags are useful in superresolution microscopy because of their high specifically in labeling proteins and the brightness of the phtotoexcitable chromophores which is useful in achieving the ultra-high resolution provided by superresolution microscopy.
Ground-state depletion is used to isolate and collect photons from single active fluors one-at-a- time, overcoming the issues related to light diffraction. By having the fluorophores “blink” one at a time, the center of each light-diffracted blink can be mathematically determined by the program to a highly accurate, centralized point of where the protein of interest lies.
To avoid the dehydration required for EM sample preparation, attempts have been made to image fluorescence in the intact sample, such as live cells, prior to fixation6. EM images taken after fixation were then correlated with the fluorescence images. Although this technique has been used successfully, the fact that the fluorescence imaging is prior to fixation is limiting when it comes to the accuracy of overlaying with the EM image. In the time between fluorescence and EM imaging, the biology of the live cell may have changed. Consequently, the location of the proteins may have changed, decreasing the accuracy of the overlay after EM. This method only provides a general idea of the locations of proteins within the cell, but it would be inaccurate to assume the location of proteins in the resulting fluorescence and EM images are exactly aligned.
Methods have been developed to mark the locations of proteins within electron micrographs without the need for fluorescence imaging. In immuno-EM, proteins of interest can be localized using electron dense gold beads7. Gold beads are conjugated onto primary or secondary antibodies, where the antigen is the protein of interest. This method has multiple limitations: antibody specificity, if labeling is done after sectioning only antibodies on the surface of the section will be labeled, and the radius of the center of the gold bead to the protein of interest can be upwards of 40 nm.
Blinking dyes may circumvent many of the issues with fluorescent proteins and immuno- labeling. However, fixation of EM samples typically employs glutaraldehyde and osmium tetroxide, and the latter may obstruct emitted fluorescence. Furthermore, glutaraldehyde is known to be autofluorescent8, interfering with the emitted fluorescent signal. Previous studies have reduced the concentrations of these fixatives to allow for successful fluorescence imaging, but this has been detrimental to the ultrastructure as seen by EM9. The primary objective for these experiments is to establish a protocol for both EM and fluorescence microscopy that would determine the location of proteins in relation to biological membranes. This information would allow for the creation of protein maps which can show the distribution of proteins of interest in relation to subcellular structures.
Project Aims
To establish a protocol, the aims of the project are threefold. First, it is necessary to identify the optimal fixatives, concentrations of fixatives and type of resin that preserve fluorescence while maintaining ultrastructure, particularly membrane morphology. Second, a fiducial marker must be identified so that the fluorescence and EM images can be overlaid, taking into consideration any shrinking or swelling the resin sections may undergo. Finally, the results gathered from both fluorescence and EM imaging will be mathematically superimposed to identify the exact location of specific proteins within the ultrastructure.
Methods
Worm maintenance
The model system used in the experiments is the nematode worm Caenorhabditis elegans which are about one millimeter in length with a simple nervous system. Worms are kept at 20℃ and have a generation time of about 3-5 days. The worms are raised on plates seeded with OP50, a bacterial strain of E. coli. The strain used in the experiment was snt-1(md290) II oxSi730[Psnt-1::unc-10a::halo, unc- 119(+) *ttTi5605] II ; oxSi598[snt-1::snapf cbunc-119(+)] IV.
Worm Staining
Staining for SNAPtags and HALOtags was performed with the dyes JF549cp and JF646, respectively, detected with 560 nm or 640 nm excitation10. The animals are washed with an M9 buffer solution to remove excess bacteria. After washes, the worms were resuspended in 195 µL of M9 buffer. The JF dyes are resuspended in DMSO (every 5 nmol of dye was resuspended using 5 µL of DMSO) and combined before being added to the worms in M9. The final concentration of dye is 25 µM. Concentration of DMSO should be closely followed since a DMSO concentration above 5% is lethal to worms. The worms are exposed to dyes for 2 hours in a dark environment before being washed and transferred to new OP50 plates. After 12 hours, the samples were checked under a dissecting microscope prior to high-pressure freezing to ensure that the worms were dyed successfully.
Sample Preparation
Samples underwent high-pressure freezing using a Leica EM-ICE11 before being placed into cryotubes containing fixative and undergoing freeze substitution in a Leica AFS2. The fixative was composed of 0.02% osmium tetroxide, 2% paraformaldehyde, and 4.25% DI water. The freeze substitution protocol was as follows: -90℃ for at least 12 hours, increase by 5℃ per hour until the system reaches -60℃ and held a that temperature for 12 hours, increase by 5℃ per hour until the system reaches -20℃, and hold at -20℃ for at least 16 hours.
Resin Embedding
For eponate resin embedding, once samples reached -20℃ in the Leica AFS2, they were further warmed to room temperature. Samples were washed 6 times with freshly opened 100% acetone. Using freshly opened acetone is vital to properly dehydrate the samples. After washing, samples went through increasing concentrations of eponate resin (1.1 g araldite, 1.55 g eponate, 3.05 g DDSA, and 200 µL BDMA to make 100% resin – other resin concentrations are made by diluting this mixture with acetone) in acetone as follows: 30% eponate for 12 hours, 70% eponate for 8 hours, 90% eponate for 12 hours, then three 100% eponate exchanges spaced at least two hours apart. In the last 100% eponate exchange, the samples were transferred to molds and baked at 60℃ for 48 hours.
For Lowicryl resin, after being held at -20℃ for 16 hours, samples were washed six times with freshly opened 100% acetone that had been pre-cooled to -20℃. After each wash, the samples were placed back into the Leica AFS2 to maintain -20℃. After washing, the samples went through increasing concentrations of Lowicryl resin (0.54 g Crosslinker D, 3.46 g Monomer E, and 0.02 g Initiator C to make 100% resin – other resin concentrations are made by diluting this mixture with acetone) in acetone as follows: 30% Lowicryl resin for at least 5 hours or overnight, 70% Lowicryl resin for 6 hours, 90% Lowicryl overnight, then three 100% Lowicryl resin exchanges incubating for two hours each time. After every exchange, the samples are returned to the Leica AFS2 to be held at – 20℃. After the final 100% Lowicryl exchange, the samples are returned to the Leica AFS2 where the resin is cured using the following protocol: -20℃ with UV light on for 48 hours, increase by 5℃ per hour until the system reaches 20℃, then hold at 20℃ for another 48 hours with the UV light on. After the resin is fully polymerized, the samples can be taken to be checked for the preservation of fluorescence in the sample.
Microtome Sectioning
Each resin-embedded sample will undergo sectioning with a microtome with a glass knife, providing a sample set showing synapses within the length of the worm. Sections are collected at the pharyngeal region on silicone nitride grids that have been glow discharged to reduce their hydrophobicity.
Imaging
A superresolution staining protocol was followed12 in order to visualize the proteins fused with the SNAPtags and HALOtags. Sections are imaged for fluorescence using the Bruker Vutara superresolution microscope. Ground-state depletion is used to isolate and collect photons from single active fluors one-at-a-time, overcoming the issues related to light diffraction. By having the fluorophores “blink” one at a time, the center of each light-diffracted blink can be mathematically determined by the program to a highly accurate, centralized point of where the protein of interest lies.
The modified protocol attempted to minimize the concentration of osmium tetroxide to a level that would still allow for satisfactory membrane contrast in EM and prevent the emitted fluorescence from being blocked. The process of chemical fixation, acetone washes, and resin embedding is all performed at -20℃. Lowicryl hardens over 48 hours under UV light, after which the sample is brought back to room temperature and ready to be checked for fluorescence.
The samples then undergo microtome sectioning with a glass knife at 100 nm at the pharynx and the samples are collected on silicon nitride grids which are glow discharged to reduce their hydrophobicity. Silicon nitride grids are used in the place of pioloform grids because of concern for autofluorescence with pioloform and its fragility when exposed to a laser in superresolution microscopy. The sections first undergo fluorescence microscopy followed by EM imaging.
Results
Strain Identity
The gene unc-10 codes for the protein RIM, which is a scaffold protein that interacts with other proteins at the active zone to aid in the docking, fusion, and release of synaptic vesicles into the cleft13. The gene snt-1 codes for the protein synaptotagmin-1, which acts as a calcium ion sensor and triggers the release of neurotransmitters into the synaptic cleft in response to an action potential14.
Fixative concentrations do not block emitted fluorescence
The proper concentrations of the different fixatives were determined; osmium levels are minimized to allow for fluorescence but still be able at a high enough concentration to fix the membranes to be seen in EM. Paraformaldehyde (PFA) was used in place of glutaraldehyde for crosslinking proteins since glutaraldehyde is known to be autofluorescent.
The concentration of osmium tetroxide used was reduced to 0.02%, which is considerably low for EM sample preparation protocol. Compared to the chemical fixation protocol for a sample undergoing just EM imaging which calls for a considerably higher osmium concentration of 1%, the worms appeared lighter in color post-fixation (Figure 1). When these worms were frozen, fixed and embedded in resin, the fluorescence from the staining performed prior to freezing and EM preparation protocols was visible under the dissecting microscope (Figure 3). The worms were also checked for successful staining prior, and the fluorescence was preserved. At this point, we know that the worms are transparent enough to allow for the emitted fluorescence to be seen, but it is not until the sample undergoes EM imaging that we can conclude that this concentration also preserves membrane contrast.
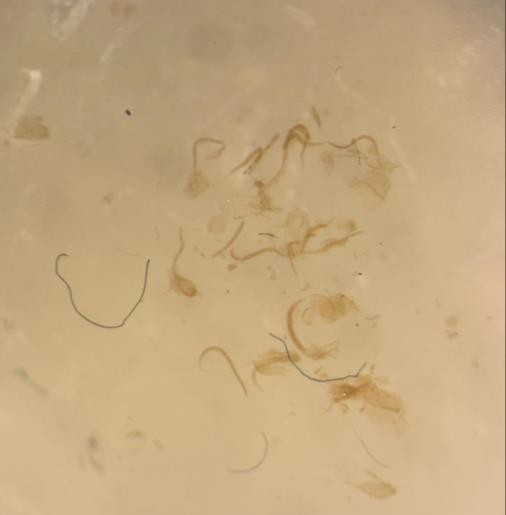 Figure 1A (Sophia Dahlen)
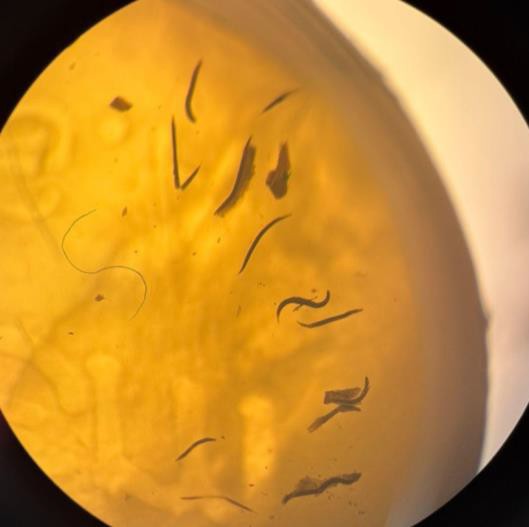
Figure 1B (Sophia Dahlen)
Figure 1. Worms post-fixation embedded in resin. A) The worms underwent a 0.02% osmium fixation, resulting in the worms being lighter in color and more transparent to allow for fluorescence. These animals are embedded in Lowicryl resin. B) Worms underwent fixation with a standard concentration of 1% osmium tetroxide and subsequent eponate resin embedding. Because of the increased concentration of osmium tetroxide, the worms are darker in color and more opaque, blocking any emitted fluorescence. Images were taken under a dissecting microscope.
Lowicryl-based resin permits emitted fluorescence
By embedding the frozen and fixed samples in a Lowicryl-based resin instead of the standard eponate-based resin, the emitted fluorescence is visible under a dissecting microscope. Because of the autofluorescence of eponate, the emitted fluorescence from the sample is overpowered if it is present (Figure 2).
To determine if fluorescence is present in the sample itself, it was necessary to select a resin that does not autofluoresce. When the samples were embedded in a Lowicryl-based resin rather than eponate, the emitted fluorescence from animals that were stained prior to high-pressure freezing is preserved, indicating that not only was the Lowicryl not autofluorescent, but the protocol for embedding the sample within this resin did not block or hinder its emitted fluorescence (Figure 3).
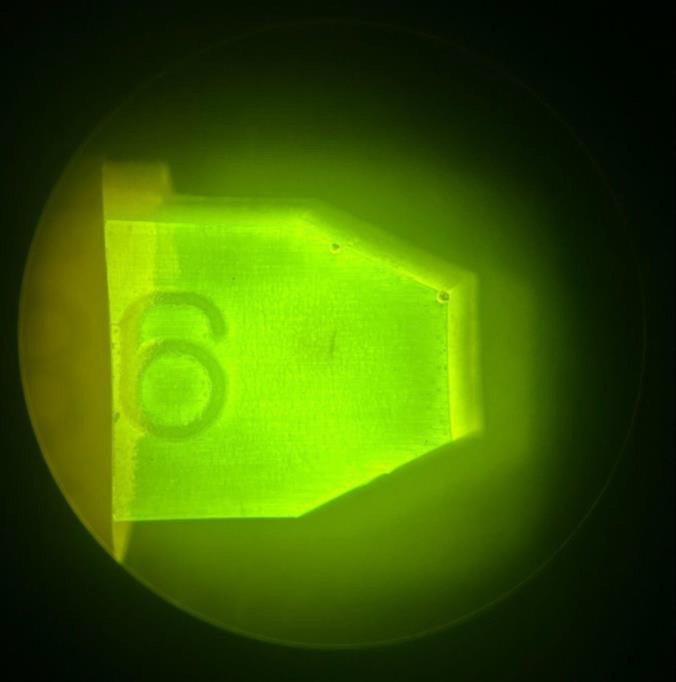
Figure 2. A Skylan-S tagged worm that had undergone heavy metal staining with a reduced concentration of osmium tetroxide and protein fixation with 2% paraformaldehyde for EM along with exposure to a fluorophore for fluorescence microscopy. The sample was embedded in an eponate based resin following the standard protocol mentioned in Methods. The eponate resin is autofluorescent and any fluorescence emitted by the sample itself would not be visible. Image was taken under a dissecting microscope.
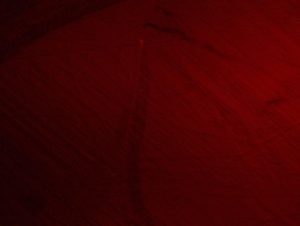
Figure 3A (Sophia Dahlen)
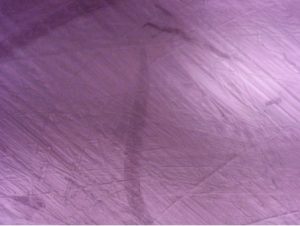
Figure 3B (Sophia Dahlen)
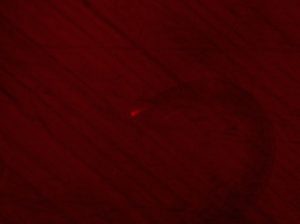
Figure 3C (Sophia Dahlen)
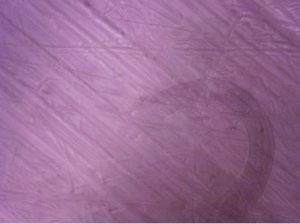
Figure 3D (Sophia Dahlen)
Figure 3. Worms that have undergone heavy metal staining with a reduced concentration of osmium tetroxide and protein fixation with 2% paraformaldehyde for EM along with exposure to a fluorophore for fluorescence microscopy. Worms are embedded in Lowicryl resin. A) Fluorescence is visible in the nose of the worm. B) Bright field image of same sample (A). C) Fluorescence is visible in the nose of a different worm that was treated under the same conditions. D) Bright field image of the same sample (C). Images were taken under a dissecting microscope.
Discussion
Nano-fEM using Sklyan-S Fluorophore
The aforementioned protocol was performed on a strain that expressed Skylan-S, a photoswitchable green fluorescent protein with an excitation wavelength of 499 nm15. The strain used was oxEx2106pSAM643[Psnt-1::tom-20::skylan-s::let858utr; cb-unc-119(+)] pCFJ90[Pmyo- 2::mCh] unc-119(ed3) III where Skylan-S is tagged onto tom-20 which expresses a protein on the outer mitochondrial membrane responsible for the import of mitochondrial precursor proteins16. This was expressed under the neuron-specific psnt-1 promoter. By tagging a mitochondrial protein, the intent was to have an identifiable fiducial marker in both fluorescence microscopy and EM assuming that the fluorescence would be preserved when embedded in resin. Unlike strains containing SNAPtags and HALOtags, worms containing Skylan-S do not require a specific dying process prior to high pressure freezing.
This strain underwent high pressure freezing and was chemically fixed using the following fixative recipe: 0.02% osmium tetroxide, 2% PFA, and 4.25% DI water – the same fixative concentrations used in the primary experiment. The stain with this fixative concentration was embedded in both an eponate-based resin (Figure 3) and a Lowicryl-based resin. The eponate resin was autofluorescent (Figure 3), blocking emitted fluorescence if it was present.
Consequently, this procedure was performed again, but the worms were embedded in Lowicryl resin to test whether the autofluorescence from the eponate was overpowering the emitted fluorescence from the worm or if there was no fluorescence at all. When reconducted with Lowicryl resin, the worms did not exhibit any visible fluorescence under the dissecting microscope (Figure 4). This is likely because Skylan-S functions similarly to GFP since they are both fluorescent proteins. Dehydrating the samples in the sample preparation protocol destroys the protein’s ability to fluoresce.
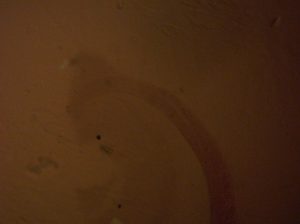
Figure 4A (Sophia Dahlen)
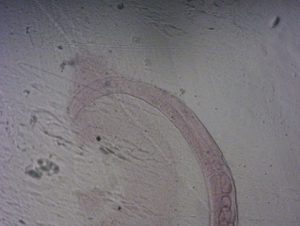
Figure 4B (Sophia Dahlen)
Figure 4. Strain with Skylan-S tagged onto tom-20 and embedded in a Lowicryl-based resin. A) No fluorescence is visible within the worm at an excitable wavelength for Skylan-S. If fluorophores were functioning as expected, the worm should be fluorescing down the length of the dorsal and ventral nerve cords and in the nerve ring in the pharyngeal area. B) Bright field image of the same sample. Images were taken under a dissecting microscope.
Broader Impacts
Nano-fEM would allow for the localization of specific proteins not only in relation to one another, but also in relation to subcellular structures, for example, organelles. Such information could identify contents and components of vesicles, endoplasmic reticulum, and cell membranes. Knowing the precise location and distribution of proteins in a cell can identify the site and participants of biological processes. Furthermore, having this information can aid in identifying when cells are not performing their proper functions and what specific components are not operating correctly. This can be useful in the understanding and diagnostics of neurodegenerative diseases and other disorders not limited to the neurons.
Limitations
Although the fixative concentrations resulted in the worm being transparent enough to allow emitted fluorescence to be visible when embedded in resin, there are a few limitations within the experiment that prevent this developed protocol from being standardized in nano-fEM practice.
The sample has yet to be imaged using EM. EM imaging will be necessary to determine if the reduction in heavy metal staining is still sufficient to visualize membrane contrast in EM. To verify that the membrane contrast is sufficient, sections can be collected from any part of the worm, likely the gonad, to ensure the morphology is intact.
The Lowicryl-embedded worms that emitted fluorescence have yet to be sectioned and examined under the superresolution microscope. Only whole worms have been examined for the preservation of fluorescence. However, cured Lowicryl blocks that do not contain worms have been sectioned under the microtome to confirm that their hardness can withstand microtome sectioning at 100 nm.
The strain used in the experiment fluorescently labeled snt-1 and unc-10, neither of which express proteins localized in the mitochondria. Without labeling a mitochondrial protein, samples under this strain lack a fiducial marker to overlay fluorescence and EM images. Although this experiment focused on preserving fluorescence in a resin-embedded sample, a different strain will need to be used in the future that specifically marks mitochondrial proteins.
Acknowledgements
This work was supported by the National Science Foundation (NeuroNex 2014862) and the National Institutes of Health (R01 NS034307), both awarded to Erik Jorgensen. Additional support was provided by the University of Utah Office of Undergraduate Research (Undergraduate Research Opportunity Award) awarded to Sophia Dahlen.
References
- Sisi Yang, Daehun Park, et al. Presynaptic autophagy is coupled to the synaptic vesicle cycle via ATG-9, Neuron, Volume 110, Issue 5, 2022
- Navid Rabiee, Super-resolution microscopy for protein imaging: Unraveling cellular architecture and function, TrAC Trends in Analytical Chemistry, Volume 184, 2025, 118140, ISSN 0165-9936, https://doi.org/10.1016/j.trac.2025.118140.
- Su, Y., Nykanen, M., Jahn, K.A. et al. Multi-dimensional correlative imaging of subcellular events: combining the strengths of light and electron microscopy. Biophys Rev 2, 121–135 (2010)
- Kiran Bhaskaran-Nair, Marat Valiev, S. H. M. Deng, William A. Shelton, Karol Kowalski, Xue-Bin Wang; Probing microhydration effect on the electronic structure of the GFP chromophore anion: Photoelectron spectroscopy and theoretical investigations. J. Chem. Phys. 2015 Dec
- Yao L, Zhang L, Fei Y, Chen L, Mi L, Ma J. Application of SNAP-Tag in Expansion Super-Resolution Microscopy Using DNA Oligostrands. Front Chem. 2021 Apr 30;9:640519. doi: 10.3389/fchem.2021.640519. PMID: 33996746; PMCID: PMC8119759.
- Polishchuk RS, Polishchuk EV, Marra P, Alberti S, Buccione R, Luini A, Mironov AA. Correlative light- electron microscopy reveals the tubular-saccular ultrastructure of carriers operating between Golgi apparatus and plasma membrane. J Cell Biol. 2000 Jan
- Faulk WP, Taylor GM. An immunocolloid method for the electron microscope. Immunochemistry. 1971 Nov
- Lee, K., Choi, S., Yang, C., Wu, H.-C., & Yu, J. (2013). Autofluorescence generation and elimination: A lesson from glutaraldehyde. Chemical Communications, 49(29), 3028–3030. https://doi.org/10.1039/C3CC40799C
- Watanabe S, Jorgensen EM. Visualizing proteins in electron micrographs at nanometer resolution. Methods Cell Biol. 2012
- Howard Hughes Medical Institute, Janelia Research Campus. (n.d.). JFX dyes. Janelia Research Campus.
- Kusick GF, Chin M, Raychaudhuri S, Lippmann K, Adula KP, Hujber EJ, Vu T, Davis MW, Jorgensen EM, Watanabe S. Synaptic vesicles transiently dock to refill release sites. Nat Neurosci. 2020 Nov;23(11):1329-1338. doi: 10.1038/s41593-020-00716-1. Epub 2020 Sep 28. PMID: 32989294; PMCID: PMC8054220.
- Mueller BD, Merrill SA, Von Diezmann L, Jorgensen EM. Using Localization Microscopy to Quantify Calcium Channels at Presynaptic Boutons. Bio Protoc. 2024 Aug 20;14(16):e5049. doi: 10.21769/BioProtoc.5049. PMID: 39210951; PMCID: PMC11349493.
- Wu S, Fan J, Tang F, Chen L, Zhang X, Xiao D, Li X. The role of RIM in neurotransmitter release: promotion of synaptic vesicle docking, priming, and fusion. Front Neurosci. 2023 Apr 26;17:1123561. doi: 10.3389/fnins.2023.1123561. PMID: 37179554; PMCID: PMC10169678.
- Xu J, Pang ZP, Shin OH, Südhof TC. Synaptotagmin-1 functions as a Ca2+ sensor for spontaneous release. Nat Neurosci. 2009 Jun;12(6):759-66. doi: 10.1038/nn.2320. PMID: 19412166; PMCID: PMC2739891.
- X. Zhang, M. Zhang, D. Li, W. He, J. Peng, E. Betzig, & P. Xu, Highly photostable, reversibly photoswitchable fluorescent protein with high contrast ratio for live-cell superresolution microscopy, Proc. Natl. Acad. Sci. U.S.A. 113 (37) 10364-10369, https://doi.org/10.1073/pnas.1611038113 (2016).
- Schleiff E, Turnbull JL. Functional and structural properties of the mitochondrial outer membrane receptor Tom20. Biochemistry. 1998 Sep 22;37(38):13043-51. doi: 10.1021/bi9807456. PMID: 9748309.
Media Attributions
- 146881378_figure_3a
- 146881870_figure_3b
- 146882801_figure3c
- 146883688_figure_3d
- 146883866_figure_4a
- 146883898_figure_4b
