College of Social and Behavioral Science
113 Exploring County-Level Disparities in Child Food Insecurity and Meal Participation in Utah
Holden Cheney
Faculty Mentor: Richard Fowles (Economics, University of Utah)
ABSTRACT
Using five regression models based on 2022 county-level data I analyzed the relationship between child food insecurity and factors such as cost per meal, unemployment, race, housing, education, and school enrollment demographics. I then used a panel dataset from 2018 to 2022 to test the impact of school lunch participation over time, controlling for both county and year fixed effects. Together these models provide a comprehensive understanding of how school based food programs interact with local economic and demographic factors.
The central research question guiding my work is: To what extent do school lunch participation rates and local demographic and economic characteristics explain disparities in child food insecurity across Utah counties, and what evidence is there that universal free lunch policies help reduce such disparities?
INTRODUCTION
Access to adequate nutritious food is one of the most basic needs in order for children to thrive physically, emotionally, and academically. Yet despite widespread efforts to address poverty and hunger in the United States child food insecurity remains a persistent issue, disproportionately affecting low income communities and exacerbating educational health inequalities. According to the Utah Food Bank over 1 in 6 children in the state are food insecure, with significant variation across counties (Parkinson, 2024). These disparities are not just troubling from a moral standpoint, but they pose long term challenges to economic mobility and public health.
National school meal programs like the National School Lunch Program (NSLP) and School Breakfast Program (SBP) were established to address these gaps by offering low- or no-cost meals to students from low-income households. Participation in these programs is associated with improved food access and a reduction in health and educational disparities among children (Gundersen et al., 2012; Bartfeld et al., 2009). Yet despite the proven benefits of these programs, barriers persist. Not all eligible children participate, and eligibility requirements may exclude families experiencing food insecurity who fall above the income cutoff. During the COVID-19 pandemic, federal waivers briefly allowed universal access to school meals for all students, eliminating these restrictions. However, this policy expired in 2022, returning school meal access to a tiered, means-tested model. This policy change prompted concerns from school administrators and public health advocates in Utah, who worry that the return to selective eligibility may worsen food insecurity among vulnerable children.
The following research is situated within a growing body of literature that investigates the relationship between school meal participation and child food insecurity. While numerous national studies have shown that participation in NSLP and other meal programs is associated with improved food security there is limited research that examines this relationship at the county level within Utah. Additionally, there is a lack of empirical evidence assessing how the temporary shift to universal free lunch during the pandemic affected child food insecurity in Utah counties.
This research contributes to the literature by combining cross-sectional and panel data analysis to investigate the extent to which variation in school lunch participation, socioeconomic indicators, and demographic characteristics explain differences in child food insecurity across utah counties. It also evaluates whether the universal school lunch policy in 2021 is associated with a measurable reduction in child food insecurity.
LITERATURE REVIEW
Food insecurity among children in the United States remains a persistent public health and policy concern, with nearly 7.2 million children living in food-insecure households (USDA, 2025). This means nearly 1 in 5 children are experiencing food insecurity across the United States. Despite federal nutrition programs aimed at reducing hunger, disparities persist across regions and demographic groups particularly among low-income families and rural communities.
There is extensive literature that shows the detrimental impacts that low food security has on children’s physical health, nutritional, psychological, behavioral, and educational outcomes (Chilton et al., 2009; Gundersen & Kreider, 2009; Huang, Matta Oshima, & Kim, 2010). These studies reveal that food-insecure children are more likely to experience poor physical development, higher rates of chronic illness, emotional distress, and difficulties in academic performance compared to their food- secure peers. The National School Lunch Program is a key component of the U.S. food assistance system, aimed at supporting the nutritional needs of low-income school-aged children and addressing the consequences of childhood undernutrition. Operated by the USDA but implemented at the state level, the NSLP program offers free lunches to students from households earning up to 130% of the federal poverty line, and reduced-price lunches to those with incomes between 130% and 185% of the poverty threshold (Bartfeld, 2013).
There is a limited amount of promising evidence that the NSLP plays a role in reducing the risk of food insecurity for poor households (Gundersen, Kreider, & Pepper, 2012; Kabbani & Kmeid, 2005). Under their strongest assumptions, Gundersen et al. (2012) estimated that participation in the NSLP reduces food insecurity among eligible children by approximately 1 to 9 percentage points, suggesting a modest but meaningful impact.
Although the National School Lunch Program is a major federal initiative to address child hunger, relatively few studies have directly evaluated its effects on household food security. Existing research suggests that participation in the NSLP is linked to a reduced likelihood of food insecurity in households with school-aged children. For households that experienced hunger during the year, participation in the NSLP was associated with a 33% lower likelihood of being food insecure during the last month of the year. This effect was strongest among households eligible for free meals, suggesting the NSLP provides meaningful short-term protection against severe food hardship (Kabbani & Kmeid, 2005).
Additional findings have connected the program to broader improvements in children’s health outcomes, including better general health and healthier weight status as well as a measurable decline of around 6 percent in low food security among eligible participants (Gunderson et al. 2012). A more recent study indicates that children who receive school meals through the NSLP experience higher food security compared to those who either pay full price or do not participate. Using an instrumental variables approach, the authors estimate that NSLP participation is associated with a -0.70 marginal reduction in the probability of food insecurity (Arteaga & Heflin, 2014). In this study food security scores are derived from a standardized 18 item USDA questionnaire, based on reported household experiences like skipped meals or limited food access, where higher scores reflect a higher probability of food insecurity.
In addition to the National School Lunch Program, other school-based meal initiatives have been shown to reduce food insecurity. Bartfeld et al., using an instrumental variable approach, found that the presence of the school breakfast program in schools was associated with a reduced likelihood of marginal food insecurity (2009). Similarly, Bartfeld and Dunifon analyzing data from the Current Population Survey observed that states with higher participation in summer meal programs had lower household food insecurity rates among families with children (2006).
Considering this information, my initial hypothesis posits that expanding participation in school meal programs – especially through universal free lunch – can reduce child food insecurity across counties in Utah. While reviewing relevant scholarship I found a significant portion of existing literature is nationally focused and often examines federal programs like the National School Lunch Program (NSLP) or the School Breakfast Program (SBP) in a broader context. However, relatively few studies investigate how these programs affect child food insecurity at the state or county level, particularly in under researched states like Utah. There also appears to be a lack of recent county-level empirical research that incorporates socioeconomic and demographic variation. Much of the literature highlights associations between food assistance programs and food security outcomes but does not fully capture the local nuances or include updated data in the post-pandemic period.
This research seeks to address these gaps by using county-level data from Utah between 2018 and 2022 to evaluate how child food insecurity rates are shaped by school meal program participation as well as demographic, educational, and economic indicators. Through a series of cross-sectional and panel data models, this study examines the extent to which school-based food programs, including participation in the NSLP, are associated with reduced food insecurity. By situating these findings in the context of local variation and post-pandemic recovery, this paper contributes updated and policy- relevant evidence to support state-level efforts such as the expansion of universal free lunch programs.
When it comes to demographic factors research has repeatedly shown a strong independent relationship between owning a home and lower vulnerability to food insecurity. A study by St- Germain & Tarasuk found that food insecurity prevalence was highest among market renters at 28.5% followed by homeowners with a mortgage at 11.6% and mortgage free homeowners at 4.3%. Their research concluded that “homeowners had substantially lower adjusted odds of food insecurity than market renters” (St-Germain & Tarasuk).
Recent national research by the USDA highlights how key household characteristics such as parental education and employment status significantly shape the risk of child food insecurity. In particular children living in households headed by an unemployed adult were found to be three and a half times more likely to experience food insecurity than those in households with a full-time employed adult (Coleman-Jensen, McFall, & Nord, 2019). This finding underscores the critical role stable employment plays in buffering families from economic vulnerability and food insecurity.
Similarly educational attainment has emerged as one of the strongest predictors of household food insecurity. According to the same USDA report educational attainment of adults in a household is closely linked to the food security status of children. Households in which no adult has completed high school experience significantly higher rates of child food insecurity compared to those where at least one adult has a college degree. For example, national survey data from 2010-2011 found that the prevalence of food insecurity among children was more than six times higher in households without a high school graduate than in those where an adult held a four-year college degree (Coleman-Jensen et al., 2019). These findings suggest that lower levels of education may contribute to economic vulnerability thereby increasing the risk of insufficient access to nutritious food for children. This research supports the inclusion of variables such as unemployment and high school education attainment in my models.
Research by Chaparro et al. provides strong evidence linking structural racism and food in security outcomes, showing that state-level socioeconomic racial inequities are significantly associated with differences in food insecurity risk across racial groups (2022). Using pooled data from the Current Population Survey and the American Community Survey (2015-2019), the authors examined racial disparities in income, education, unemployment, earnings, and home ownership as indicators of structural racism. Their findings show that for Black households higher state level inequities in income, unemployment, and home ownership are associated with significantly greater odds of food insecurity. Conversely, among White households those same inequities were associated with reduced odds of food insecurity, suggesting that White populations may benefit from systems that structurally disadvantage others. These findings reinforce the notion that food insecurity is not just a matter of iindividual or household-level disadvantage but is also shaped by broader systems of inequality. While Chaparro et al. focuses on adult households nationally, the disparities they document may similarly influence child specific outcomes at more localized levels, particularly where structural disadvantage intersects with race. In the context of my thesis these findings support the inclusion of racial and ethnic demographic variables in modeling county-level variation in child food insecurity in Utah.
National-level research has consistently shown that American Indian and Alaska Native (AI/AN) populations experience disproportionately high rates of food insecurity. Jernigan et al. (2017) analyzed data from the Current Population Survey–Food Security Supplement and found that AI/AN individuals were significantly more likely to experience food insecurity compared to White individuals, even after controlling for key socioeconomic variables. Over a ten-year span from 2000 to 2010, about 25% of AI/ANs were food insecure–nearly double the rate of their White counterparts.
The study also highlighted important geographic nuances revealing that AI/ANs living in urban areas were more likely to experience food insecurity than those in rural or reservation communities, possibly due to social isolation and reduced access to culturally appropriate support services in urban environments. These findings emphasize the need to consider racial and spatial disparities when addressing food insecurity, particularly in states like Utah where rural tribal communities face unique economic and geographic challenges (Jernigan et al., 2017).
Families raising children with disabilities face a heightened risk of food insecurity due to the compounded financial and caregiving demands that disability often entails. Sonik et al. , using data from the Survey of Income and Program Participation (SIPP), found that households with children with disabilities were significantly more likely to experience household food security, very low household food security, and child food insecurity, even after adjusting for income and other demographic factors (2016). The study attributes this increased vulnerability to both direct costs– such as out-of-pocket healthcare spending– and indirect costs, including reduced employment opportunities for caregivers. Their findings show that having a child with a disability increased the odds of experiencing food insecurity by 40%, reinforcing the idea that disability can magnify economic strain within families and disrupt access to nutritious food. Despite higher rates of participation in SNAP among these households, the safety net remains insufficient to eliminate disparities in food access. These results suggest that disability status is a crucial predictor of food insecurity and should be considered in any comprehensive policy approach aimed to alleviate hunger among children.
DATA SOURCES
This research draws on multiple publicly available datasets to construct a comprehensive, county-level profile of child food insecurity and its potential predictors across Utah’s 29 counties. The primary source is Feeding America’s Map the Meal Gap (MMG), which provides annual estimates of food insecurity rates and local meal costs. MMG data is widely used in hunger-related research and policymaking.
To supplement MMG data, I incorporated socioeconomic indicators from the U.S. Census Bureau and the Bureau of Labor Statistics. These include median household income, unemployment rate, renter-occupied housing shares, and educational attainment—factors consistently linked to food insecurity in the literature.
Additionally, county-level education data from the Utah State Board of Education (USBE) provided annual enrollment counts across key student demographics, including race/ethnicity, economically disadvantaged status, disability status, homelessness, and English learner designation. These raw counts were transformed into population shares relative to each county’s total K–12 enrollment to enable standardized cross-county comparisons.
Finally, to assess changes over time, I constructed a panel dataset spanning 2018–2022 by combining MMG’s annual child food insecurity estimates with USBE-reported participation rates in free and reduced-price lunch programs.
METHODOLOGY AND REGRESSION STRATEGY
This study utilizes a combination of cross-sectional and panel data models to analyze the determinants of child food insecurity across Utah’s 29 counties. The primary estimation approach is Ordinary Least Squares (OLS) regression using 2022 county-level data, followed by fixed effects panel models covering the years 2018 to 2022. The modeling strategy proceeds in stages to isolate the effects of specific predictors:
- Model 1 assesses the relationship between child food insecurity and core poverty indicators, including the share of food-insecure individuals below the SNAP threshold, the share of food- insecure children in households below 185% of the federal poverty line, and the average cost per meal in each county.
- Model 1b replaces the SNAP ≤ threshold variable with the share of food-insecure individuals above the SNAP threshold, enabling an examination of food insecurity among households excluded from federal nutrition assistance.
- Model 2 introduces additional structural variables—median household income, unemployment rate, and renter-occupied housing share—to evaluate how broader economic conditions shape food insecurity.
- Model 2b excludes median income to reduce multicollinearity and isolate the explanatory power of other structural factors such as unemployment and housing tenure.
- Model 3 incorporates educational attainment and English learner share to test whether low education and linguistic vulnerability contribute to food insecurity at the county level.
- Model 4 focuses on the demographic composition of K-12 student populations. It includes the county-level share of students who are Hispanic, Black, American Indian, economically disadvantaged, disabled, or experiencing homelessness.
- Model 4b focuses on the demographic composition of K-12 student populations, excluding economic disadvantage.
- A set of bivariate regressions complements Model 4, analyzing the individual association between each demographic group share and child food insecurity in isolation.
- Model 5 combines the most relevant predictors from prior models into a comprehensive specification that includes indicators of economic hardship, educational attainment, and demographic vulnerability.
To capture temporal dynamics, I constructed a five-year panel dataset using annual child food insecurity estimates and school meal participation rates. I employ fixed effects regression to control for time-invariant differences across counties, along with year fixed effects to account for statewide shifts–particularly in the implementation and expiration of universal school meals during the pandemic.
This regression framework allows for both cross-sectional and longitudinal analyses of how structural, demographic, and policy-based factors interact to shape child food insecurity across the state.
RESULTS
Model 1
In my initial model I sought to uncover the relationship between key poverty indicators and the rate of child food insecurity at the county level in Utah. To do so I developed a linear regression model using child food insecurity rate as the dependent variable. The independent variables in this model include the percentage of food insecure individuals living at or below the SNAP income eligibility threshold, the percentage of food-insecure children living in households below 185% of the federal poverty level, and the average cost per meal in each county.
The coefficient estimate for the percentage of food insecure individuals below the SNAP threshold is 0.236 (p < 0.001), indicating a statistically significant and positive relationship. Specifically, a 1 percentage point increase in the share of food insecure individuals who are income eligible for snap with a 0.236 point increase in the child food insecurity rate. This supports the hypothesis that counties with a higher concentration of deeply poor, food insecure households face more acute childhood hunger. The coefficient for the percentage of food insecure children in households under 185% FPL is 0.0166, but this effect was not statistically significant (p = 0.75). Similarly, the cost per meal variable had a negative coefficient of –0.0187, suggesting that higher food prices might correspond with lower food insecurity—an unexpected and likely spurious relationship that was not statistically significant (p = 0.15). One explanation for this could be that counties with higher food costs are often wealthier or urban areas with greater access to safety nets, skewing the direction of the correlation.
The R-squared value of the model is 0.77, indicating that approximately 77% of the variance in child food insecurity across Utah counties is explained by the model’s three predictors. This relatively high R-squared demonstrates that the core economic indicators selected for Model 1 capture a large portion of the county-level differences in food insecurity. Furthermore, the F-statistic was statistically significant, confirming the overall explanatory power of the model.
Model 1b
Model 1b was developed to assess whether food insecurity among children is significantly associated with the share of food insecure households that fall above the income threshold for SNAP eligibility. This regression model excludes those at or below the snap cutoff to explore how child food insecurity behaves when need exists among households not traditionally targeted by federal assistance. The model regresses county-level child food insecurity rates against two independent variables: the percentage of food insecure individuals whose household income is above the snap threshold and cost per meal.
The results indicate that the percentage of food-insecure individuals above the SNAP threshold is significantly and negatively associated with county level child food insecurity (β = –0.2517, p < 0.001). This suggests that counties where a greater share of food insecure individuals are ineligible for snap tend to have lower child food insecurity rates overall. This may reflect differences in access to alternative resources, greater stability among the near-poor, or the ability to bridge food gaps with private means–even in the absence of federal assistance.
The fact that higher shares of food insecure households that don’t qualify for SNAP corresponds with lower child food insecurity may also suggest that child hunger is more concentrated in counties where food insecurity is dominated by those with the lowest incomes who are more deeply disadvantaged despite qualifying for federal programs. The cost per meal variable was again negative but not statistically significant echoing previous models in suggesting that food prices alone do not predict child food insecurity when controlling for income related variables.
Model 1b demonstrated a strong overall fit with an R-squared of 0.765 indicating that over 76% of the variance in child food insecurity is explained by these predictors. While past studies have emphasized the protective role of food assistance programs for low-income families this model points to a gap in coverage for those just outside the eligibility threshold. It reinforces the need for more expansive policies that do not rely on income-based cutoffs to identify needs. Especially given that many food insecure children live in households that exceed those thresholds but still struggle to access sufficient nutrition.
Model 2
The results from Model 2 show that median household income is a statistically significant predictor of child food insecurity (β = –1.20e-06, p < 0.01), even when controlling for other factors. The negative sign confirms that counties with higher median incomes tend to have lower rates of child food insecurity which is consistent with existing literature linking family income with access to basic needs. This finding strengthens the argument that structural economic inequality at the county level is a key determinant of food access for children.
However other variables in the model such as unemployment rate and renter share were not statistically significant in this specification. Notably the coefficient for % FI < SNAP threshold was positive( β = 0.068) but not significant (p = 0.33), and the cost per meal remained insignificant as in previous models. Despite this the overall model fit was strong with an R-squared of 0.87 and a statistically significant F-test (p < 0.001), indicating that the full set of predictors accounts for a large share of the variation in food insecurity across counties.
Model 2b
To isolate the effects of other structural and program-relevant variables I estimated a second version of the model that excludes median household income. This adjustment allowed us to see whether unemployment, renter share, and poverty related food insecurity indicators would emerge as significant predictors on their own.
The results reveal that the unemployment rate becomes marginally significant (β = 0.47, p = 0.05), indicating that counties in Utah with higher unemployment tend to experience higher rates of child food insecurity. This aligns with federal research from the USDA which found that children in households with unemployed adults were three and a half times more likely to face food insecurity (2022). Additionally, the % FI < SNAP threshold variable becomes more pronounced and approaches significance (β = 0.138, p = 0.086), suggesting a potential link between concentrated economic hardship and child hunger when income effects are not directly included. Although no other individual variables reached conventional levels of statistical significance the overall model retained strong explanatory power (R-squared = 0.81).
These findings contribute to literature by confirming that income remains one of the most powerful predictors of food security even when other economic stressors like unemployment and rental housing share are considered. Removing income from the model revealed latent relationships between unemployment and food insecurity that are often masked in full economic models. This suggests that in lower income counties joblessness plays a critical role in shaping food outcomes for children.
From a policy perspective the shift in significance between model 2 and 2b reinforces the need to design multifaceted interventions which include both income supports (tax credits, job programs, ect) and direct food access policies like universal school meals. These results validate concerns that the school meals eligibility threshold at 185% of poverty of the poverty line excludes many children at genuine risk of food insecurity.
Model 3
The results of model 3 reveal that the percentage of food-insecure individuals below the SNAP threshold remains a key predictor (β = 0.173, p = 0.0569) with marginal significance at the 10% level. This finding is consistent with models 1 and 2b and reinforces the idea that extreme economic hardship is closely tied to food insecurity among children.
Additionally, the unemployment rate again approached significance (β = 0.503, p = 0.0788), continuing to suggest that local labor market conditions play an important role in shaping food insecurity risk. These findings echo national research that links parental joblessness with food hardship and economic precarity, especially among children (USDA, 2022).
However other variables–particularly those introduced in this model–were not statistically significant. The share of adults with less than a high school diploma (β = -0.197, p = 0.3181) and the English learner share (β = -0.0082, p = 0.9367) did not exhibit meaningful associations with county food insecurity in this specification. While these factors may still be important at the household level, their county-level effects were likely absorbed by stronger predictors like unemployment and SNAP eligible food insecurity.
The model’s performance remained strong with an R-squared of 0.82, indicating that the included predictors collectively explain over 80% of the variation in county level child food insecurity. This suggests that despite some individual coefficients lacking statistical significance the broader combination of economic hardship indicators and food program thresholds provide a powerful explanation of the spatial disparities in food insecurity across utah counties.
These results add nuance to existing literature by testing the relevance of educational attainment and language access barriers at a localized level. While prior studies have shown households headed by adults without high school degrees are far more likely to experience food insecurity this county level analysis found no such relationship when controlling for other factors. Similarly, while language barriers are often cited as barriers to benefit participation (Bartfeld, 2013), the inclusion of the English learner share variable did not improve model fit or predictive strength in this setting. The findings suggest that county level variation in food insecurity is better explained by direct measures of income and employment. Interventions aimed at boosting participation in food assistance programs like school meals should continue to focus on removing structural barriers like income thresholds and documentation requirements especially in communities with elevated unemployment or poverty rates.
Model 4
Model 4 centers on the relationship between child food insecurity and the demographic composition of student populations across Utah counties. Drawing on research that links racial and ethnic disparities to differences in food access, as well as evidence highlighting the vulnerability of children with disabilities, experiencing homelessness, or classified as economically disadvantaged, this model evaluates how these factors vary in predictive strength when measured at the county level. The full multivariate specification of model 4 includes shares of Hispanic, Black, and American Indian students, along with shares of students experiencing homelessness, students with disabilities, and those classified as economically disadvantaged. Among these the economically disadvantaged student share was statistically significant and positively associated with food insecurity (β = 0.277, p < 0.001). This suggests that counties with a higher proportion of economically disadvantaged students also experience substantially higher rates of child food insecurity, reinforcing well-documented links between low household income and reduced access to stable food sources.
None of the racial or ethnic demographic shares reached statistical significance in the full model. Several other variables such as homelessness (β = –0.164, p = 0.778) and disability (β = – 0.109, p = 0.683), exhibited unexpected negative or null associations. These results may reflect multicollinearity or the small number of counties used in the regression which can suppress individual significance when multiple vulnerable groups are included simultaneously.
To further examine the individual contribution of each variable a trimmed model excluding the economically disadvantaged share (Model 4b) was estimated. In this alternate model the disability share emerged as a significant predictor (β = 0.566, p = 0.047), which indicates that when not overshadowed by economic disadvantage the presence of students with disabilities correlates with higher levels of child food insecurity. This finding aligns with national research documenting higher food insecurity among households with children who have disabilities due to higher costs, reduced employment options for caregivers, and eligibility gaps in public benefits (Brucker et al., 2021).
A series of bivariate regressions provided additional insight. The American Indian student share, while not significant in the multivariate model, had a significant positive association with child food insecurity when tested alone (β = 0.178, p = 0.022). This result underscores the disproportionate food insecurity burden in Utah’s tribal communities–particularly important given the geographic concentration of tribal lands in more remote southeastern counties. This finding contributes to the broader literature of food insecurity disparities among indigenous populations (Jernigan et al. 2017).
Other racial and ethnic bivariate regressions, including Hispanic, Black, and White shares were not statistically significant. Notably the Pacific Islander student share showed a marginally significant negative association (β = -2.07, p = 0.083) suggesting potential differences in food security outcomes or community level factors not fully captured in this dataset. Similarly the Asian share had a negative association that approached significance (β = -2.23, p = 0.070). While these results should be interpreted with caution due to small population sizes they may reflect localized support systems or cultural factors that merit further investigation.
The bivariate model for the homeless student share revealed a significant and positive relationship with food insecurity (β = 0.466, p = 0.028), suggesting that when measured in isolation homelessness is indeed a relevant risk factor, though its predictive power was diminished when controlling for overlapping vulnerabilities in the multivariate model. The English Learner (ELL) share model did not show a significant association with food insecurity (p = 0.222), suggesting that language status alone may not be a strong determinant of food insecurity at the county level in Utah.
Taken together the results of model 4 and its bivariate extensions highlight the complex and overlapping nature of demographic vulnerability. While not all individual population groups reached significance in the full model, several including students with disabilities, and American Indian students, and students experiencing homelessness displayed clear positive associations with food insecurity when examined independently. These findings contribute to the literature by demonstrating that county level child food insecurity in Utah is shaped not only by economic conditions but also by the composition of student populations who face intersecting barriers to access, inclusion, and opportunity.
These results underscore the value of expanding universal school meal access as a strategy for reducing hunger across multiple vulnerable groups- not just those who qualify through conventional income thresholds. Additionally targeted outreach or supplemental support for districts with high concentrations of students with disabilities, tribal youth, and those experiencing homelessness could improve outcomes for populations at highest risk.
Model 5
Model 5 brings together the most inclusive set of explanatory variables synthesizing economic need, educational attainment, and demographic vulnerability into a single regression model. This comprehensive model was designed to capture the broader social determinants of child food insecurity by combining key economic indicators with county-level population characteristics. Specifically, the model includes the percentage of food-insecure individuals below the SNAP threshold, unemployment rate, cost per meal, renter share, educational attainment, and shares of American Indian, homeless, and disabled student populations.
The results of model 5 reveal that only one predictor–% food insecure below the SNAP threshold– is statistically significant at the 0.001 level (β= 0.2459, p < 0.001). This variable consistently emerges as the most robust predictor across all models reaffirming that counties with a larger proportion of extremely poor food-insecure residents experience substantially higher food insecurity rates. This finding underscores the central role that deep poverty plays in driving hunger among children, and aligns with prior research that emphasizes the heightened vulnerability of households near or below federal assistance thresholds.
Although the other variables in the model– such as unemployment rate, cost per meal, renter share, and educational attainment–are theoretically important and supported by the literature, they do not reach statistical significance in this specification. It is possible that some of their explanatory power is absorbed by the strength of the SNAP related poverty variable or that collinearity between predictors slightly suppresses their individual effects. For example, both educational attainment and unemployment are generally correlated with income levels and poverty status in most literature.
Interestingly, while the coefficient for unemployment remains positive suggesting that higher unemployment may increase food insecurity it is not statistically distinguishable from zero (p = 0.29). Similarly, the coefficient for cost per meal remains negative but not significant indicating that food prices may not directly drive food insecurity.
The inclusion of demographic vulnerability indicators– American Indian share, homelessness share, and disability share– adds depth to the model particularly given the importance of these groups in food insecurity literature. While these variables are not individually significant their inclusion helps assess whether disparities persist after controlling for structural economic conditions. Notably the direction of the coefficients aligns with expectations: higher disability share and American Indian share are positively associated with child food insecurity, though not significantly so in this model. The homelessness share shows a negative coefficient in this specification which is inconsistent with prior findings and may reflect collinearity in this fully saturated model.
The model fit is strong with an R-squared of 0.83 and adjusted R-squared of 0.76, indicating that over 76% of the variation in child food insecurity across counties is explained by the included variables. The RESET test returned a p value of 0.64, suggesting no specification errors and validating the mode’s functional form. Likewise, the Breush-Pagan test for heteroskedasticity yielded a p-value of 0.1495 providing no evidence of heteroskedasticity and supporting the reliability of OLS estimates.
Taken together the findings from Model 5 highlight the dominant role of poverty intensity particularly among those below the SNAP threshold in shaping child food insecurity rates in Utah counties. While other socioeconomic and demographic factors are important for contextualizing disparities, the model reinforces the literature’s emphasis on income based eligibility thresholds and adds further support for policies that extend food assistance beyond narrowly targeted income brackets. This finding bolsters arguments for universal school meal programs which can help mitigate gaps for those outside of eligibility cutoffs.
Panel Data Models
To complement the cross sectional models and examine changes over time I constructed a series of panel data models using county level observations from 2018 to 2022. These models leverage the balanced panel structure of 29 Utah counties over five years to assess whether increased participation in free and reduced price lunch programs is associated with changes in child food insecurity rates, while accounting for unobserved, time-invariant characteristics of each county.
The first model estimated was a fixed effects model focusing on county level variation over time. Surprisingly Free and Reduced Lunch Participation was not statistically significant in this model ( β= –0.038, p = 0.42). This result suggests that after controlling for all time invariant characteristics of each county changes in free and reduced lunch participation within counties were not strongly associated with short run changes in food insecurity during this period.
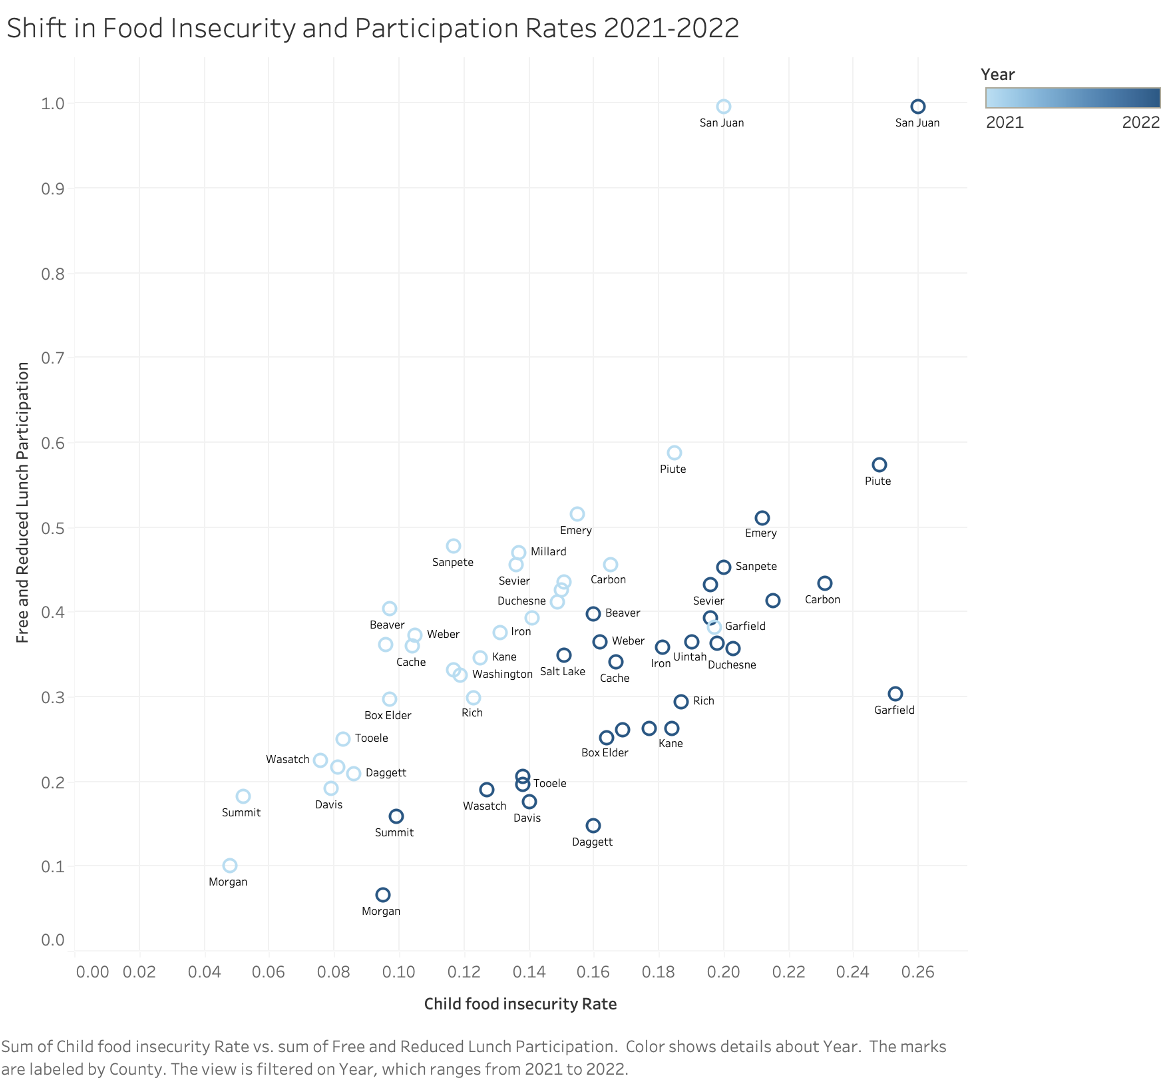
I then did a cross-sectional OLS model using data from the 2022 year alone. In this specification free and reduced lunch participation exhibited a highly significant positive association with child food insecurity(coefficient = 0.186, p < 0.001), explaining approximately 60 percent of variation across counties. While initially counterintuitive this result likely reflects the endogeneity of school lunch program participation, where higher levels of food insecurity motivate districts to intensify enrollment efforts. This finding also highlights the difficulty in separating causal effects from targeted program delivery in static cross-sectional data.
A pooled OLS model that combined all county-year observations without fixed effects similarly produced a statistically significant and positive coefficient for free and reduced lunch participation (0.189, p < 0.001). With an R-squared of 0.47 this model captured meaningful variation but failed to distinguish persistent differences between counties from within-county temporal changes.
The most informative specification included both county and year fixed effects. In this model the free and reduced lunch participation coefficient was statistically insignificant (0.055, p = 0.182) but the inclusion of year indicators revealed critical shifts across the five-year period. Notably the coefficient for 2021 was large, negative, and highly significant, indicating a substantial drop in food insecurity coinciding with the peak implementation of federal universal school meal waivers during the pandemic. In contrast, the 2022 coefficient was large and positive suggesting a significant rebound in food insecurity following the expiration of those waivers and the reversion to means-tested meal eligibility in many districts. These year specific trends suggest that universal access to school meals had a substantial short-term protective effect of child food insecurity, while its removal contributed to renewed hardship.
Together, the panel data models reveal important temporal dynamics that are not visible in cross-sectional analysis alone. While the fixed effects specification did not detect a robust within- county causal effect of participation on food insecurity, the sharp contrasts observed during and after the universal free meals period reinforce the broader literature emphasizing the value of universal programs. These results support recent national findings that temporary policy changes during the pandemic—including expanded access to school meals—produced tangible reductions in child hunger. Moreover, they suggest that narrowly targeted, means-tested models may leave substantial gaps in coverage, especially for children in households just above eligibility thresholds.
This longitudinal analysis contributes to the existing scholarship by grounding national trends in localized Utah data, offering rare insight into how state and county policy environments mediate program effectiveness. In doing so, the findings provide strong empirical support for policy frameworks that expand access universally, rather than relying solely on income-based eligibility criteria to address child food insecurity.
CONCLUSIONS
This thesis has examined the socioeconomic and demographic predictors of child food insecurity across Utah’s 29 counties, with particular attention to the role of school meal programs as both a stabilizing intervention and a potential long-term policy solution. Through a combination of cross-sectional OLS models and longitudinal fixed effects panel regressions, the analysis has generated several key findings that advance our understanding of local-level food insecurity and its relationship to school-based nutrition access.
Across multiple models, the most consistent and robust predictor of child food insecurity was the percentage of food-insecure individuals living in households below the Supplemental Nutrition Assistance Program (SNAP) income threshold. This finding underscores the severity of need among Utah’s poorest families and reaffirms that economic hardship remains the most immediate driver of food insecurity among children. However, the results also reveal a more nuanced picture. Model 1b showed that counties with a larger share of food-insecure households above the SNAP threshold tended to experience lower child food insecurity, suggesting that families just outside eligibility for federal programs may still benefit from other buffers—such as higher employment rates, stronger local supports, or expanded school meal access.
Models incorporating broader economic indicators revealed that median household income remained a significant predictor of food insecurity, while variables like unemployment rate, housing tenure, and cost per meal were less consistently predictive once income was accounted for. Demographic-based models further highlighted the vulnerabilities of specific populations.
While most racial and ethnic student share variables were not individually significant in multivariate models, the proportion of economically disadvantaged students was a strong and consistent predictor of higher food insecurity. Notably, American Indian student share was positively and significantlyassociated with child food insecurity in bivariate analysis, echoing national studies documenting elevated hunger rates among Indigenous communities. Shares of homeless and disabled students also showed positive and statistically significant associations with food insecurity, suggesting that school district-level data on student subpopulations can provide early indicators of food access challenges.
Panel models allowed for a dynamic analysis of school meal participation over time. Although fixed effects models did not detect a statistically significant relationship between increased free and reduced-price lunch participation and reductions in child food insecurity within counties, cross- sectional models showed a strong positive association—likely driven by targeted program expansion in high-need areas. Most importantly, year fixed effects revealed a dramatic drop in food insecurity during the peak of universal school meal waivers in 2021, followed by a notable rebound in 2022 once those federal waivers expired. This temporal pattern provides compelling evidence for the effectiveness of universal meal access, particularly during times of economic distress.
Taken together, these findings contribute to the existing literature by localizing national debates within the context of Utah’s unique demographic and policy landscape. They confirm many established associations—such as the links between poverty, unemployment, demographic background, and food insecurity—while also introducing new evidence on the limitations of narrowly targeted nutrition programs. The observed rebound in food insecurity after universal meals were removed raises critical questions about the sustainability and equity of current access models.
The policy implications of this research are clear. Programs like the National School Lunch Program are most effective when access is universal rather than contingent on narrow eligibility screens that may miss children in need. This thesis offers empirical support for recent legislative efforts in Utah to restore universal free school meals and highlights the importance of maintaining these supports beyond emergency contexts.
Future research should build upon these findings by incorporating household-level survey data to better assess the causal impact of school meal participation on child outcomes. I utilized county level estimations and census figures which likely weakened associations and suppressed significance. Using data that are direct survey responses from households would allow for more precise measurement of food insecurity and a richer analysis of its correlates. Additionally, exploring the intersection of food insecurity with transportation access, school district funding, and local food environments could further deepen our understanding of the structural determinants of hunger. As food insecurity continues to affect thousands of children across the state, data-driven, equity-centered policy solutions remain essential to ensuring that no child goes hungry.
Bibliography
Arteaga, I., & Heflin, C. (2014). Participation in the National School Lunch Program and food security: An analysis of transitions into kindergarten. Children and Youth Services Review, 47(Part 3), 224–230. https://doi.org/10.1016/j.childyouth.2014.09.014
Judi Bartfeld & Rachel Dunifon, 2006. “State-level predictors of food insecurity among households with children,” Journal of Policy Analysis and Management, John Wiley & Sons, Ltd., vol. 25(4), pages 921-942.
Chaparro, M. P., Cruthirds, S., Bell, C. N., & Wallace, M. E. (2022). State-level socioeconomic racial inequity and food insecurity in the U.S. American Journal of Preventive Medicine, 63(6), 971–978. https://doi.org/10.1016/j.amepre.2022.06.019
Coleman-Jensen, A., McFall, W., & Nord, M. (2013). Food insecurity in households with children: Prevalence, severity, and household characteristics, 2010–11 (EIB-113). U.S. Department of Agriculture, Economic Research Service.
Gundersen, C., & Kreider, B. (2009). Bounding the effects of food insecurity on children’s health outcomes. Journal of Health Economics, 28, 971–983.
Gundersen, C., Kreider, B., & Pepper, J. (2012). The impact of the National School Lunch Program on child health: A nonparametric bounds analysis. Journal of Econometrics, 166, 79–91.
Huang, J., Kim, Y., & Barnidge, E. (2016). Seasonal difference in National School Lunch Program participation and its impacts on household food security. Health & Social Work, 41(4), 235–243. https://doi.org/10.1093/hsw/hlw043
Huang, J., Matta Oshima, K., & Kim, Y. (2010). Does food insecurity affect parental characteristics and child behavior? Testing mediation effects. Social Service Review, 84(3), 381–401.
Jernigan, V. B. B., Huyser, K. R., Valdes, J., & Simonds, V. W. (2017). Food insecurity among American Indians and Alaska Natives: A national profile using the Current Population Survey–Food Security Supplement. Journal of Hunger & Environmental Nutrition, 12(1), 1–10. https://doi.org/10.1080/19320248.2016.1227750
Kabbani, N. S., & Kmeid, M. Y. (2005). The role of food assistance in helping food insecure households escape hunger. Review of Agricultural Economics, 27(3), 439–445.
Parkinson, R. (2024, November 8). The Cold Truth of Hunger in Utah . Utah Food Bank. https://www.utahfoodbank.org/2024/11/08/the-cold-truth-of-hunger-in-utah/
Sonik, R., Parish, S. L., Ghosh, S., & Igdalsky, L. (2016). Food insecurity in U.S. households that include children with disabilities. Exceptional Children, 83(1), 42–57. https://doi.org/10.1177/0014402916651847
Fafard St-Germain, A. A., & Tarasuk, V. (2020). Homeownership status and risk of food insecurity: examining the role of housing debt, housing expenditure and housing asset using a cross-sectional population-based survey of Canadian households. International journal for equity in health, 19(1), 5. https://doi.org/10.1186/s12939-019-1114-z
USDA. (2025, January 8). Food security in the U.S. – key statistics & graphics. Food Security in the U.S. – Key Statistics & Graphics | Economic Research Service. https://www.ers.usda.gov/topics/food- nutrition-assistance/food-security-in-the-us/key-statistics- graphics#:~:text=7.2%20million%20children%20lived%20in,experienced%20very%20low%20food% 20security.
APPENDIX
Model 1:
Child.Food.Insecurity.Rate = β₀ + β₁(% FI ≤ SNAP Threshold) + β₂(% FI Children <185% FPL) + β₃(Cost Per Meal) + ε
Model 1b:
Child.Food.Insecurity.Rate = β₀ + β₁(% FI > SNAP Threshold) + β₂(Cost Per Meal) + ε
Model 2:
Child.Food.Insecurity.Rate = β₀ + β₁(% FI ≤ SNAP Threshold) + β₂(FI Children <185% FPL) + β₃(Cost Per Meal) + β₄(Median Household Income) + β₅(Unemployment Rate) + β₆(Renter Rate) + ε
Model 2b:
Child.Food.Insecurity.Rate = β₀ + β₁(% FI ≤ SNAP Threshold) + β₂(FI Children <185% FPL) + β₃(Cost Per Meal) + β₄(Unemployment Rate) + β₅(Renter Rate) + ε
Model 3:
Child.Food.Insecurity.Rate = β₀ + β₁(% FI ≤ SNAP Threshold) + β₂(FI Children <185% FPL) + β₃(Cost Per Meal) + β₄(Unemployment Rate) + β₅(Renter Rate) + β₆(% Less Than HS Diploma) + β₇(English Learner Count) + ε
Model 4:
Child.Food.Insecurity.Rate = β₀ + β₁(Hispanic Share) + β₂(Black Share) + β₃(American Indian Share) + β₄(Homeless Share) + β₅(Disability Share) + β₆(Economically Disadvantaged Share) + ε
Model 4b:
Child.Food.Insecurity.Rate = β₀ + β₁(Hispanic Share) + β₂(Black Share) + β₃(American Indian Share) + β₄(Homeless Share) + β₅(Disability Share) + ε
Model 4 Bivariate:
Child.Food.Insecurity.Rate = β₀ + β₁(Group Share) + ε
Model 5:
Child.Food.Insecurity.Rate = β₀ + β₁(FI ≤ SNAP Threshold) + β₂(Unemployment Rate) + β₃(Cost Per Meal) + β₄(Renter) + β₅(Less than HS Education) + β₆(Am Indian Share) + β₇(Homeless Share) + β₈(Disability Share) + ε
Panel Data Models:
Panel Model 1 – County Fixed Effects
Child.Food.Insecurity.Rate = β₀ + β₁(Free and Reduced Lunch Participation) + County Fixed Effects + ε
Panel Model 2 – Cross-Sectional OLS (2022 Only)
Child.Food.Insecurity.Rate = β₀ + β₁(Free and Reduced Lunch Participation) + ε
Panel Model 3 – Pooled OLS (No Fixed Effects)
Child.Food.Insecurity.Rate = β₀ + β₁(Free and Reduced Lunch Participation) + ε
Panel Model 4 – County and Year Fixed Effects
Child.Food.Insecurity.Rate = β₀ + β₁(Free and Reduced Lunch Participation) + County Fixed Effects + Year Fixed Effects + ε
Panel Model 5 – Year Fixed Effects Only (OLS)
Child.Food.Insecurity.Rate = β₀ + β₁(Free and Reduced Lunch Participation) + Year Fixed Effects + ε
