John and Marcia Price College of Engineering
11 Tilt Boards and Snow Fracture Mechanics
Dominic Alei-Gonzalez and Jack Eskeland
Faculty Mentor: Eric Pardyjak (Mechanical Engineering, University of Utah)
Abstract
Understanding how snow fractures is a critical element in predicting the stability and strength of a given snowpack. The tilt boards used by practitioners to analyze snowpack provide rough estimates of the strength and location of weak layers, are sub- ject to variability, and allow for potentially inaccurate stability assessments. Current tilt board tests outlined by the Snow, Weather, and Avalanche Guidelines (SWAG) in- volve removing a specimen of snow with a shovel and tapping it with varying amounts of force in order to cause fracture. The force used in these tests is exerted by the observer’s hand, which lacks repeatability and precision. The main objective of this project is to design and build a tilt board that controls the variables that introduce inconsistency in the current testing procedure.
Keywords: tilt boards, snow stability, avalanches
1 Background
1.1 General Considerations
Avalanches and snow instability are one of the leading safety concerns for mountain towns, ski areas, and back country recreation. Forecasting strength and avalanche stability has significant challenges because of the variability in terrain, atmospheric conditions, and other inconsistencies. Current prediction methods provide somewhat accurate forecasts but also contain significant error that negatively impacts the economy and contributes to back country fatalities. The current methods to forecast avalanches involve digging snow pits which are labor intensive and only analyze a specific portion of the snowpack. While this method has been perfected and can generate relatively accurate snowpack models, inconsistencies still exist. During the process of analyzing a snow pit many tests are completed in order to generate a stability model, one of them being a tilt board test which is used to simulate failure and locate persistent weak layers. The procedure as outlined in the SWAG guidelines includes removing a section of snow and placing it on a tilted board. The snow specimen is then subject to increasing amounts of force until the point of failure [2]. Failure in a snowpack simply means that the friction between layers is overcome and separation occurs. The standard tilt board testing method contains inconsistency in the force transmitted to the board since it is done through the observers wrist, arm, and shoulder. Creating a device that would more accurately transmit the force would decrease variability and allow for more accurate snowpack analysis to occur. There are two main design considerations that must be taken into account in order to build a tilt board that will significantly improve the repeatability and preciseness of this form of snowpack analysis.
The first consideration is a measurable and repeatable way to transmit the force. Second, the tilt angle of the board must be accurate and repeatable. According to the SWAG guidelines [2], 30° is the best angle to use for these tests. Testing at 30° is well within the fracture zone [1] and is a common angle for skiers to descend at. Lastly, when observing failures on the tilt board, cocoa powder can be used to help with the visual observation of the cracks. Before force is applied to the board, cocoa powder will be applied to the side of the column. When failure occurs the compression will cause an accumulation of cocoa powder directly at the crack. This will enable more precise measurements to be taken as well as show the geometry of the crack both of which add to the usefulness of the data.
1.2 Snow Fracture Mechanics
The current mixed-mode anti crack model [1] suggests that the volumetric change from the accumulation of snow causes a failure in compression and then because of the presence of persistent weak layers, a failure in shear follows [1]. Bair’s paper defines a persistent weak layer as one that has not metamorphosed into round and faceted snow crystals that tend to be more stable [1]. The tilt boards will help to determine fracture mechanics specifically in new snow. In addition to testing a tilt board a level board will be used to compare failure results. If a failure happens at roughly the same spot on both boards there is a higher likelihood that the failure happened from a combination of shear and compression rather than just shear. Additionally, the tests will hopefully give insight into the presence of persistent or nonpersistent weak layers in new snow that depend on atmospheric conditions during the time of the new snow.
1.3 Existing Tilt-Board Technologies
Existing tilt boards have been used to evaluate snow instabilities in the general avalanche forecasting world as well as in the experimental field like the one used alongside the Dif- ferential Emissivity Imaging Disdrometer (DEID) as shown in Figure 1 [5]. The DEIDis a device that is able to calculate the mass, density, and crystal type of hydrometeors by using a thermal camera and aluminum hot plate.
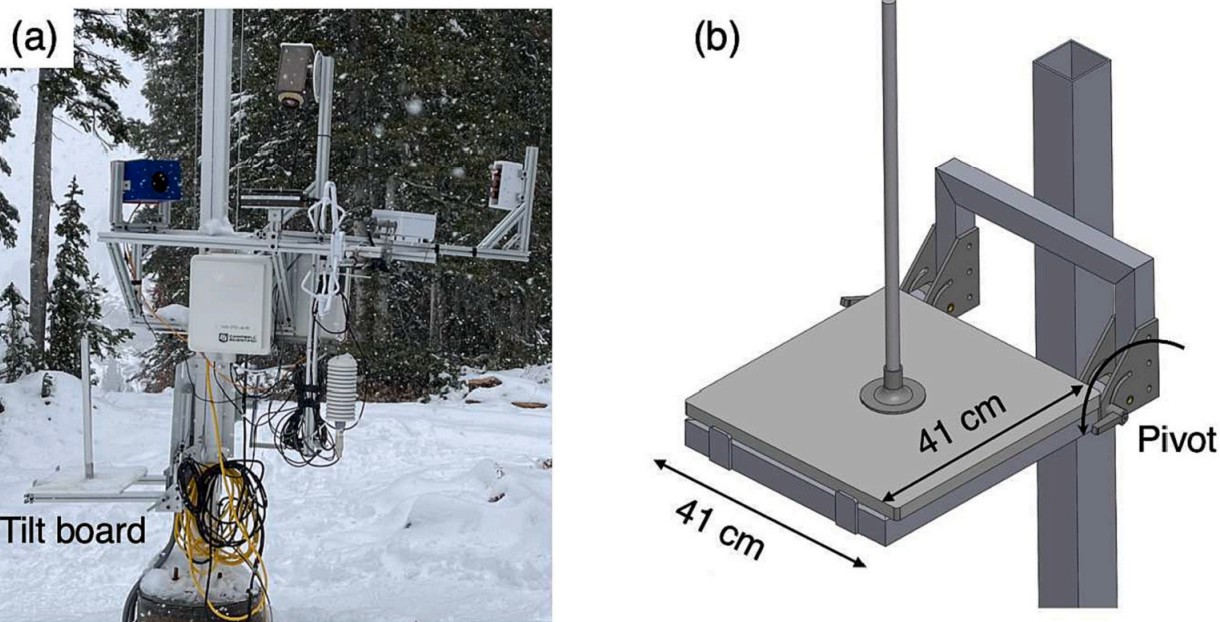
Figure 1: (a) Photograph showing the DEID in the field and a tilt board used to validate weak layers in the snowpack identified by the DEID. (b) CAD rendering of the basic tilt- board design. Figure used from [4].
The difference in emissivity of the snowflake and aluminum allows for a ‘thermal footprint’ to be seen by the camera. The assumption that the heat loss from the snowflake directly correlates to the heat gained by the aluminum plate enables the thermal mass of the snowflake to be calculated [5]. In addition to calculating individual hydrometeor properties it is also able to calculate continuous precipitation quantities [5]. After collecting this information a Stability Index (SI) can be calculated which helps predict whether or not failure will occur [5]. In order to cross reference the position of weak layers that the DEID calculates, a tilt board was used [4]. The tilt board as shown in Figure 1 is very similar to the standardized one outline by the SWAG. However, because of the inconsistencies in the force transfer from manual hand taps to the board, it is challenging to be sure that the data from this tilt board is reliable. Additionally, some design aspects of the board, like the central pole used to grab the board, leave room for error in the uniformity of the accumulated snowpack. Furthermore, the tilt board must be removed from the snowpack causing high likelihood for disturbances. With the new tilt board the snowpack can be minimally altered by leaving the entire board at the level of the snowpack. The fully level surface also ensures that there are naturally occurring stress concentrations rather than introducing potential hot spots by the addition of a central rod.
2 Design
2.1 Tilt Board Design
Based on the SWAG guidelines for tilt-board tests there are a few preexisting design considerations that must be taken into account. The first is being that the dimensions of the board must be roughly 30 cm by 30 cm. Second, the tilt angle of board that is used in the SWAG guidelines is 30°. These design constraints were developed in The Avalanche Handbook [3]. Figure 2a shows a schematic of the tilt board and Figure 2b shows the real tilt board that meets the design considerations.
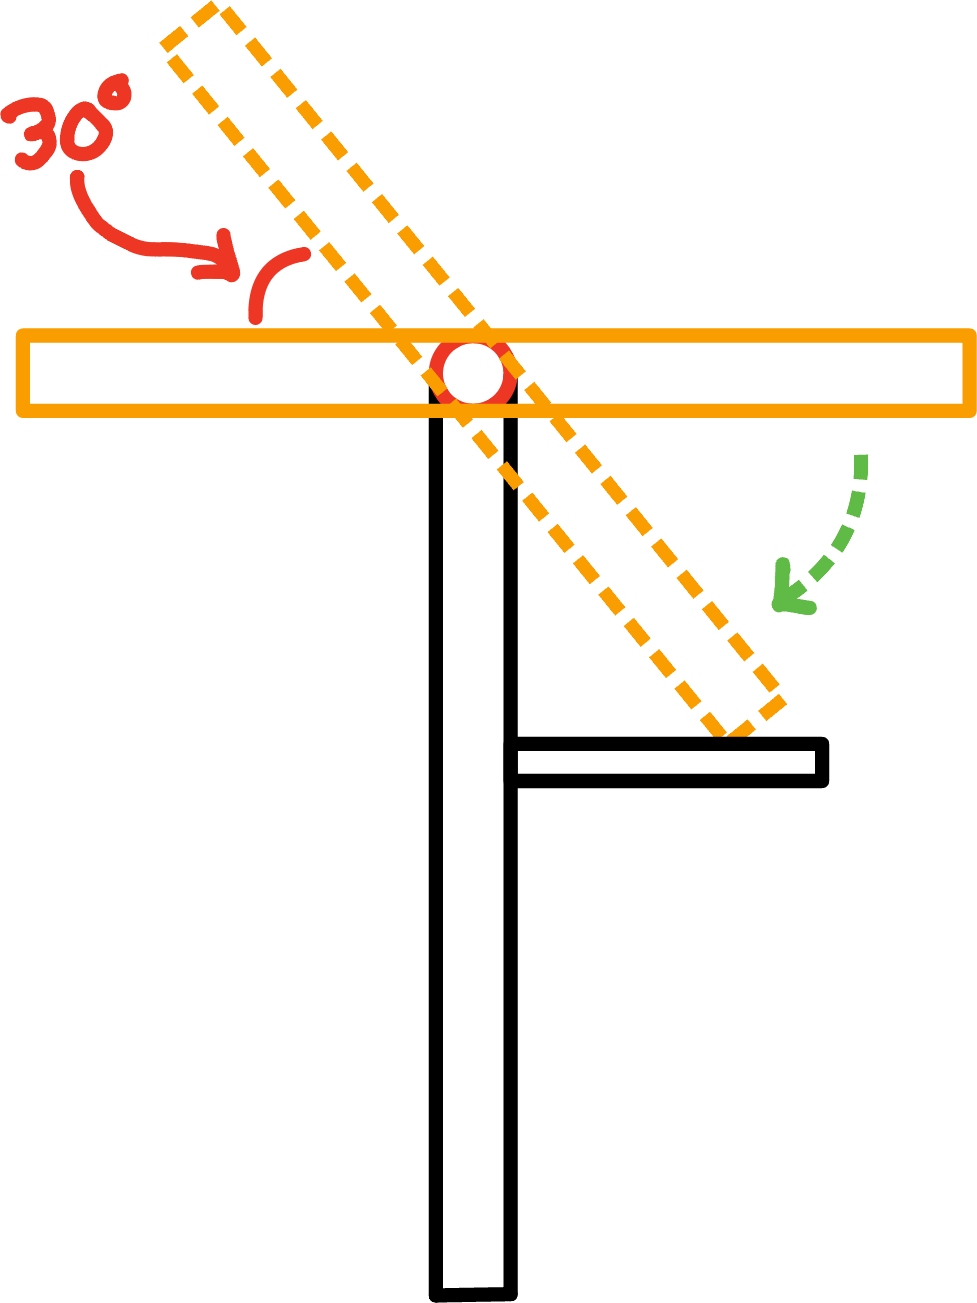
Figure 2a: Tilt Board Schematic showing the articulation of the tilt board.
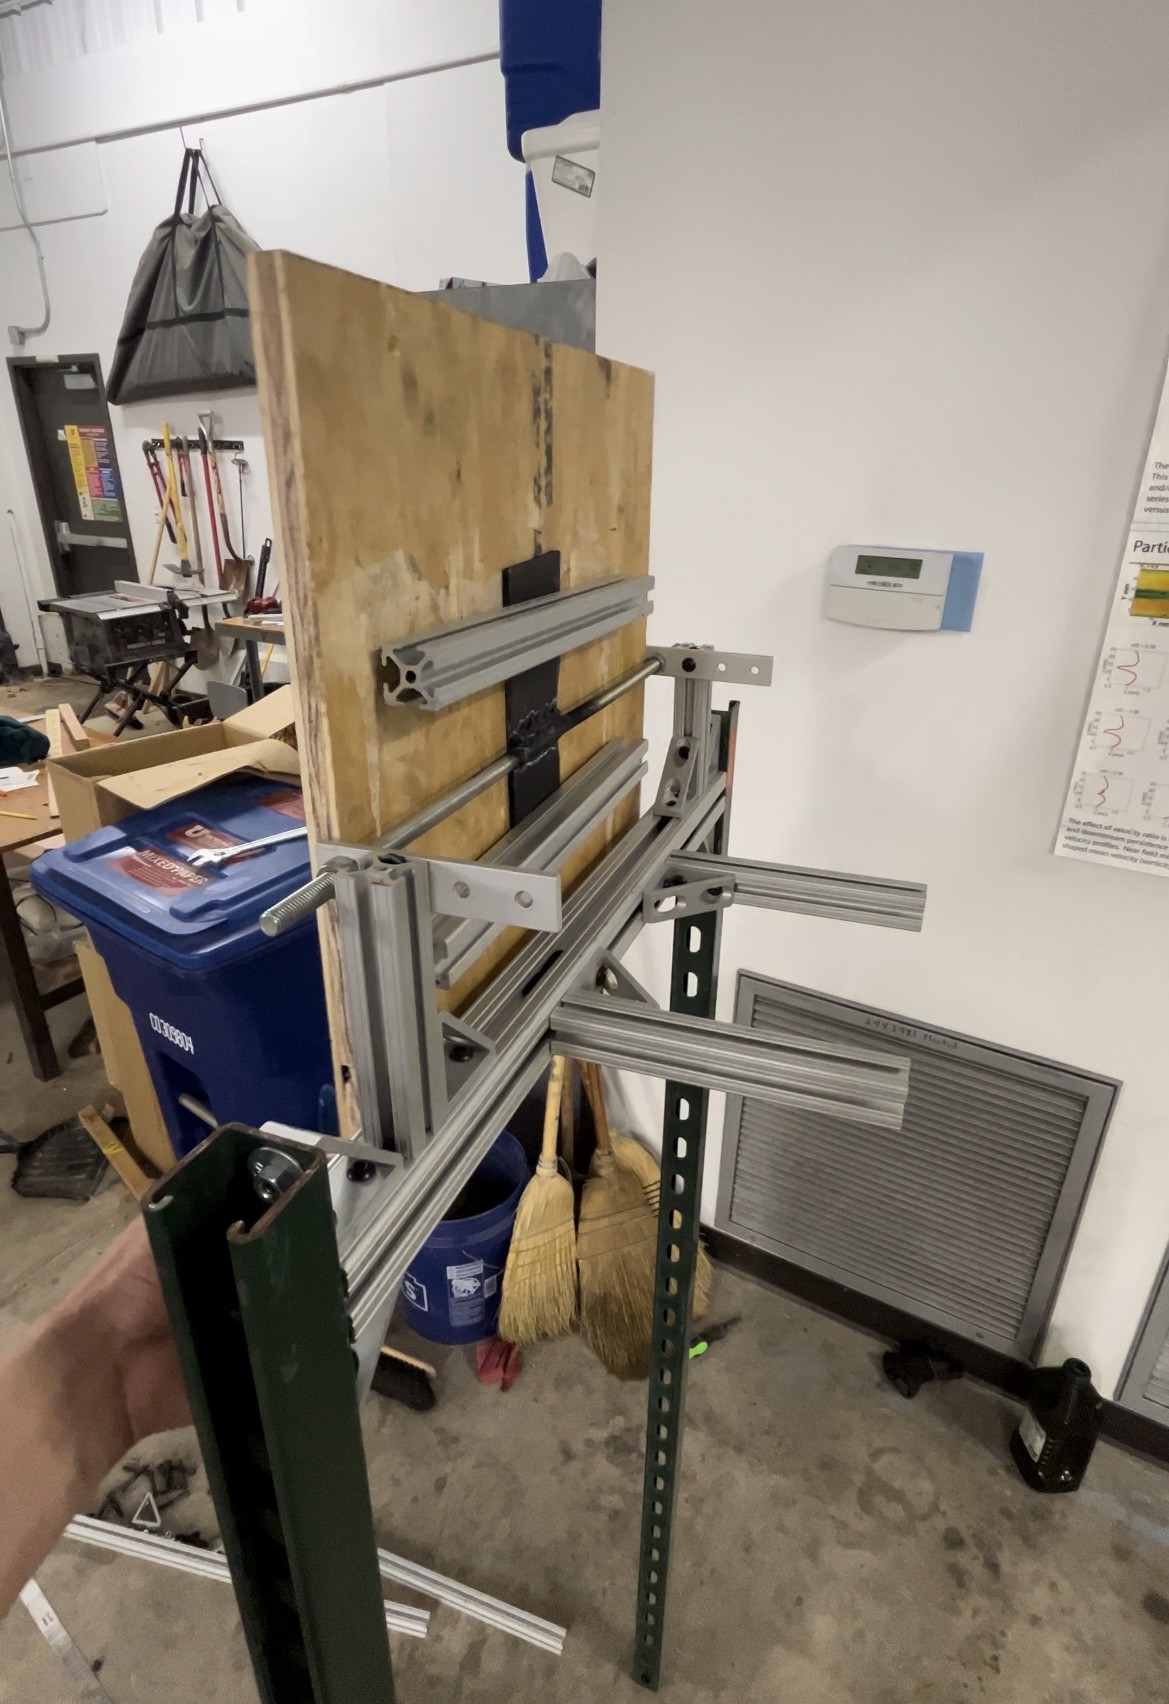
Figure 2b: Photograph showing a protoype of the tilt board and holding frame prototype in vertically oriented position tested in the laboratory.
The nuts on the long threaded bolt can be tightened to hold the board level when snow is accumulating on it and loosened when the board needs to be tilted to perform a test. The two pieces of 8020 that stick out directly from the lower member, allow the board to rest at 30° from level. The threaded rod running parallel to the lowermost cross member is positioned such that the board rotates in one plane, and is not slanted when rested at 30°.
2.2 Level Board Design
In addition to a tilt board, a level board was constructed in order to cross reference the failure points. The level board is exactly the same as the tilt board but is unable to tilt. Failure on a level board, would correlate to the persistent weak layer failing due to compression. The exact mechanics of the failure on the tilt board are unknown at this time, but are hypothesized to be a result of shear and compression. Comparing the height of the failure on both boards will provide insight into whether the fracture was due to shear, compression, or a combination of both.
2.3 Known Force Transmitting Mechanism (KFTM)
In order to transmit a repeatable, known, and significant force to the board, the Known Force Transmitting Mechanism was designed and fabricated. Figure 3 shows a CAD model of the KFTM. This mechanism deflects the spring in a straight line that is perpendicular to the surface of the tilt board which ensures that the spring constant that was calculated can be applied to this device.
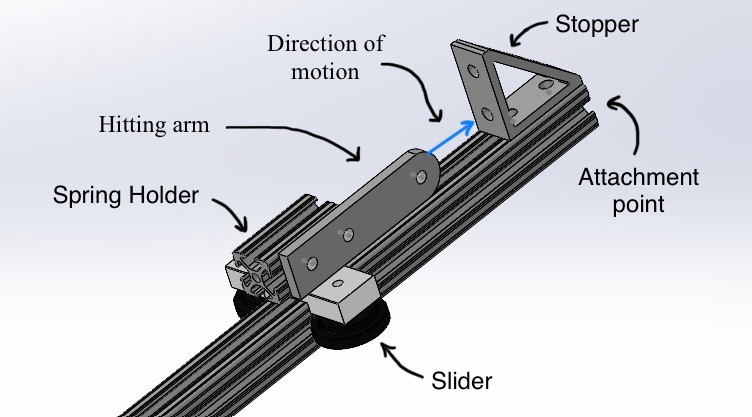
Figure 3: CAD rendering of KFTM prototype.
To use the KFTM, the operator must first deflect the spring to the set markings on the main rail and then release it. The KFTM has three levels of force that it is able to transfer into the board. These levels are meant to roughly simulate the force that would be transferred from a tap at the wrist, elbow, and shoulder in a standard Extended Column Test (ECT) by an avalanche forecasting practitioner as outlined in the SWAG guidelines. Figure 4 shows the KFTM with the spring slightly deflected. The piece of 8020 that runs parallel to the central rod is attached to a linear bearing that has negligible friction. When the spring is deflected and released, the piece of 8020 acts as a hammer and transmits a force to the tilt board. Markings on the central piece of 8020 ensure that the same force is being transmitted to the tilt board on each trial. In order to transmit a wide range of forces the spring can be swapped out easily so that the force can be additionally controlled by the spring constant.
2.4 KFTM – Force Calibration
In order to properly calibrate the force being applied to the tilt board using the KFTM, it was necessary to collect data from the current testing method. The quantification of a wrist tap, elbow tap, and shoulder tap was conducted by Toft and Verplanck [6], however there was a very high standard deviation of the force that the 2500 avalanche professionals exerted onto their force transducer. As a result of the variability in their results, we were not confident in using their data directly.
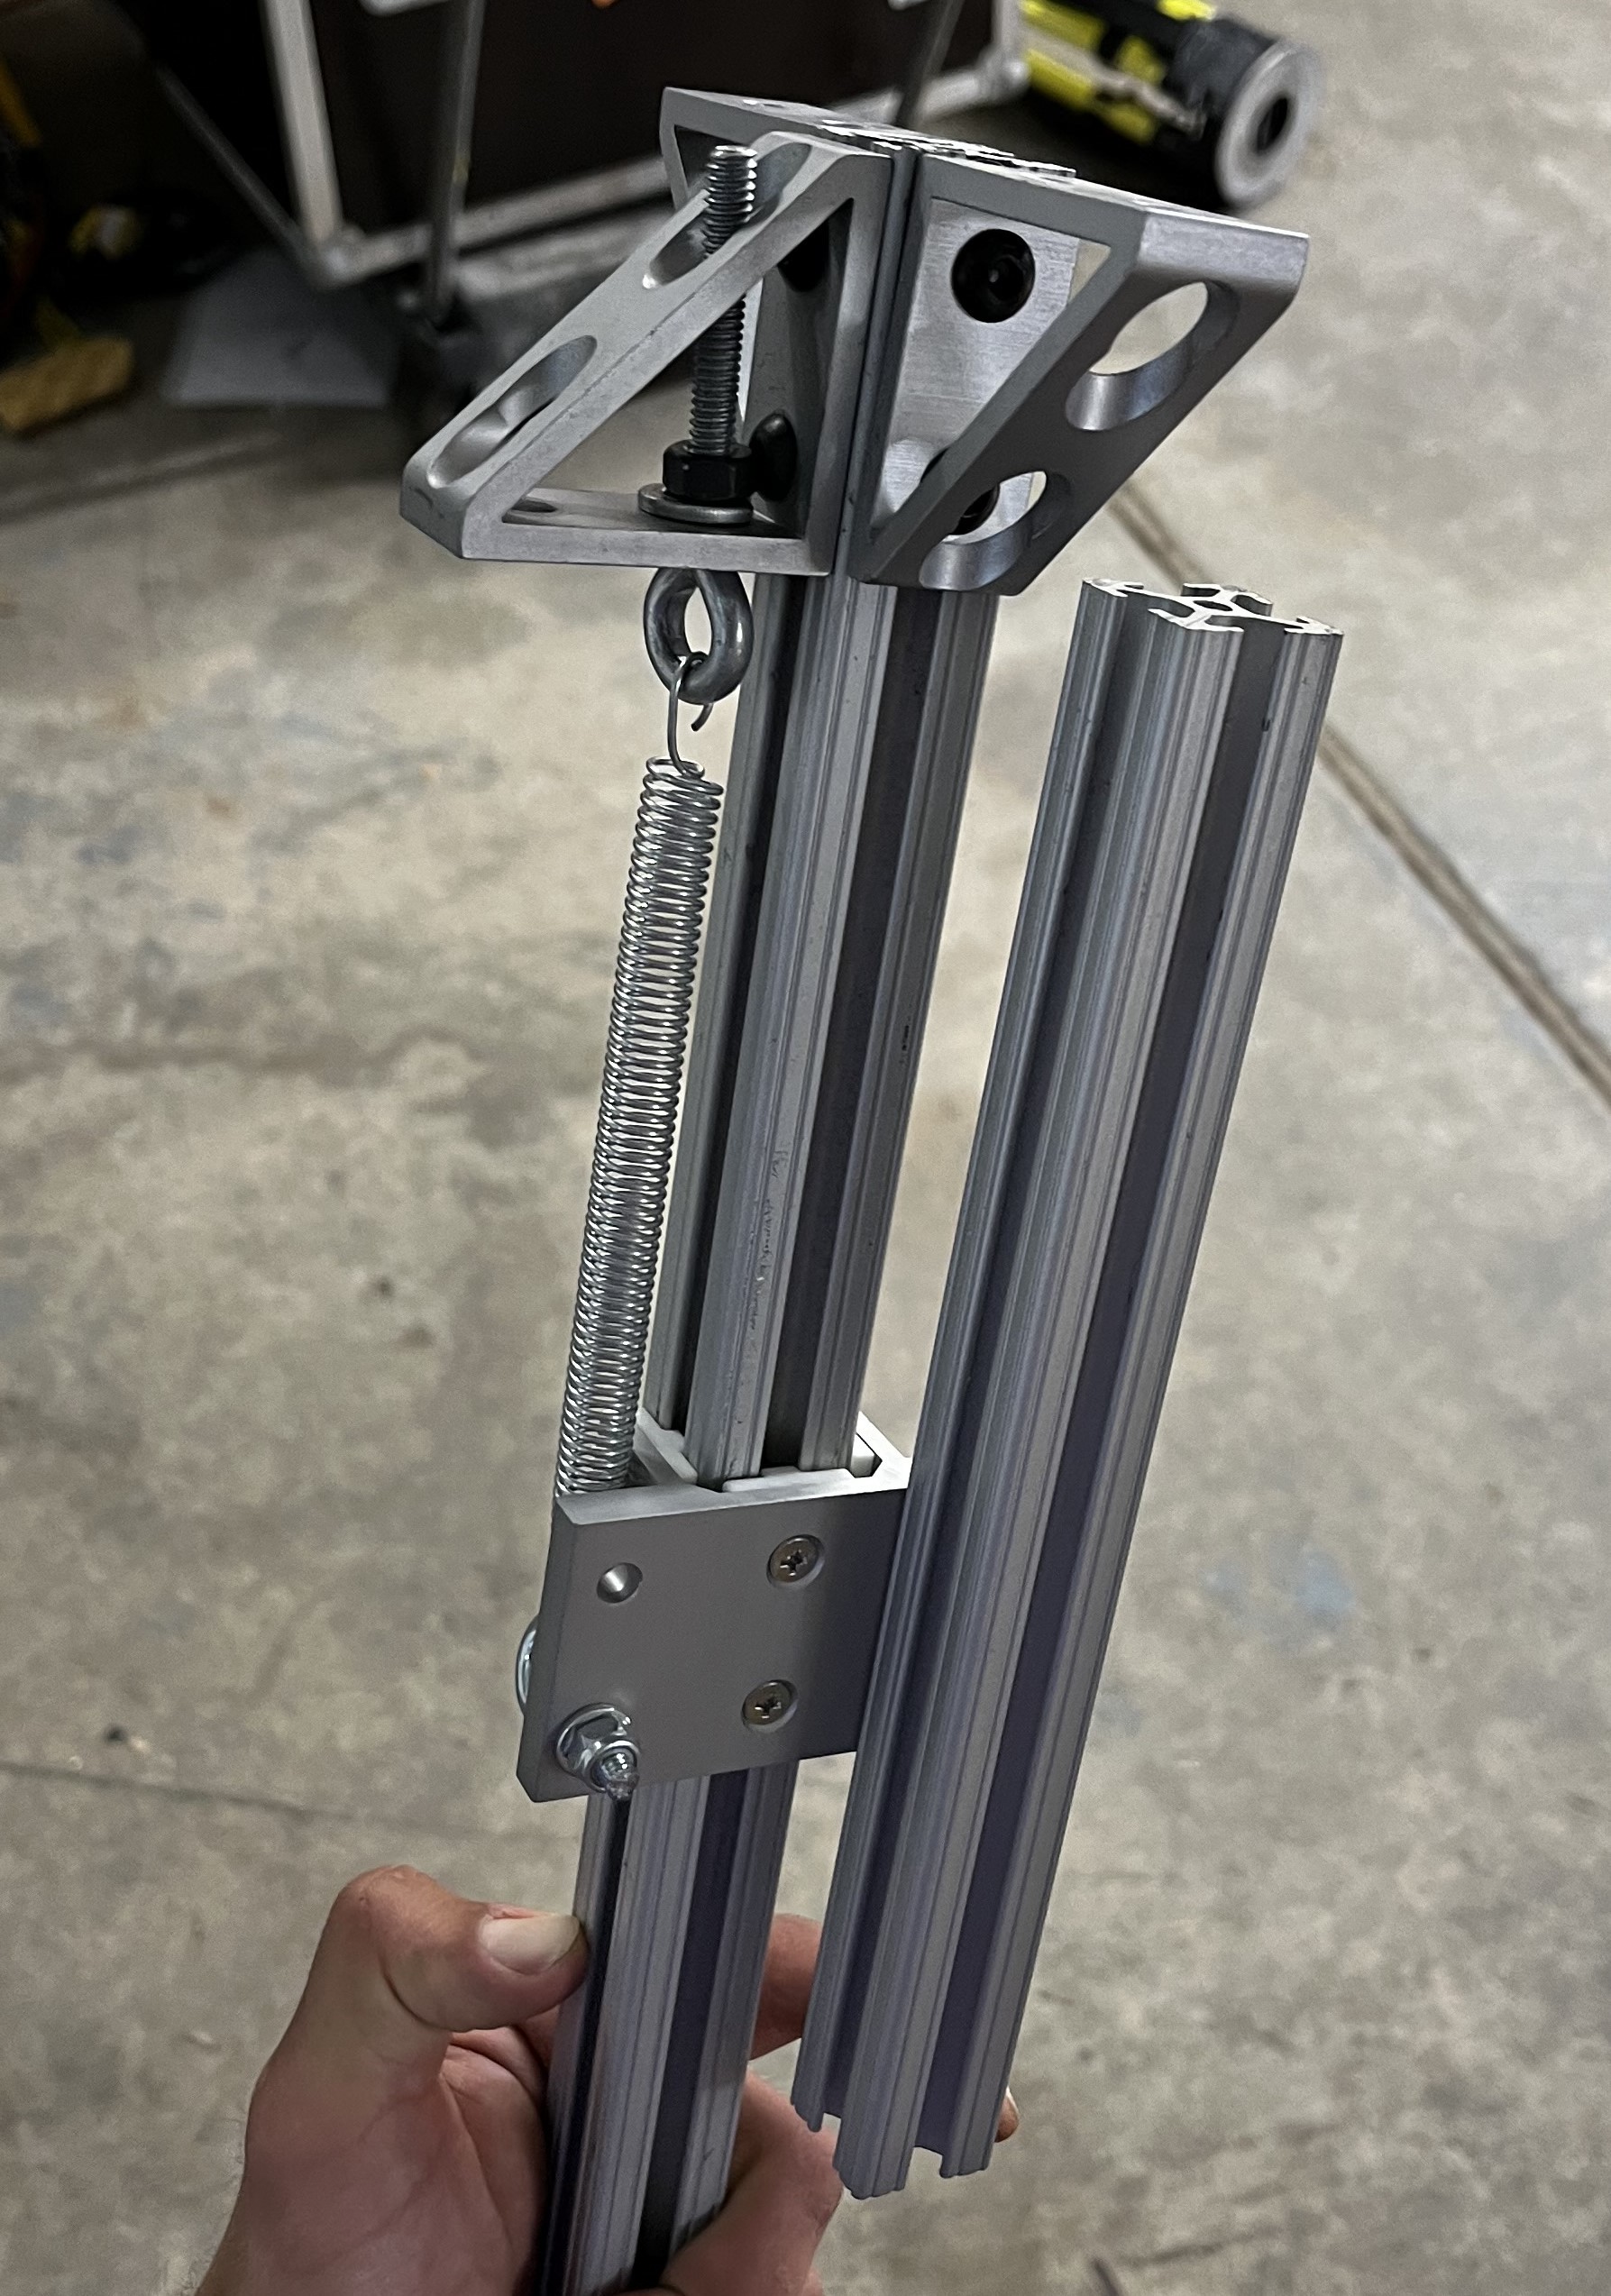
Figure 4: Photograph of the first physical prototype of the KFTM
We decided to conduct a pilot study to quantify human taps ourselves. In this experiment, a force transducer was used to collect time series data of force from six individuals who had prior experience conducting ECTs. From that data, peak forces were identified and used to calculate a mean and standard deviation of wrist, elbow, and shoulder taps. Figure 5 is an example of the raw time series data that was collected from one individual. Since peak force is the main quantity of interest, the ten peaks have been averaged together and that value is shown by the red line. Figure 6 shows the box plot for the same individual with quartile 1, quartile 3, and the mean visualized.
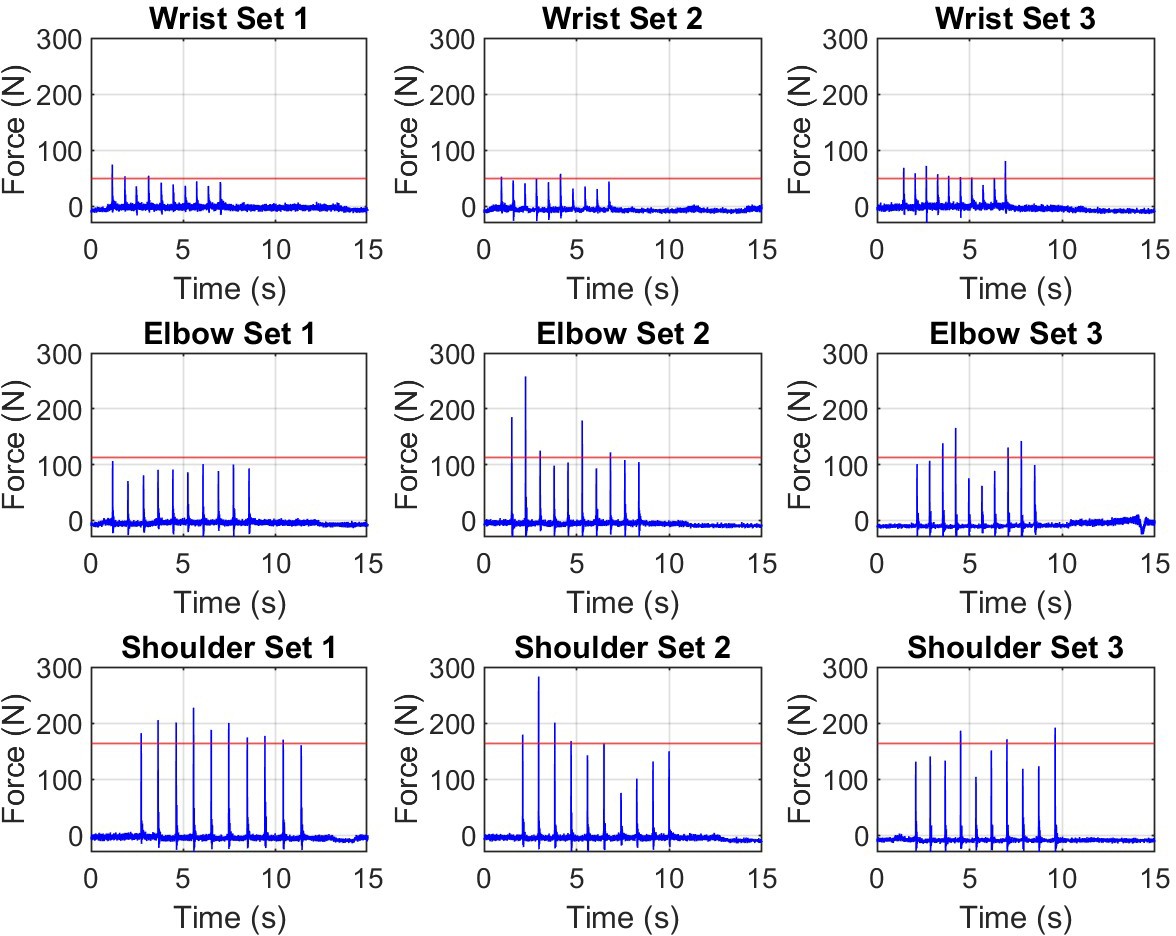
Figure 5: Graph of raw data gathered from force transducer for an individual. Average of max force shown indicated with red line. Set refers to the individual groups of ten taps.
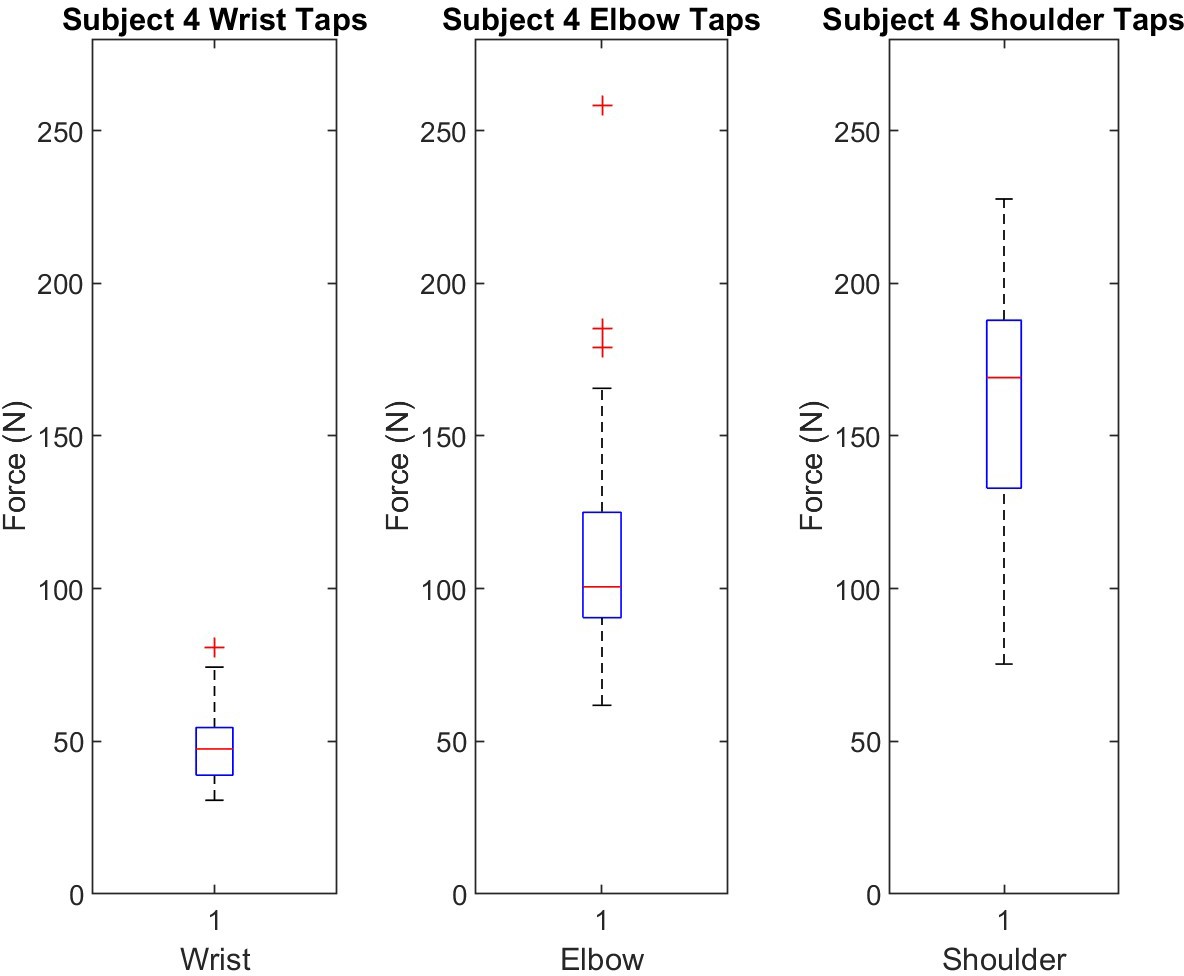
Figure 6: Box plot from same individual. Quartile 1, quartile 3, and the mean is shown as well as outliers.
After all peak forces were isolated from the subjects, the grand mean and standard deviation of wrist, elbow, and shoulder taps were calculated and the results are shown in Table 1. In addition, the individual means and standard deviations of each subject were calculated and are presented in Table 2.
Table 1: Mean and standard deviation of wrist, elbow, and shoulder taps for all subjects.
|
Tap Type |
Grand Mean (N) |
Grand SD (N) |
|
Wrist |
87.9 |
47.7 |
|
Elbow |
188.5 |
147.8 |
|
Shoulder |
244.1 |
193.4 |
Table 2: Mean and standard deviation of wrist, elbow, and shoulder taps for individual subjects.
|
Subject |
Wrist |
Wrist |
Elbow |
Elbow |
Shoulder |
Shoulder |
|
Number |
Mean (N) |
SD (N) |
Mean (N) |
SD (N) |
Mean (N) |
SD (N) |
|
1 |
164.3 |
42.0 |
459.2 |
184.3 |
611.8 |
219.8 |
|
2 |
116.3 |
24.4 |
130.1 |
19.7 |
149 |
28.9 |
|
3 |
52.1 |
11.1 |
113.6 |
34.1 |
193.3 |
47.2 |
|
4 |
49.0 |
12.8 |
113.0 |
40.3 |
164.4 |
41.7 |
|
5 |
62.4 |
16.9 |
168.9 |
62.9 |
211.6 |
67.4 |
|
6 |
83.3 |
24.1 |
146.4 |
22.6 |
134.5 |
35.2 |
2.5 KFTM – Spring Analysis
In order to accurately calculate the force that will be applied to the board from the spring mechanism, the spring constant must be known. An experiment to calculate the spring constant was conducted, and the results are shown below. In this experiment, a variety of weights were hung from the two springs and the displacement was measured as shown in Figure 7a and 7b.
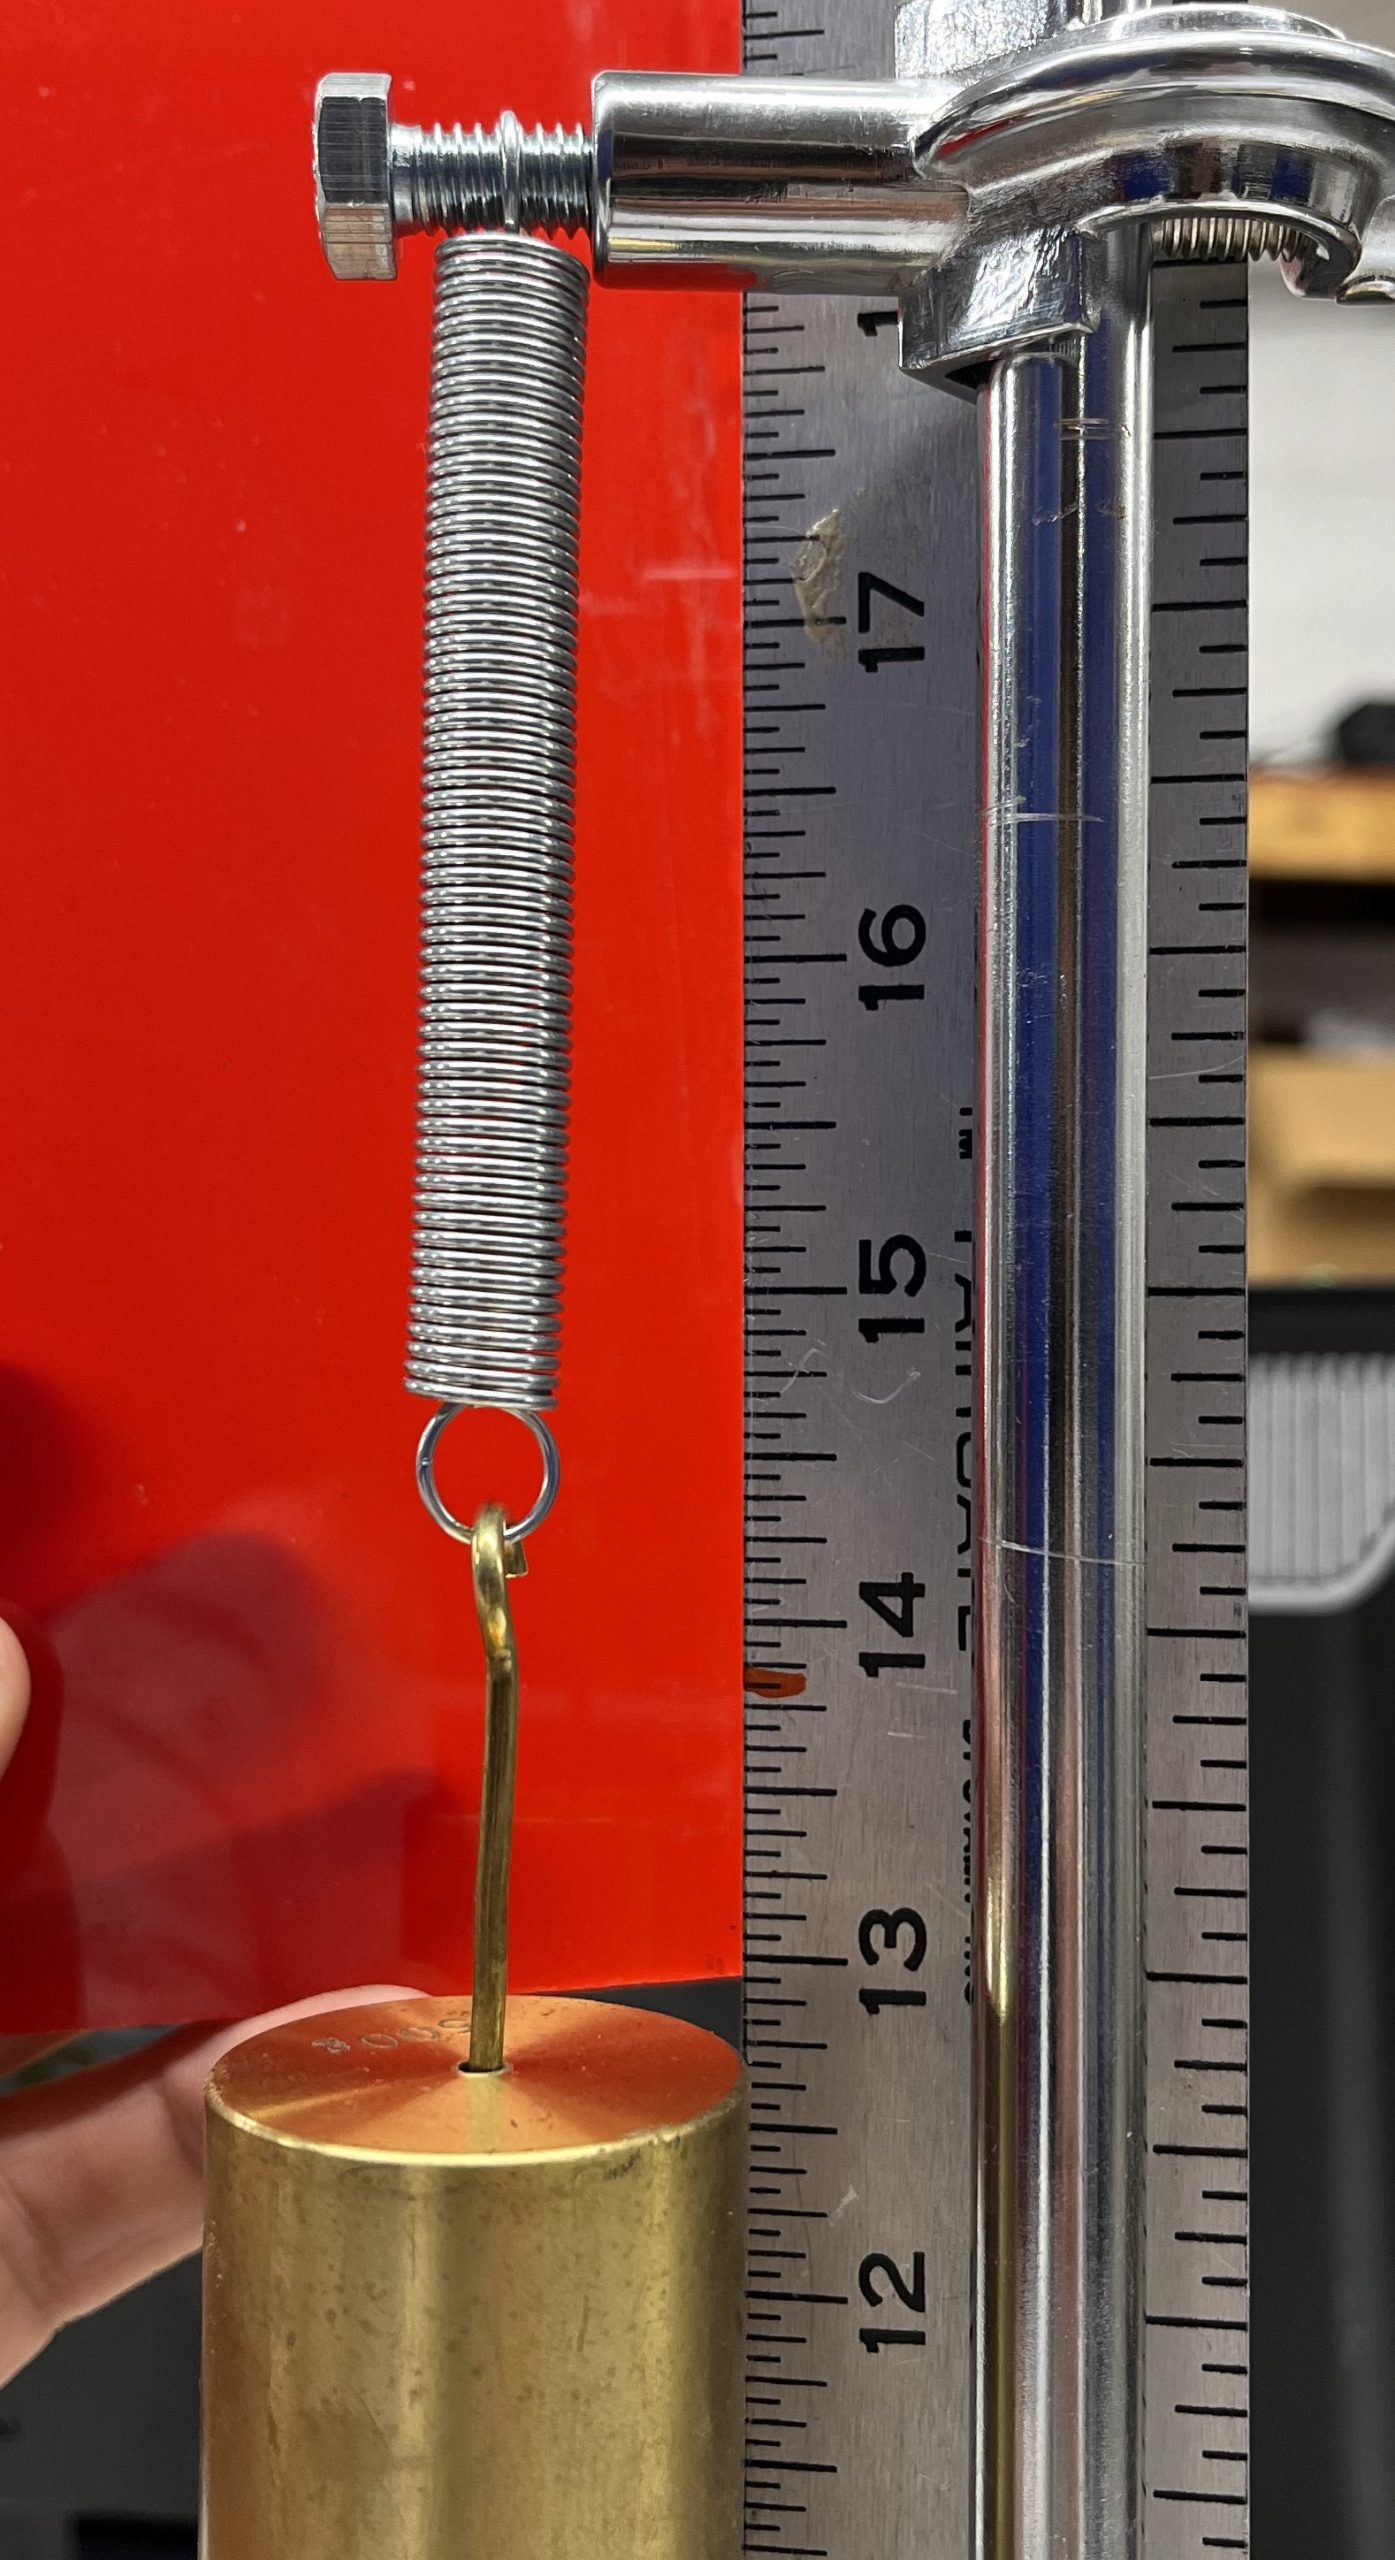
(a) Lighter spring’s dis- placement under 500 g
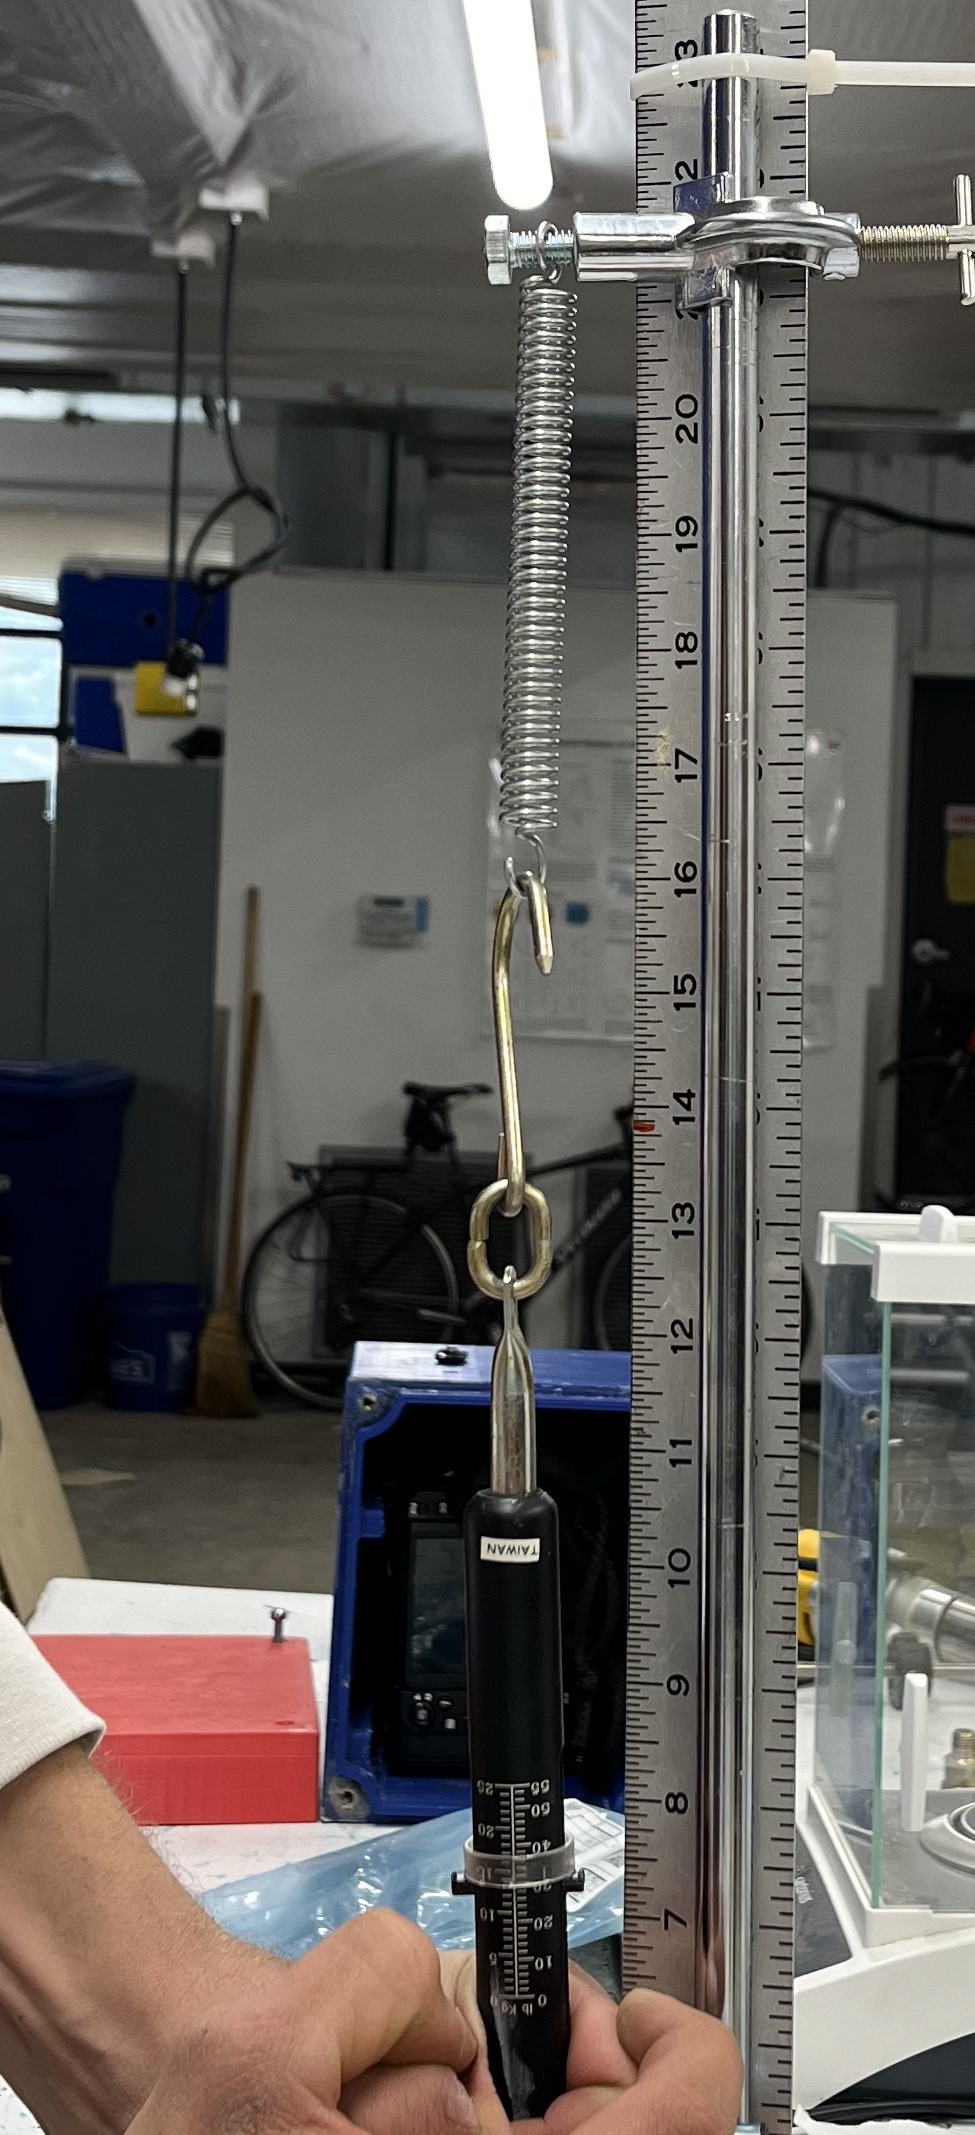
(b) Heavier spring’s displacement under 13 kg
Figure 7: Photographs illustrating the spring displacement experiments.
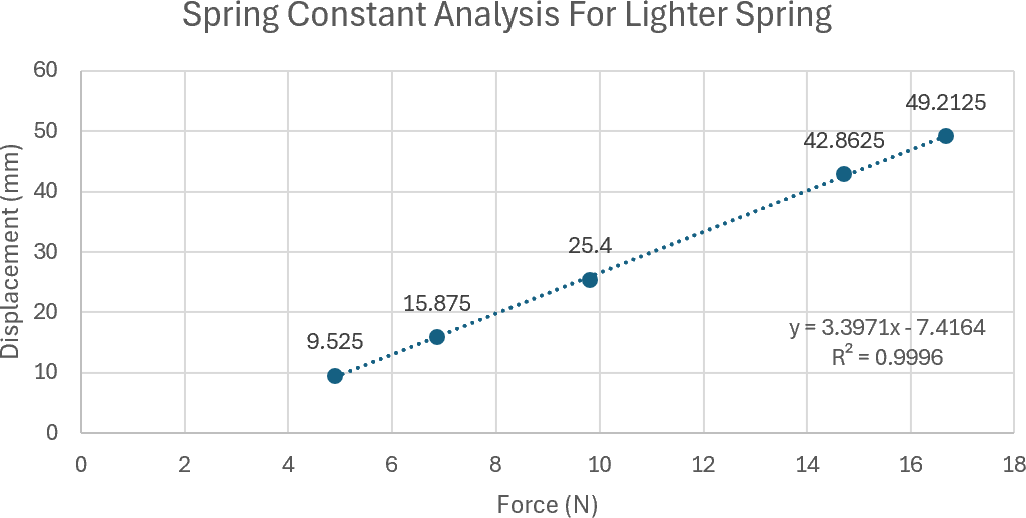
Figure 8: Displacement as a function of force the elastic spring tested.
The data was plotted and a least squares linear regression conducted. Since the data is measuring a force and a displacement, the slope of the best-fit line is the spring coefficient, as shown in Figure 8[latex]mm N[/latex]. For the spring with higher elasticity the spring constant is 3.3971 [latex]\frac{\mathrm{mm}}{\mathrm{N}}[/latex] and for the spring with lower elasticity the spring constant is 0.4353 [latex]\frac{\mathrm{mm}}{\mathrm{N}}[/latex] . Since the tapping mechanism will be displacing the spring in the same direction as in the spring constant calculations it is sufficient to assume that the spring constant will be the same.
3 Tilt-Board Field-Testing Procedure
The following procedure can be used to conduct a tilt board test in the field using our new system. The tilt board must be placed at the snow level before new snow accumulates.
Make sure all materials are available and in good working order before conducting any tests. All data should be recorded in the Google form that can be accessed here: https://docs.google.com/forms/d/e/1FAIpQLSejFWlIRYs7XyDNdMOwqFMx78Z_IIy2Z8gj8EzUt22XLlPOvA/viewform?usp=sf_link
3.1 Materials
- Cocoa powder
- Powder applicator
- Phone or camera
- Ruler
- KFTM
3.2 Method
- Take photos of the tilt boards before touching them.
- Document starting conditions with the tilt-boards both level.
- Measure height of snow on tilt boards level and document
- Adjust the tilt board to its angled position.
- With the tilt board angled begin inverted extended column test
- Gently dust the side of the snow column with cocoa powder to help highlight the cracking in the snow.
- Begin filming the test from the side of the snow column.
- Starting by tapping the underside of the board 10 times releasing the KFTM spring from the first tick mark for a fracture to occur. If a fracture occurs note the height in the snow column where the snow fractures.
- If a fracture has or has not occurred, continue to test by tapping the underside of the board another ten times but release the spring to the second tick mark. Repeat steps if fracture occurs.
- If a fracture has or has not occurred, add another ten taps to the underside of the board by releasing spring from third tick mark. Repeat steps if fracture occurs.
- Record snow crystal type at fracture location.
- When the tilt board test is complete, repeat the test for the level board. It is important to note that failure will be harder to notice in the fixed column, pay extra attention to the snow movement and cracks to be highlighted with the cocoa powder.
- Gently dust the side of the snow column with cocoa powder to help highlight the cracking in the snow.
- Begin filming the test from the side of the snow column.
- Starting by tapping the underside of the board 10 times releasing KFTM spring from first tick mark and note the number of taps it takes for a fracture to occur. If a fracture occurs note the height in the snow column where the snow fractures.
- Once both tests are complete, clear the tilt boards of any remaining snow.
- Clean out and around the plates so they do not get buried by snow.
- Reset both the tilt boards to their level starting position.
- For rigid tilt boards simply verify the platform is level, for the angled tilt board reset the board square to the frame then level.
4 Results
4.1 Tilt-Board Field Tests
The tilt boards were utilized three times at the Atwater snow-study plot in Little Cot- tonwood Canyon throughout the winter 2023-2024 season and more than 30 times in the 2024-25 winter season, which was enough data for a significant amount of analysis.
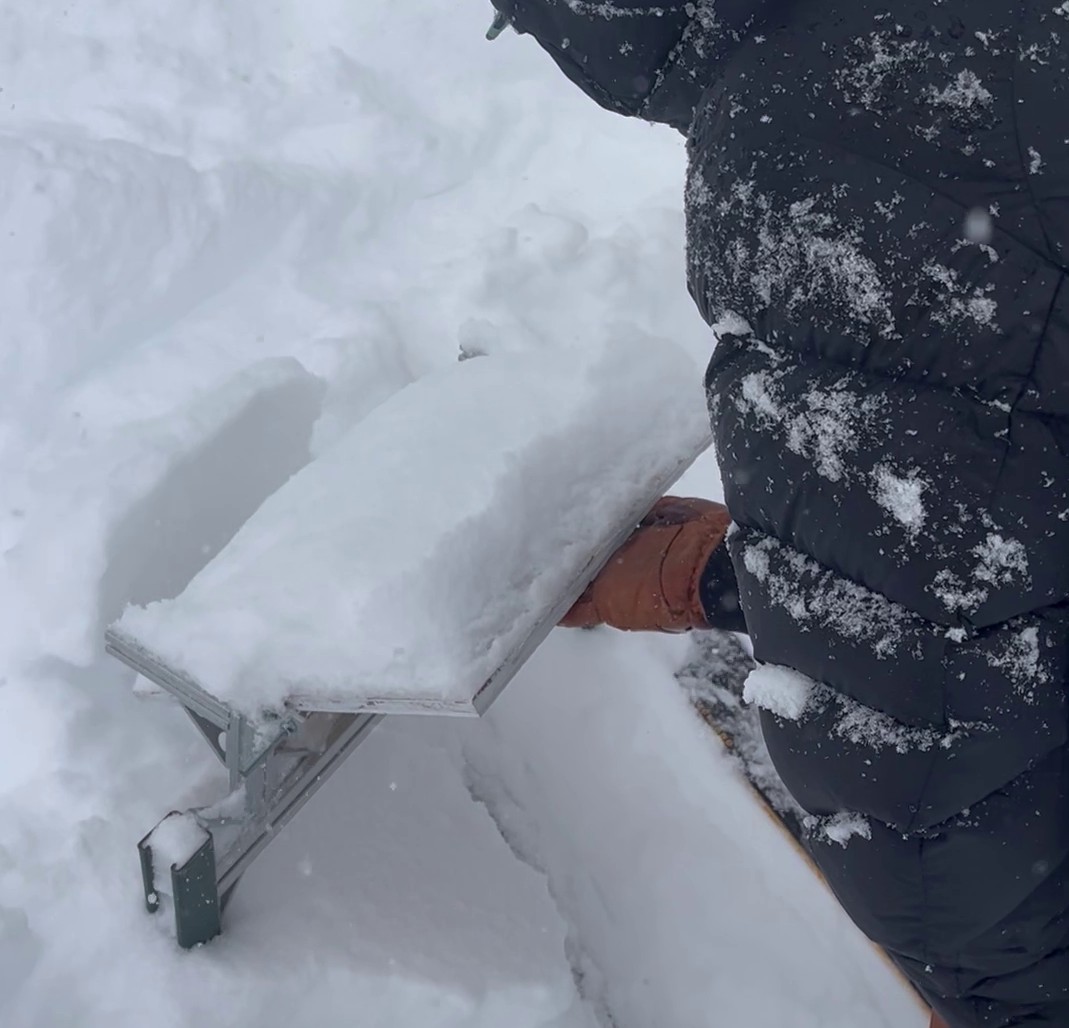
Figure 9: Critical layer failure caused by one elbow tap
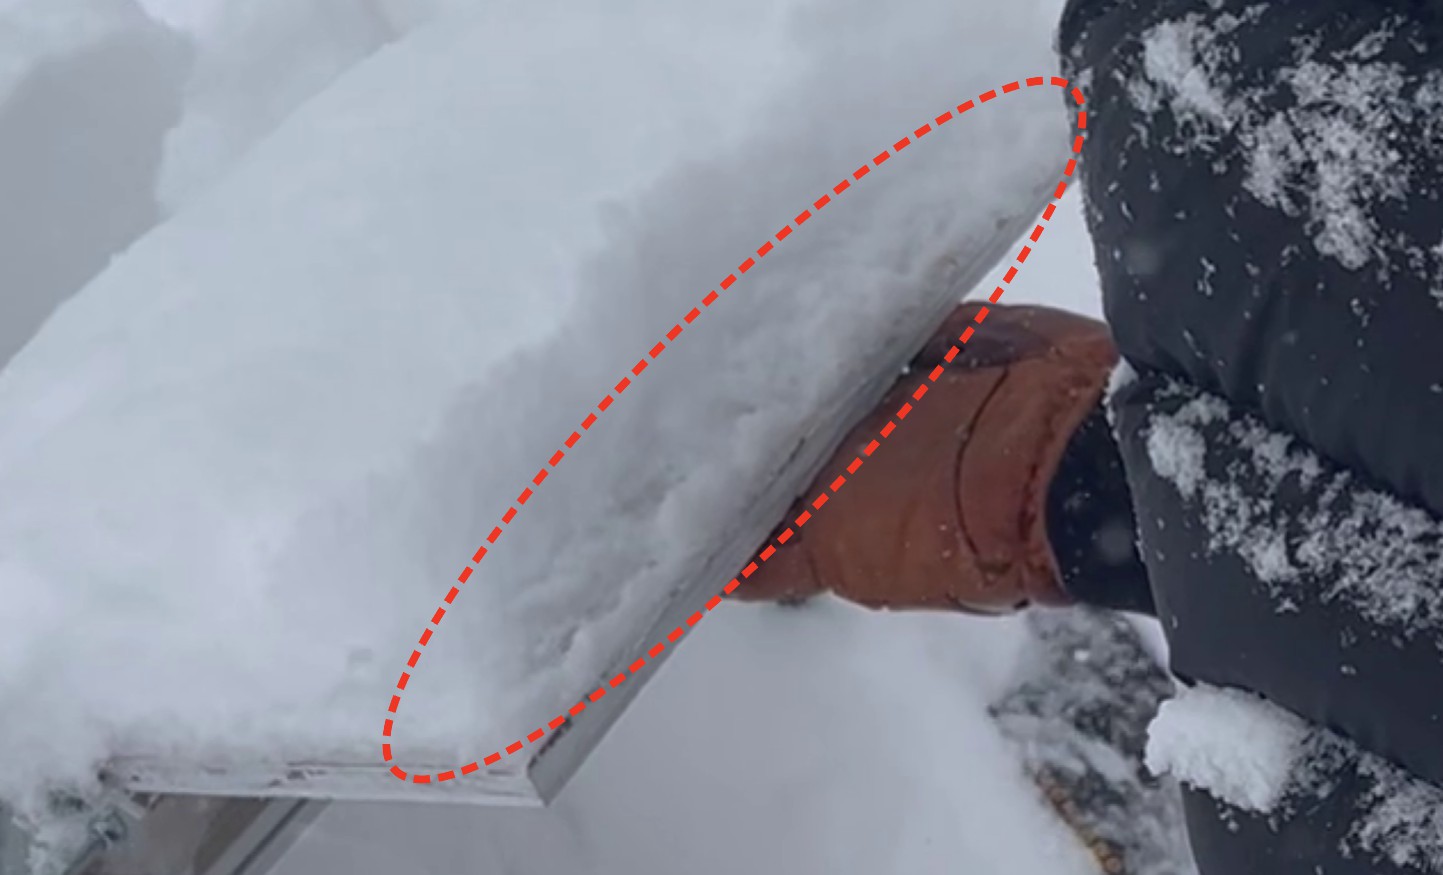
Figure 10: Close up of lowest crack failure
Jack Eskeland was able to collect a statistically significant sample of crack heights and other defining features which enabled him to compare results with the DEID and do other related work. The experiments that were conducted provided useful insight into the effectiveness of the tilt boards and the general structure of the snow at the time that the tests were conducted. As shown in Figure 9, critical failure can be seen in the column of snow at roughly 6 cm from the base of the tilt board. There is an addition crack that propagated at the surface of the tilt board but did not cause a critical failure, as shown in Figure 10. At the time of these images the KFTM had not been fully finished resulting in us using the prior ECT testing procedures.
4.2 Level Tilt-Board Tests
Level board tests were conducted during all tilt board tests in order to analyze the failure method. The level board test that corresponds to the tilt board test in the previous section contained a failure at roughly 4 cm from the surface, as seen in Figure 11.
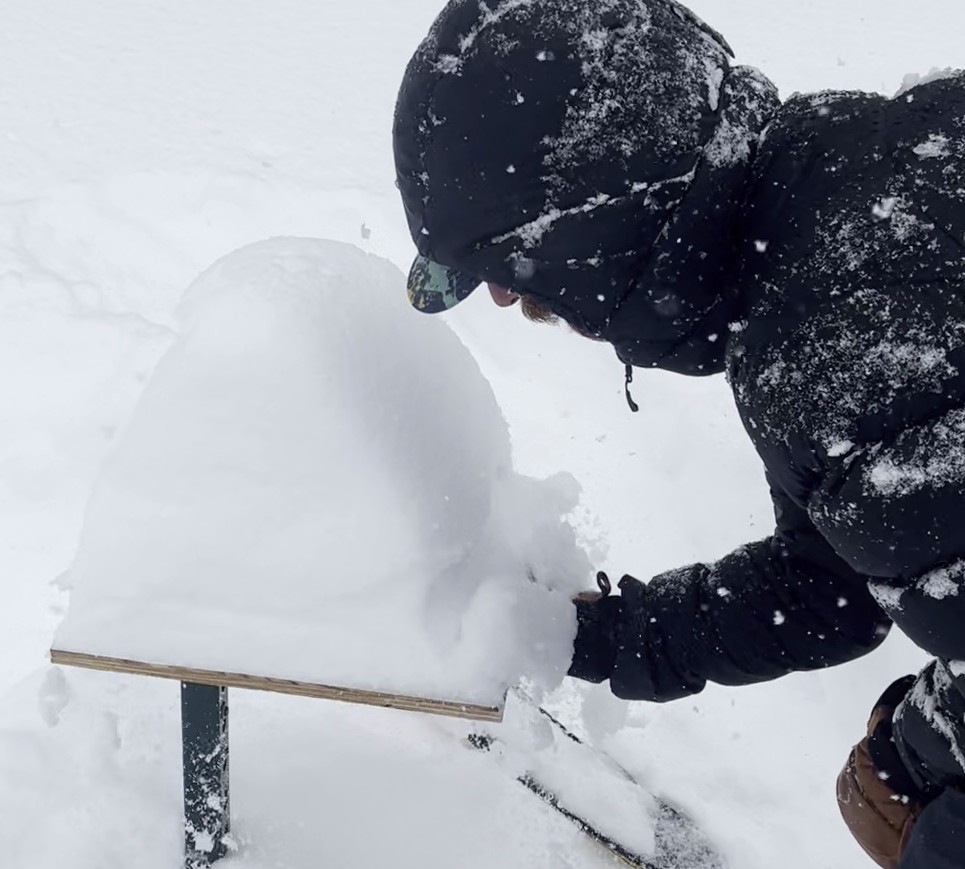
Figure 11: Photograph illustrating a level tilt board test at failure
5 Discussion
5.1 Test Analysis
The results from this season of tilt board tests were promising but left some to be desired. From the test that was analyzed in the results section there was a failure on the level board within 2 cm of the failure on the tilt board. This would indicate a higher likelihood that the layer failed in shear and compression rather than just shear.
5.2 Force Calibration Uncertainty
The calibration experiment for the force that would be applied using the KFTM was relatively accurate, but some variability needs to be addressed. First, the force transducer was placed onto a table that was at waist height ∼ 0.9 m. While this is equivalent to doing an ECT test in a low snowpack, most ECT tests are performed in a snowpack that is roughly chest height ∼ 1.5 m. This slight change in height would result in a higher force being applied to the board, specifically for the elbow and shoulder taps, because the total arc length of the persons arm is longer resulting in a faster impact. In addition to table height, factoring in the subject’s height and weight in order to account for the anthropometric influence of their body’s dimensions, would have improved the validity of each data set. Unfortunately, Institutional Review Board (IRB) guidelines prohibited us from collecting that data without further approval. The next source of variability is in the force transducer. The device was zeroed after each test subject; however there was a noticeable amount of drift (∼ ±6 N) after zeroing. Overall, this drift is relatively small compared to the peak force which was usually five to twenty times larger than the drift observed. Another source of uncertainty could have originated from the force transducer not being secured on the table. The rebound from the plate being hit would have most likely affected the data right after the impact. Since peak force is the main interest, the variability in the data right after impact is negligible. Additionally, the optical table that the force transducer was set upon weighed roughly 200 kg meaning the vibration from the table was minimal at this scale. Lastly, the sampling rate that was used on the force calibration plate was 250 Hz. This was found to be the best number for reducing noise but capturing the peak force data. However, this could have impacted the peak force data if the tap was not aligned with a sample. During this experiment we attempted to minimize all forms of uncertainty however, variability existed. Nonetheless, the magnitude of uncertainty is small compared to the mean of the signal. As a result the uncertainty does not influence the interpretation of the results.
5.3 Mechanical Improvements
One of the main issues that was encountered throughout the season was keeping the snow unaltered when removing the tilt board from under the surface of the snow. In order to keep the disturbances to a minimum, the addition of four dowel rods would enable the specimen of snow to be cleanly cut into a perfect cube. This would in turn provide a cleaner sample of snow that would more accurately represent the untouched snow around the tilt board. Another improvement to the tilt board would be to make the board out of acrylic or some roughened plastic because over the course of the season the plywood that was used started to show signs of weathering.
6 Conclusion
The successful design, fabrication, calibration, and testing of a more accurate and repeat- able tilt board was achieved during this research. The tilt boards tests that were conducted during this snow season offered promising results as well as a foundation for more scientific tilt board testing. The repeatability from the KFTM and tilt board holding frame ensures that accurate tests are being performed. Accurately controlling all variables that cause the snow to fail on the tilt board will enable more accurate analysis of the snow fracture and the specific way in which it failed. With the repeatability of the KFTM, tilt board test results can be cross referenced with DEID data and other snow analysis methods in the hopes of increasing the accuracy and improving snow science understanding. With increased under- standing of how snow fractures, comes increased awareness, safety, and lowers the impact on the people, towns, and economies that rely on snow and the recreation created from it.
7 Acknowledgments
Thanks and appreciation go to Eric Pardyjak, Dhiraj K. Singh, and Timothy J. Garrett for there on going support throughout this project.
8 Human Subject Study Comment
The University of Utah’s Institutional Review Board was consulted prior to conducting the tapping test and all recommendations were followed.
Bibliography
E. H. Bair, R. Simenhois, K. Birkeland, and J. Dozier. A field study on failure of storm snow slab avalanches. Cold Regions Science and Technology, 79:20–28, 2012.
E. Greene, K. W. Birkeland, K. Elder, G. Johnson, C. Landry, I. McCammon, M. Sta- ples, D. Sharaf, S. Trautman, and W. Wagner. Snow, weather, and avalanches: Obser- vational guidelines for avalanche programs in the United States. American Avalanche Association, Denver, Colorado, 4th Edition, 2024.
D. McClung and P. A. Schaerer. The Avalanche Handbook. The Mountaineers Books, 2006.
T. J. Morrison, T. Meisenheimer, T. Garrett, D. Singh, S. Donovan, and E. Pardyjak. Relating storm-snow avalanche instabilities to data collected from the differential emis- sivity imaging disdrometer (deid). Cold Regions Science and Technology, 210:103839, 2023.
D. K. Singh, S. Donovan, E. R. Pardyjak, and T. J. Garrett. A differential emissivity imaging technique for measuring hydrometeor mass and type. Atmospheric Measure- ment Techniques, 14(11):6973–6990, 2021.
H. B. Toft, S. V. Verplanck, and M. Landrø. How hard do avalanche practitioners tap during snow stability tests? Natural Hazards and Earth System Sciences, 24(8):2757– 2772, 2024.
