College of Mines and Earth Sciences
103 Evaluation of a Re-Engineered TEOM for Enhanced Mass Concentration Measurements of Coarse Mode Particles
Nancy Sohlberg; Gannet Hallar; Christopher Rapp; Maria Garcia; Angelina Miller; and Sebastian Hoch
Abstract
Coarse mode particulate matter (PMcoarse) has a significant global impact on climate, air quality, radiative forcing, and human health. Despite this investigative incentive, high quality PMcoarse concentration measurements are limited due to maximum aerodynamic diameter size constraints characteristic of most standard inlets. Arguably the most streamlined solution that addresses this deficit is to couple existing, standard, high quality aerosol monitors with more efficient inlet systems that allow for a broader size range of particulate matter (PM) sampling. This seminal study demonstrates and evaluates the implementation of a standardized, high-resolution, and continuous ambient air monitor – Tapered Element Oscillating Microbalance (TEOM), manufactured by Thermo Scientific, USA (Model 1405-DF) – re-engineered to pair with an inlet system possessing enhanced coarse mode sampling capability. Contemporaneous datasets from a nearby Utah Division of Air Quality (UDAQ) monitoring site are compared to results obtained from the re-engineered TEOM monitor during three case studies of varying atmospheric condition to provide insight into the viability of this novel design. The results provide strong evidence in support of the re-engineered TEOM’s ability to reliably sample PM2.5 and show promise in the re-engineered TEOM’s ability to reliably sample PMcoarse.
Keywords: Coarse mode aerosol, Ambient air sampling system, Mass concentration.
Introductions
It has long been known that particulate matter (PM) greater than 2.5 μm in diameter (PMcoarse) makes up the majority of the Earth’s airborne aerosol mass (Jaenicke & Junge, 1967; Lundgren & Paulus, 1975). Much of the global loading of dust originates from arid regions like the Sahara Desert in North Africa, the Gobi Desert in Eastern China, and the Arabian Peninsula (Ryder et al., 2019; Tanaka & Chiba, 2006), but with anthropogenic influence and climate change continuing to advance, the negative health impacts of coarse mode particles (Griffin & Kellogg, 2004; Grivas et al., 2018; Miller et al., 1979; Tong et al., 2023; Tong et al., 2017) and the ubiquity of coarse mode emission sources are becoming increasingly pronounced. Most notably, increases in coal and oil combustion, agriculture, long-range dust transport, and wildfires have all contributed to recent rises in coarse mode activity in the Western United States and developed regions in Eurasia (Afrin et al., 2021; Baumann-Stanzer et al., 2019; Clow et al., 2016; Goodman et al., 2019; Gunchin et al., 2019; Hand et al., 2016; Jiang et al., 2018; Jung et al., 2018; Lin et al., 2021; Schweizer et al., 2019; Steenburgh et al., 2012; Stone et al., 2011; Tong et al., 2017). Dry lake beds as coarse mode emission sources – especially those of receding saline lakes – are also seeing a rapid increase in size and frequency (Armitage et al., 2015; Farebrother et al., 2017; Gholampour et al., 2015; Gillette et al., 2004; Indoitu et al., 2015; Lang et al., 2023; Micklin, 2007; Skiles et al., 2018; Wurtsbaugh et al., 2017) and are of particular concern as the toxicity of saline dust has recently become more apparent (Flavelle & Tarnowski, 2022; Johnston et al., 2019; Wurtsbaugh et al., 2017). Climate change has also led unexpected biomes such as the Arctic to experience heightened levels of coarse mode dust and sea spray aerosol which then further impact the region’s climate by changing its optical properties, creating dangerous feedback loops in the world’s most fragile ecosystems (Bullard et al., 2016; Heslin-Rees et al., 2020; Sanchez-Marroquin et al.; Song et al., 2021). Even resuspended road dust and tire/brake pad wear have been shown to contribute significantly to an unhealthy presence of coarse mode particulate in urban regions (Grivas et al., 2018; Harrison et al., 2012; Karanasiou et al., 2014; Ma et al., 2017; Oroumiyeh & Zhu, 2021; Yang et al., 1999). Careful observation of these larger particles is consequently necessary to inform policy and elucidate anthropogenic contributions to the ongoing rise of PMcoarse.
Dust models also require detailed observations of PMcoarse. Currently, models are the principal method of monitoring global dust activity (Huneeus et al., 2011; Hurrell et al., 2013), but recent evidence suggests that coarse mode aerosol is consistently misrepresented by these models (Adebiyi & Kok, 2020; Afrin et al., 2021). Efforts are being made to improve model accuracy, but observational data is required to validate new versions (Gliß et al., 2021; Ryder et al., 2019; Ryu & Min, 2022).
Despite the growing need for high quality PMcoarse measurements, the insitu continuous (on-line) measurement of coarse mode aerosol is an on-going engineering challenge. Aerosol concentration measurements are harder to get for PMcoarse – especially PM>10 (particles above 10 μm in diameter) – because the greater inertia of larger particles leaves them susceptible to losses within inlet systems (Kulkarni et al., 2011). Most federally approved aerosol monitors are consequently coupled with PM10 inlets which are biased towards fine particulate as they capture only a small fraction of coarse mode particles. Monitors capable of sampling PM>10 do exist (Hsiao et al., 2010; Lim et al., 2021; Noll, 1970) but these options consist of high-volume samplers that require a high frequency of manual filter changes (daily), do not provide continuous measurements, and have low temporal resolution compared to federal equivalent methods (FEM). Low-cost sensors (LCS) are another option for monitoring PMcoarse and have gained considerable research attention recently because of their deployability, but these have been shown to be unreliable for particle sizes above PM2.5 (Molina Rueda et al., 2023; Narayana et al., 2022; Taing et al., 2021). The current landscape of PM sensors has resulted in a disparity of high-quality, ground-based aerosol monitoring for PMcoarse, with undersampling of these larger particles consistently reported as a limitation to in situ aerosol observations (Baumann-Stanzer et al., 2019; Neff et al., 2013; Nikandrova et al., 2018; Skiles et al., 2018). The recent establishment of a novel inlet system with enhanced coarse mode sampling capability at the Storm Peak Lab high elevation research site in Steamboat Springs Colorado (Petersen et al., 2019) and now also in the Hallar Aerosol Research Team laboratory at the University of Utah, presents a promising solution to this sampling shortage.
Rather than generate entirely new instrumentation for comprehensive sampling of PMcoarse, a more streamlined strategy would be to couple existing, standard, high quality aerosol monitors with more efficient inlet sampling systems. The following research demonstrates the viability of such an approach through a FEM PM sensor – Tapered Element Oscillating Microbalance (TEOM), manufactured by Thermo Scientific, USA (Model 1405-DF) – re-engineered to sample from an inlet system that surpasses standard PM10 inlets in its ability to capture larger coarse mode particulate (Petersen et al., 2019).
Methods
TEOM1405-DF
The TEOM 1405-DF monitor is an Environmental Protection Agency (EPA) regulatory standard instrument designed to take continuous and dichotomous (simultaneous sampling of PM2.5 and PMcoarse) measurements of the total mass concentration of PM – both non-volatile and semi-volatile fractions – in the ambient air. Typical installation is shown in Fig. 1(a) and includes an exposed inlet assembly that attaches to a FDMS tower and TEOM unit that are housed within a specialized enclosure. The inlet assembly consists of a standard PM10 inlet which has an aerodynamic diameter cut-size (PM diameter where sampling efficiency is reduced to 50%) of 10 µm (Wang et al., 2005). This inlet is connected to a virtual impactor and flow splitter from which PM2.5 is subsampled. PM2.5 and PMcoarse (2.5 μm < PM with aerodynamic diameters < 10 μm) then pass through individual channels to a Filter Dynamics Measurement System (FDMS™), housed in the FDMS tower, where each sample stream flows through diffusion dryers that remove particle bound water. The dried air then alternates between 6-minute base (non-volatile fraction) and reference (semi-volatile fraction) sampling periods which are controlled by a switching valve mechanism. The base period directs the dried air straight into the TEOM unit where PM is collected on TX40 filters attached to oscillating microbalances. Slight increases in the mass of these filters from the deposited PM decreases the frequency of the microbalance’s oscillations which is detected by the instrument and used to calculate the PM mass concentration using Hooke’s law and flow rate considerations. After 6 minutes, a diverter block in the switching valve assembly slides over to redirect the sample air streams through chilled 47mm TX40 filters (in the FDMS tower) maintained at 4°C that retain semi-volatile PM but remove non-volatile PM before directing the flow to the microbalance filters in the TEOM unit. During the reference phase, semi-volatile material will evaporate off the TEOM filters to generate a negative mass concentration value, the magnitude of which is added to the positive mass concentration value obtained during the base phase. This overall mass concentration is reported for PM2.5, PMcoarse(2.5-10), and PM10 which is obtained by adding PM2.5 and PMcoarse together (Ray & Vaughn, 2009).
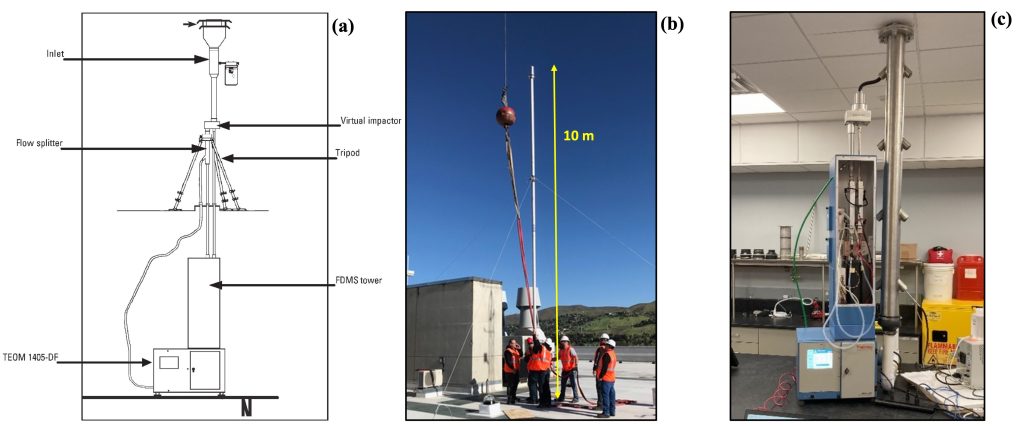 Figure 1: (a) Schematic of the typical installation for a TEOM 1405-DF (Figure taken from TEOM 1405- DF operating manual, ThermoFisher Scientific part number 42-010815, USA). (b) The 10m tall turbulent ground-based inlet during its installation on the roof of WBB. (c) The pickoff assembly manifold (which joins with the inlet on the roof) with the HART TEOM monitor attached to one of the topmost pickoffs inside the HART lab on the 8th/top floor of WBB.
TEOM System Description
In this study, the TEOM 1405-DF monitor is setup to sample ambient outdoor air, but rather than a typical outdoors installation with a standard PM10 inlet, the TEOM is located indoors in the HART lab on the top (8th) floor of the William Browning Building (WBB) at the University of Utah where it is attached to a pickoff element on a manifold (Fig. 1(c)) that joins with a turbulent ground- based inlet on WBB’s roof (Fig. 1(b)). The configuration and operation of this turbulent ground-based inlet is the same as that established at the Storm Peak Lab high elevation research site in Steamboat Springs Colorado and has been described previously (Petersen et al., 2019). This inlet sampling system was designed by Enertechnix Inc. and evaluated using a low-flow wind tunnel experiment, which confirmed prior Computational Fluid Dynamic modeling and has been shown to have a 50% cut-size of 13 µm (Petersen et al., 2019). This new inlet, which will now be referred to as a PM13 inlet, should allow the TEOM to sample a broader range of coarse mode particles than TEOM monitors using a standard PM10 inlet.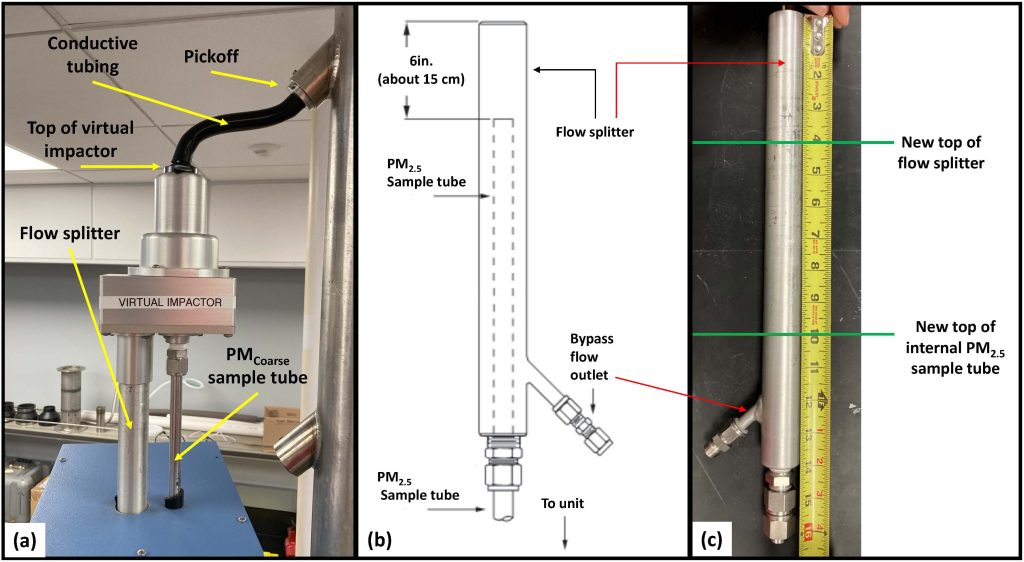 Figure 2: HART TEOM modifications. (a) Connection between manifold pickoff and virtual impactor. (b) Diagram of flow splitter and internal PM2.5 sample tube indicating required 6 in. clearance (Figure taken from TEOM 1405-DF operating manual, ThermoFisher Scientific part number 42-010815, USA). (c) diagram showing original flow splitter and where it and the PM2.5 sample tube was cut.
There were three main constraints in attaching the TEOM to the pickoff assembly manifold: the distance between the pickoff and the top of the virtual impactor, the distance between the top of the flow splitter and the top of the PM2.5 sample tube, and the distance between the top of the PM2.5 sample tube and the bypass flow outlet. The top of the PM2.5 sample tube is required to be between 5.75 and 6.25 inches from the top of the flow splitter (Fig. 2(b)) and cannot pass beneath the bypass flow outlet. Additionally, the conductive tubing connecting the top of the virtual impactor to the pickoff (Fig. 2(a)) needs to have smooth transitions to minimize particle loss. The flow splitter was iteratively shortened to achieve the optimal configuration under these constraints. The final proportions for the flow splitter and internal PM2.5 sample tube are shown in Fig. 2(c). Once the flow splitter modifications were complete, the PMcoarse sample tube (Fig. 2(a)) was also shortened to be compatible in length. Holes were drilled into the top and side panels of the FDMS tower to allow for the flow splitter and bypass line respectively to pass through unhindered. The final assembly is shown in Fig. 1(c).
Sampling Locations and Periods
To evaluate the re-engineered TEOM, we compared it to two other real time particulate mass concentration monitors, one that samples PM2.5 – Synchronized Hybrid Ambient Real-time Particulate monitor (SHARP), manufactured by Thermo Scientific, USA (Model 5030i) – and one that samples PM10 – Environmental Beta-Attenuation Mass Monitor (E-BAM), manufactured by Met One Instruments, Inc., USA (Model PLUS). These two monitors are both located at the Utah Division of Air Quality (UDAQ) air monitoring site at Hawthorne Elementary School (QHW) and are operated according to EPA guidelines. The QHW site is on the corner of a major intersection in a residential neighborhood which sees emissions from nearby roads and houses. The re-engineered TEOM is located on the 8th floor of the William Browning Building (WBB) at the University of Utah and samples air through an inlet that begins ~10m above the rooftop. The WBB sampling site is impacted by nearby road and building emissions. The QHW sampling site is ~155m lower in elevation and ~4.2 km southwest of the WBB sampling site (Fig. 3).
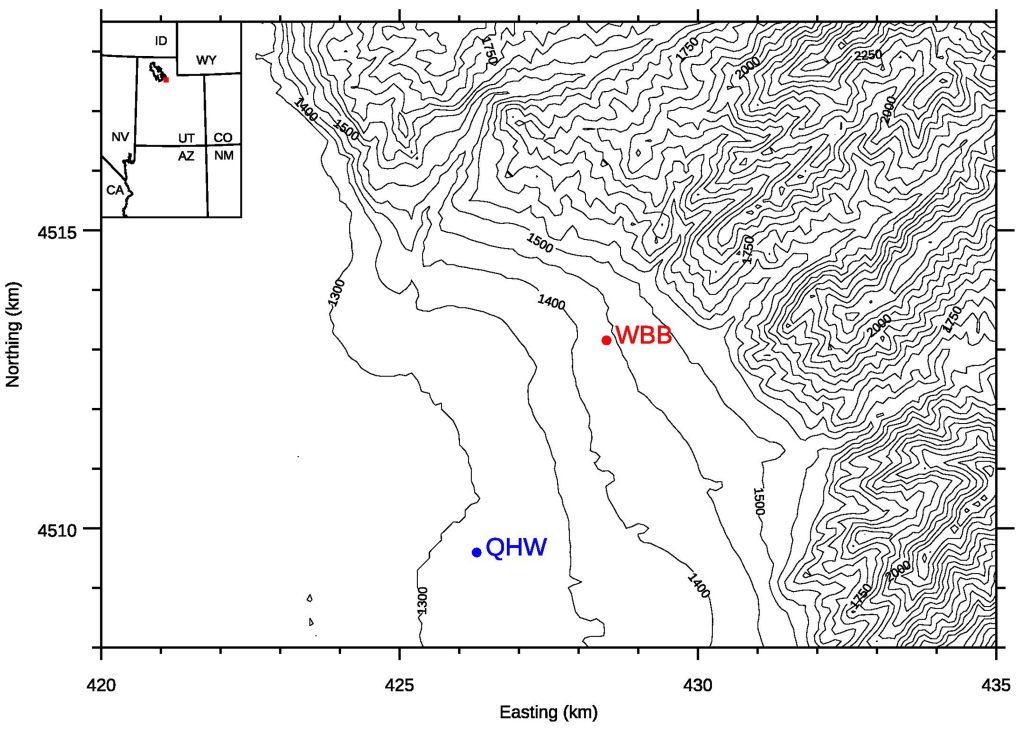 Figure 3: Topographic map of NE Salt Lake Valley with locations of WBB and QHW sampling sites.
Contemporaneous data sets from both sampling sites were compared for 3 different time periods of varying length and atmospheric condition. The first was a 2-month period ranging from July 1 to August 31, 2022, with no appreciable pollution events. The second was a 5-day period ranging from September 9 through September 13, 2022, characterized by the presence of wildfire smoke in the Salt Lake Valley (SLV). The third was a 7-day period ranging from November 16 to November 23, 2022, characterized by an inversion event in the SLV. Fine particulate pollution events were selected as two of the time periods to be analyzed because they allow for a more direct comparison of our results to previous studies done on inversion events in the SLV. These prior studies are ideal for generating an informative evaluation of the re-engineered TEOM because they incorporated PM data from both the WBB rooftop and QHW sampling sites, which are exactly the same sampling sites used in our study. For each period, comparisons were made between PM2.5 versus PM13 at WBB, PM2.5 at WBB versus PM2.5 at QHW, and PM13 at WBB versus PM10 at QHW.
Results and Discussion
Wintertime Inversion Event
The first column of Fig. 4(a) shows three time series with combinations of hourly averaged mass concentrations for PM2.5, PM13 at WBB, and PM10 at QHW (which will sometimes be grouped together under the term PM13,10 for easier reference to the coarse mode at both sites) during an inversion event in the SLV from November 16 to November 23, 2022. The first plot in this column shows PM2.5 and PM13 observed by the re-engineered TEOM at WBB. The two data sets are well correlated with a Pearson Correlation Coefficient of 0.96 and with PM2.5 making up 73.5% of PM13. These observations are consistent with previous observations made during the Utah Winter Fine Particulate Study (UWFPS) – which also used measurements from the WBB and QHW sampling sites – where it was found that “PM2.5 and PM10 are well correlated with PM2.5 constituting ~ 70-85% of PM10” during wintertime pollution events (Baasandorj et al., 2018). As expected, the percentage value for the re-engineered TEOM falls on the lower end of the percentage range found during the UWFPS since PM2.5 makes up a smaller percentage of PM13 than it does of PM10, which serves as evidence for the TEOM’s enhanced coarse mode sampling capability. This ratio is also comparable to other studies done in similar geographical regions during “haze periods” (Ryu et al., 2007; Sirithian & Thanatrakolsri, 2022).
The second plot in the first column of Fig. 4(a) shows PM2.5 observed at both WBB and QHW for the inversion event period. No statistically significant difference was found between the average PM2.5 observed by the re-engineered TEOM at WBB and the average PM2.5 observed at QHW during this time period. The two data sets generated a paired t-test P-value of 0.63 (indicating failure to reject the null hypothesis that represents indistinguishability between the two data sets) and good linear correlation (Fig. 4(b)) with an R2 value of 0.76. It was found in a preliminary UWFPS study that PM2.5 measured at WBB’s rooftop sampling site was “nearly identical” to PM2.5 measured at QHW during an inversion event (Baasandorj et al., 2017), which is consistent with the results presented here. This is a consequence of the homogeneity of PM2.5 across a large elevation range during major fine particulate pollution events like wintertime inversions. PM2.5 measured by the re-engineered TEOM at WBB does display more variability than PM2.5 measured at QHW; however, this is attributed to the nature of TEOM technology which has a precision of +/- 5 µg m-3 compared with the SHARP technology used at QHW which has a precision of +/- 2 µg m-3.
The third plot in the first column of Fig. 4(a) shows PM13 observed by the re-engineered TEOM at WBB compared with PM10 observed at QHW. The two are well correlated with a Pearson Correlation Coefficient of 0.82; however, PM13 measured at WBB is lower on average than PM10 measured at QHW with an average difference of 7.7 µg m-3. Initially, this difference is surprising because PM13 is expected to have a higher mass concentration than PM10 simply because it encompasses more particles into the same volume of air, but while PM2.5 is evenly distributed over a large elevation profile during significant inversion events, coarse mode particles remain largely unaffected (Clements et al., 2016).
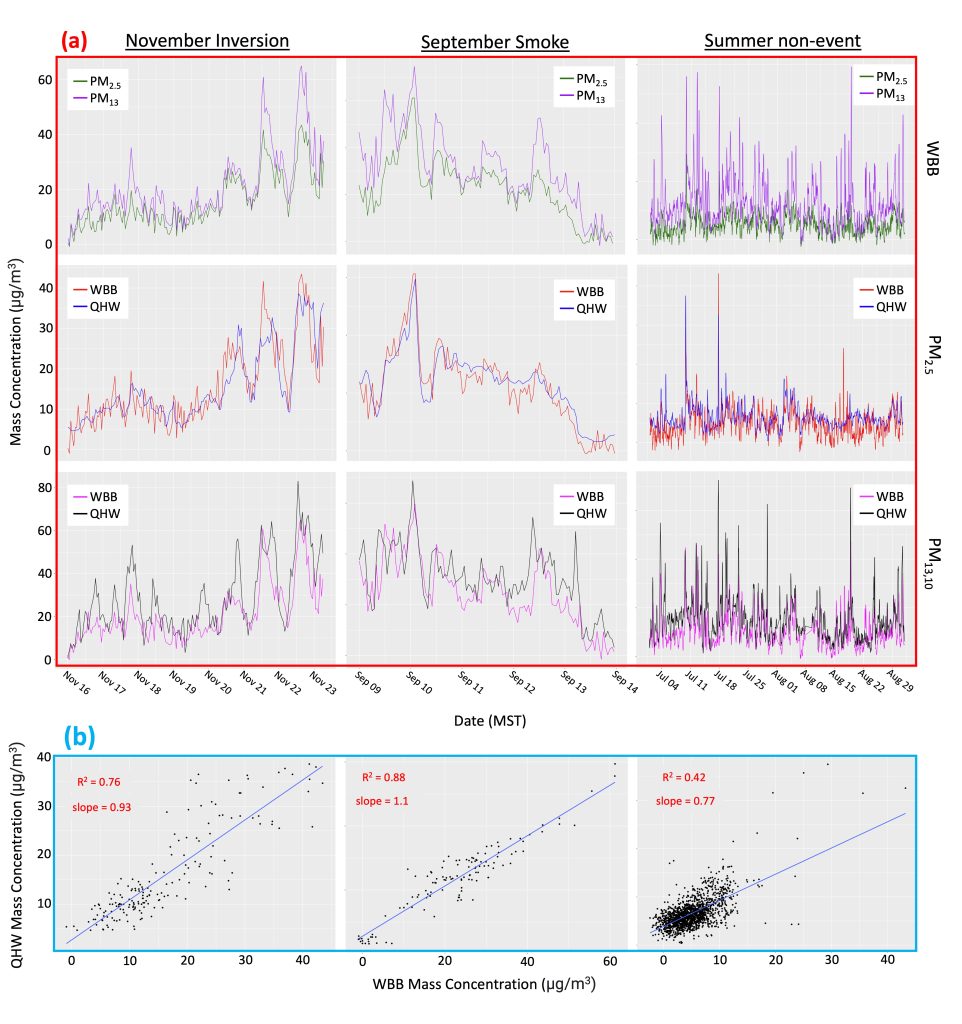 Figure 4: (a) Time series of hourly averaged PM2.5 and PM13 at WBB, PM2.5 at both WBB and QHW, and PM13,10 (with 3-hr rolling average) at WBB and QHW for the November 16 – November 23, 2022 inversion event, September 9 – September 13, 2022 smoke event, and July 1 – August 31, 2022 summer period that saw no appreciable pollutions events. (b) Linear regression between hourly averaged PM2.5 measured by re-engineered HART TEOM at WBB and hourly averaged PM2.5 measured at QHW with corresponding R2 and slope values for each time period of interest.
This means the data will reflect the different levels of exposure to coarse mode particles that are present at each sampling site outside of pollution events. Specifically, the TEOM samples air ~10 m above an eight-story building (WBB) on the University of Utah’s campus, whereas the QHW sampling site is located at ground level and adjacent to a major residential intersection on the valley floor. Coarse mode particles are expected to be higher on average at the QHW sampling site because of the site’s proximity to road emissions including road dust and tire/brake pad wear (Oroumiyeh & Zhu, 2021) which explains the higher PM10 concentrations at QHW versus PM13 concentrations at WBB. The maintained high correlation between the PM13 and PM10 data sets can be attributed to the dominance and uniformity of PM2.5 in the SLV and its influence on PM13,10 during significant inversion events.
Wildfire Smoke Event
The second column in Fig. 4(a) shows another three time series with combinations of hourly averaged PM2.5 and PM13,10 mass concentrations at both the WBB and QHW sampling sites, obtained during a wildfire smoke event impacting the SLV from September 9 to September 13, 2022. The results for this time period are very similar to those obtained for the November 2022 inversion event, which is not surprising because both pollution episodes are characterized by a predominant presence of fine particulates (PM2.5). As in the previous section, the first plot in the second column of Fig. 4(a) shows PM2.5 and PM13 observed by the re-engineered TEOM at WBB, the second plot shows PM2.5 observed at both WBB and QHW, and the third plot shows PM13,10 observed at WBB and QHW respectively.
PM2.5 and PM13 at WBB are once again well correlated with a Pearson Correlation Coefficient of 0.90 and with PM2.5 making up 70.0% of PM13. These results continue to align with expectation based on the well correlated relationship and ~ 70-85% fraction found between PM2.5 and PM10 during the UWFPS (Baasandorj et al., 2018; Baasandorj et al., 2017) as well as similar relationships found in other studies for fine particulate pollution events in urban valley regions (Ryu et al., 2007; Sirithian & Thanatrakolsri, 2022). This ratio is also consistently below other reported PM2.5/PM10 ratios during wildfire smoke events (Kang et al., 2014; Sparks & Wagner, 2021; Vicente et al., 2013), further supporting the enhanced coarse mode sampling of the re-engineered TEOM at WBB as PM2.5 should make up a smaller fraction of PM13 than it does of PM10.
There is still no statistically significant difference between the average PM2.5 observed at WBB and the average PM2.5 observed at QHW during this time period with the two data sets generating a paired t-test P-value of 0.1 (again, indicating failure to reject the null hypothesis that represents indistinguishability between the two data sets) and great linear correlation (Fig. 4(b)) with a R2 value of 0.88. These results remain consistent with the indistinguishable relationship between PM2.5 at WBB versus PM2.5 at QHW during wintertime pollution events that was found during the UWFPS (Baasandorj et al., 2017).
PM13 observed by the re-engineered TEOM at WBB is also still well correlated with PM10 observed at QHW with a Pearson Correlation Coefficient of 0.76, and PM13 measured by the TEOM at WBB remains lower on average than PM10 measured at QHW with an average difference of 6.7 µg m-3. These results parallel those obtained for the inversion event and remain consistent with the hypothesis that the QHW sampling site has a higher exposure to coarse mode particles than WBB, and that PM2.5 has a substantially greater presence in the SLV than PM13,10 during fine particulate pollution events.
Nonpollution Period
The third column in Fig. 4(a) shows three time series with hourly averaged PM2.5 and PM13,10 mass concentrations at the WBB and QHW sampling sites during a period with no major pollution events that lasted from July 1st to August 31st, 2022. A 3-hour rolling average was used in the analysis of this longer time period in order to enhance the clarity of the data. As in the previous sections, the first plot in the third column of Fig. 4(a) shows PM2.5 and PM13 observed by the re-engineered TEOM at WBB, the second plot shows PM2.5 observed at both WBB and QHW, and the third plot shows PM13,10 observed at both WBB and QHW respectively.
PM2.5 and PM13 at WBB are once again well correlated with a Pearson Correlation Coefficient of 0.80 but with PM2.5 now making up only 43.7% of PM13. This lower percentage is expected because the previous two case studies were distinguished by a substantial increase in fine particulate matter (PM2.5) and relatively little change in coarse mode particulate matter (PM13,10) throughout the SLV, whereas this 2-month period had no appreciable fine or coarse mode pollution events, so lower PM2.5 concentrations yet equivalent PM13,10 concentrations are expected. This percentage is also consistently lower than those reported in previous studies that looked at PM2.5/PM10 ratios during non-pollution periods in urban regions (Chirasophon & Pochanart, 2020; Clements et al., 2016; Schweizer et al., 2019; Suburairat & Bunjongsiri, 2020), which continues to provide evidence in support of the re- engineered TEOM’s enhanced coarse mode sampling capability where a larger fraction of coarse mode particles are being sampled and thus lowering the PM ratio generated by the TEOM. The maintained correlation between the two PM modes in the absence of a ubiquitous pollution event suggests the primary emission source for PM2.5 under normal conditions is the same as that for PM13, which was identified earlier as road emissions coming from road dust and tire/brake pad wear. The predominant road related PM2.5 emission source is vehicular exhaust (Jeong et al., 2019; Pant & Harrison, 2013), so it is likely that this constitutes a significant portion of the PM2.5 detected at WBB during this non-pollution period.
There is now also a statistically significant difference between PM2.5 observed by the TEOM at WBB and PM2.5 observed at QHW with the two data sets generating a paired t-test P-value << 0.01 (indicating rejection of the null hypothesis that represents indistinguishability between the two data sets), poor linear correlation with a R2 value of 0.42 (Fig. 4(b)), and an average difference of 1.5 µg m- 3 with higher values at QHW. Similar to the relationship between PM13 at WBB and PM10 at QHW, this difference in PM2.5 can be attributed to the difference in exposure to road emissions – which, as stated earlier, primarily consist of vehicular exhaust in the case of PM2.5 – between the sampling sites. These underlying differences in PM2.5 at WBB versus PM2.5 at QHW were obscured during the inversion and smoke events by the high and widespread PM2.5 mass concentrations present during those time periods.
Additionally, PM13 observed by the re-engineered TEOM at WBB is not very well correlated with PM10 observed at QHW with a Pearson Correlation Coefficient of 0.64. This is expected because the homogenous PM2.5 portion that dominated PM13,10 at both sites during the inversion and smoke events is absent during this 2-month period, so the difference in each site’s exposure to road emissions now predominates. PM13 at WBB continues to remain lower on average than PM10 at QHW with an average difference of 6.7 µg m-3. This average difference is equivalent to those calculated for the inversion and smoke periods, which indicates a consistency in the coarse mode particulate levels across all three time periods of interest and reflects the primarily fine particulate nature of wildfire smoke and inversion events.
Conclusions
In this paper we present a TEOM 1405-DF monitor uniquely re-engineered for enhanced mass concentration measurements of coarse mode particles and compare its measurements to contemporaneous datasets from a nearby air monitoring site during three case studies of varying atmospheric condition to provide insight into the viability of our design and reliability of our re- engineered instrument. The comparison results provide strong evidence in support of the re-engineered TEOM’s ability to reliably sample PM2.5 with measurements aligning well with those obtained during the UWFPS for the same two sampling sites under equivalent conditions. The results also indicate an enhancement in the re-engineered TEOM’s coarse mode sampling capability as it was found that PM2.5/PM13 ratios and PM13,10 relationships all fell within reasonable expectation when considering the different inlet systems and emission sources at WBB and QHW. These results show promise in the TEOM’s ability to reliably sample PM13, a particle size range that incorporates a larger fraction of coarse mode particles compared to the current standard of PM10 for continuous PM mass concentration monitors; however, a lack of prior PM10 analysis at WBB and QHW as well as differences in exposure to coarse mode particulate between the two sampling sites resulted in an inability to quantify the additional coarse mode particles sampled through the PM13 inlet sampling system versus a standard PM10 sampling system. Despite this restriction, the results obtained are able to provide substantial evidence in favor of the re-engineered TEOM’s functionality, which supports the ability of this re- engineered design to address the growing need for enhanced sampling of coarse mode particles and encourages any future efforts for replication.
Acknowledgements
This research was supported and funded by the University of Utah’s Office of Undergraduate Research, the Wilkes Center for Climate Science & Policy, and FRIENDS of Great Salt Lake. The authors also wish to thank Tom Gudmundson (University of Utah) for assistance with sampling tube modification, as well as Sandra Nason and Deborah Bowe (ThermoFisher Scientific) for technical support.
References
Adebiyi, A. A., & Kok, J. F. (2020). Climate models miss most of the coarse dust in the atmosphere. Science Advances, 6(15), eaaz9507. https://doi.org/doi:10.1126/sciadv.aaz9507 Afrin, S., Islam, M. M., & Ahmed, T. (2021). A Meteorology Based Particulate Matter
Prediction Model for Megacity Dhaka. Aerosol and Air Quality Research, 21(4), 200371. https://doi.org/10.4209/aaqr.2020.07.0371
Armitage, S. J., Bristow, C. S., & Drake, N. A. (2015). West African monsoon dynamics inferred from abrupt fluctuations of Lake Mega-Chad. Proceedings of the National Academy of Sciences, 112(28), 8543-8548. https://doi.org/10.1073/pnas.1417655112
Baasandorj, M., Brown, S., Hoch, S., Crosman, E., Long, R., Silva, P., . . . Bares, R. (2018).
Final report for Utah Winter Fine Particulate Study (UWFPS). In: Utah Division of Air Quality.
Baasandorj, M., Hoch, S. W., Bares, R., Lin, J. C., Brown, S. S., Millet, D. B., . . . Sohl, J. (2017). Coupling between Chemical and Meteorological Processes under Persistent Cold-Air Pool Conditions: Evolution of Wintertime PM2.5 Pollution Events and N2O5 Observations in Utah’s Salt Lake Valley. Environmental Science & Technology, 51(11), 5941-5950. https://doi.org/10.1021/acs.est.6b06603
Baumann-Stanzer, K., Greilinger, M., Kasper-Giebl, A., Flandorfer, C., Hieden, A., Lotteraner, C., . . . Piringer, M. (2019). Evaluation of WRF-Chem Model Forecasts of a Prolonged Saharan Dust Episode over the Eastern Alps. Aerosol and Air Quality Research, 19(6), 1226-1240. https://doi.org/10.4209/aaqr.2018.03.0116
Bullard, J. E., Baddock, M., Bradwell, T., Crusius, J., Darlington, E., Gaiero, D., . . .
Thorsteinsson, T. (2016). High-latitude dust in the Earth system. Reviews of Geophysics, 54(2), 447-485. https://doi.org/https://doi.org/10.1002/2016RG000518
Chirasophon, S., & Pochanart, P. (2020). The Long-term Characteristics of PM 10 and PM
2.5 in Bangkok, Thailand. Asian Journal of Atmospheric Environment (AJAE), 14(1). Clements, N., Hannigan, M. P., Miller, S. L., Peel, J. L., & Milford, J. B. (2016).
Comparisons of urban and rural PM10 − 2.5 and PM2.5 mass concentrations and semi-volatile fractions in northeastern Colorado. Atmos. Chem. Phys., 16(11), 7469-7484. https://doi.org/10.5194/acp-16-7469-2016
Clow, D. W., Williams, M. W., & Schuster, P. F. (2016). Increasing aeolian dust deposition to snowpacks in the Rocky Mountains inferred from snowpack, wet deposition, and aerosol chemistry. Atmospheric Environment, 146, 183-194. https://doi.org/https://doi.org/10.1016/j.atmosenv.2016.06.076
Farebrother, W., Hesse, P. P., Chang, H.-C., & Jones, C. (2017). Dry lake beds as sources of dust in Australia during the Late Quaternary: A volumetric approach based on lake bed and deflated dune volumes. Quaternary Science Reviews, 161, 81-98. https://doi.org/https://doi.org/10.1016/j.quascirev.2017.02.019
Flavelle, C., & Tarnowski, B. (2022, 2022/06/09/). As the Great Salt Lake Dries Up, Utah Faces An ‘Environmental Nuclear Bomb’. International New York Times, NA. https://link.gale.com/apps/doc/A706390785/AONE?u=anon~fb940343&sid=googleScholar&x id=3440b9f1
Gholampour, A., Nabizadeh, R., Hassanvand, M. S., Taghipour, H., Nazmara, S., & Mahvi,
A. H. (2015). Characterization of saline dust emission resulted from Urmia Lake drying. Journal of Environmental Health Science and Engineering, 13(1), 82. https://doi.org/10.1186/s40201-015-0238-3
Gillette, D., Ono, D., & Richmond, K. (2004). A combined modeling and measurement technique for estimating windblown dust emissions at Owens (dry) Lake, California. Journal of Geophysical Research: Earth Surface, 109(F1). https://doi.org/https://doi.org/10.1029/2003JF000025
Gliß, J., Mortier, A., Schulz, M., Andrews, E., Balkanski, Y., Bauer, S. E., . . . Tsyro, S. G. (2021). AeroCom phase III multi-model evaluation of the aerosol life cycle and optical properties using ground- and space-based remote sensing as well as surface in situ observations. Atmos. Chem. Phys., 21(1), 87-128. https://doi.org/10.5194/acp-21-87-2021
Goodman, M. M., Carling, G. T., Fernandez, D. P., Rey, K. A., Hale, C. A., Bickmore, B. R., . . . Munroe, J. S. (2019). Trace element chemistry of atmospheric deposition along the Wasatch Front (Utah, USA) reflects regional playa dust and local urban aerosols. Chemical Geology, 530, 119317. https://doi.org/https://doi.org/10.1016/j.chemgeo.2019.119317
Griffin, D. W., & Kellogg, C. A. (2004). Dust Storms and Their Impact on Ocean and Human Health: Dust in Earth’s Atmosphere. EcoHealth, 1(3), 284-295. https://doi.org/10.1007/s10393-004-0120-8
Grivas, G., Cheristanidis, S., Chaloulakou, A., Koutrakis, P., & Mihalopoulos, N. (2018).
Elemental Composition and Source Apportionment of Fine and Coarse Particles at Traffic and Urban Background Locations in Athens, Greece. Aerosol and Air Quality Research, 18(7), 1642-1659. https://doi.org/10.4209/aaqr.2017.12.0567
Gunchin, G., Streli, C., Darby, I., Karydas, A. G., Eleftheriadis, K., Lodoysamba, S., . . .
Osan, J. (2019). Three-Year Long Source Apportionment Study of Airborne Particles in Ulaanbaatar Using X-Ray Fluorescence and Positive Matrix Factorization. Aerosol and Air Quality Research, 19(5), 1056-1067. https://doi.org/10.4209/aaqr.2018.09.0351
Hand, J. L., White, W. H., Gebhart, K. A., Hyslop, N. P., Gill, T. E., & Schichtel, B. A. (2016). Earlier onset of the spring fine dust season in the southwestern United States.
Geophysical Research Letters, 43(8), 4001-4009. https://doi.org/https://doi.org/10.1002/2016GL068519
Harrison, R. M., Jones, A. M., Gietl, J., Yin, J., & Green, D. C. (2012). Estimation of the Contributions of Brake Dust, Tire Wear, and Resuspension to Nonexhaust Traffic Particles Derived from Atmospheric Measurements. Environmental Science & Technology, 46(12), 6523-6529. https://doi.org/10.1021/es300894r
Heslin-Rees, D., Burgos, M., Hansson, H. C., Krejci, R., Ström, J., Tunved, P., & Zieger, P. (2020). From a polar to a marine environment: has the changing Arctic led to a shift in aerosol light scattering properties? Atmos. Chem. Phys., 20(21), 13671-13686. https://doi.org/10.5194/acp-20-13671-2020
Hsiao, T.-C., Chen, D.-R., Li, L., Greenberg, P., & Street, K. W. (2010). Development of a Multi-Stage Axial Flow Cyclone. Aerosol Science and Technology, 44(4), 253-261. https://doi.org/10.1080/02786820903575394
Huneeus, N., Schulz, M., Balkanski, Y., Griesfeller, J., Prospero, J., Kinne, S., . . . Zender, C. S. (2011). Global dust model intercomparison in AeroCom phase I. Atmos. Chem. Phys., 11(15), 7781-7816. https://doi.org/10.5194/acp-11-7781-2011
Hurrell, J. W., Holland, M. M., Gent, P. R., Ghan, S., Kay, J. E., Kushner, P. J., Marshall, S. (2013). The Community Earth System Model: A Framework for Collaborative Research. Bulletin of the American Meteorological Society, 94(9), 1339-1360. https://doi.org/https://doi.org/10.1175/BAMS-D-12-00121.1
Indoitu, R., Kozhoridze, G., Batyrbaeva, M., Vitkovskaya, I., Orlovsky, N., Blumberg, D., & Orlovsky, L. (2015). Dust emission and environmental changes in the dried bottom of the Aral Sea. Aeolian Research, 17, 101-115. https://doi.org/https://doi.org/10.1016/j.aeolia.2015.02.004
Jaenicke, R., & Junge, C. (1967). Studien zur oberen Grenzgröße des natürlichen Aerosols. Beitr. Phys. Atmos./Contrib. Atmos. Phys, 40, 129-143.
Jeong, C.-H., Wang, J. M., Hilker, N., Debosz, J., Sofowote, U., Su, Y., . . . Evans, G. J. (2019). Temporal and spatial variability of traffic-related PM2.5 sources: Comparison of exhaust and non-exhaust emissions. Atmospheric Environment, 198, 55-69. https://doi.org/https://doi.org/10.1016/j.atmosenv.2018.10.038
Jiang, N., Wang, K., Yu, X., Su, F., Yin, S., Li, Q., & Zhang, R. (2018). Chemical Characteristics and Source Apportionment by Two Receptor Models of Size-segregated Aerosols in an Emerging Megacity in China. Aerosol and Air Quality Research, 18(6), 1375- 1390. https://doi.org/10.4209/aaqr.2017.10.0413
Johnston, J. E., Razafy, M., Lugo, H., Olmedo, L., & Farzan, S. F. (2019). The disappearing Salton Sea: A critical reflection on the emerging environmental threat of disappearing saline lakes and potential impacts on children’s health. Science of The Total Environment, 663, 804- 817. https://doi.org/https://doi.org/10.1016/j.scitotenv.2019.01.365
Jung, C.-C., Wu, P.-C., Tseng, C.-H., Chou, C. C. K., & Su, H.-J. (2018). Contribution of Indoor- and Outdoor-Generated Fine and Coarse Particles to Indoor Air in Taiwanese Hospitals. Aerosol and Air Quality Research, 18(12), 3234-3242. https://doi.org/10.4209/aaqr.2018.01.0006
Kang, C.-M., Gold, D., & Koutrakis, P. (2014). Downwind O3 and PM2.5 speciation during the wildfires in 2002 and 2010. Atmospheric Environment, 95, 511-519. https://doi.org/https://doi.org/10.1016/j.atmosenv.2014.07.008
Karanasiou, A., Amato, F., Moreno, T., Lumbreras, J., Borge, R., Linares, C., . . . Querol, X. (2014). Road Dust Emission Sources and Assessment of Street Washing Effect. Aerosol and Air Quality Research, 14(3), 734-743. https://doi.org/10.4209/aaqr.2013.03.0074Kulkarni, P., Baron, P. A., & Willeke, K. (2011). Aerosol measurement: principles, techniques, and applications. John Wiley & Sons.
Lang, O. I., Mallia, D., & McKenzie Skiles, S. (2023). The shrinking Great Salt Lake contributes to record high dust-on-snow deposition in the Wasatch Mountains during the 2022 snowmelt season. Environmental Research Letters, 18(6), 064045. https://doi.org/10.1088/1748-9326/acd409
Lim, J.-H., Nam, S. H., Kim, J., Kim, N. H., Park, G.-S., Maeng, J.-S., & Yook, S.-J. (2021).
High-volume sampler for size-selective sampling of bioaerosols including viruses. Atmospheric Environment, 265, 118720. https://doi.org/https://doi.org/10.1016/j.atmosenv.2021.118720
Lin, J., Shen, X., Xing, L., Che, H., & Holben, B. N. (2021). Analysis of Aerosol Type and Fine- and Coarse-mode Aerosol Direct Radiative Forcing over Regions in East and Southeast Asia Based on AERONET Version 3 Data. Aerosol and Air Quality Research, 21(7), 200503. https://doi.org/10.4209/aaqr.200503
Lundgren, D. A., & Paulus, H. J. (1975). The Mass Distribution of Large Atmospheric Particles. Journal of the Air Pollution Control Association, 25(12), 1227-1231. https://doi.org/10.1080/00022470.1975.10470200
Ma, Y., Liu, A., Egodawatta, P., McGree, J., & Goonetilleke, A. (2017). Quantitative assessment of human health risk posed by polycyclic aromatic hydrocarbons in urban road dust. Science of The Total Environment, 575, 895-904. https://doi.org/https://doi.org/10.1016/j.scitotenv.2016.09.148
Micklin, P. (2007). The Aral Sea Disaster. Annual Review of Earth and Planetary Sciences, 35(1), 47-72. https://doi.org/10.1146/annurev.earth.35.031306.140120
Miller, F. J., Gardner, D. E., Graham, J. A., Lee, R. E., Wilson, W. E., & Bachmann, J. D. (1979). Size Considerations for Establishing a Standard for Inhalable Particles. Journal of the Air Pollution Control Association, 29(6), 610-615. https://doi.org/10.1080/00022470.1979.10470831
Molina Rueda, E., Carter, E., L’Orange, C., Quinn, C., & Volckens, J. (2023). Size-Resolved Field Performance of Low-Cost Sensors for Particulate Matter Air Pollution. Environmental Science & Technology Letters, 10(3), 247-253. https://doi.org/10.1021/acs.estlett.3c00030
Narayana, M. V., Jalihal, D., & Nagendra, S. M. S. (2022). Establishing A Sustainable Low- Cost Air Quality Monitoring Setup: A Survey of the State-of-the-Art. Sensors, 22(1).
Neff, J. C., Reynolds, R. L., Munson, S. M., Fernandez, D., & Belnap, J. (2013). The role of dust storms in total atmospheric particle concentrations at two sites in the western U.S. Journal of Geophysical Research: Atmospheres, 118(19), 11,201-211,212. https://doi.org/https://doi.org/10.1002/jgrd.50855
Nikandrova, A., Tabakova, K., Manninen, A., Väänänen, R., Petäjä, T., Kulmala, M., . . . O’Connor, E. (2018). Combining airborne in situ and ground-based lidar measurements for attribution of aerosol layers. Atmos. Chem. Phys., 18(14), 10575-10591. https://doi.org/10.5194/acp-18-10575-2018
Noll, K. E. (1970). A rotary inertial impactor for sampling giant particles in the atmosphere. Atmospheric Environment (1967), 4(1), 9-19. https://doi.org/https://doi.org/10.1016/0004-6981(70)90050-8
Oroumiyeh, F., & Zhu, Y. (2021). Brake and tire particles measured from on-road vehicles: Effects of vehicle mass and braking intensity. Atmospheric Environment: X, 12, 100121. https://doi.org/https://doi.org/10.1016/j.aeaoa.2021.100121
Pant, P., & Harrison, R. M. (2013). Estimation of the contribution of road traffic emissions to particulate matter concentrations from field measurements: A review. Atmospheric Environment, 77, 78-97. https://doi.org/https://doi.org/10.1016/j.atmosenv.2013.04.028
Petersen, R. C., Hallar, A. G., McCubbin, I. B., Ogren, J. A., Andrews, E., Lowenthal, D., Novosselov, I. (2019). Numerical, wind-tunnel, and atmospheric evaluation of a turbulent ground-based inlet sampling system. Aerosol Science and Technology, 53(6), 712-727. https://doi.org/10.1080/02786826.2019.1602718
Ray, A. E., & Vaughn, D. L. (2009). Standard operating procedure for the continuous measurement of particulate matter. Thermo Scientific TEOM.
Ryder, C. L., Highwood, E. J., Walser, A., Seibert, P., Philipp, A., & Weinzierl, B. (2019). Coarse and giant particles are ubiquitous in Saharan dust export regions and are radiatively significant over the Sahara. Atmos. Chem. Phys., 19(24), 15353-15376. https://doi.org/10.5194/acp-19-15353-2019
Ryu, S. Y., Kwon, B. G., Kim, Y. J., Kim, H. H., & Chun, K. J. (2007). Characteristics of biomass burning aerosol and its impact on regional air quality in the summer of 2003 at Gwangju, Korea. Atmospheric Research, 84(4), 362-373. https://doi.org/https://doi.org/10.1016/j.atmosres.2006.09.007
Ryu, Y. H., & Min, S. K. (2022). Improving Wet and Dry Deposition of Aerosols in WRF‐ Chem: Updates to Below‐Cloud Scavenging and Coarse‐Particle Dry Deposition [Article]. Journal of Advances in Modeling Earth Systems, 14(4), 1-16. https://doi.org/10.1029/2021MS002792
Sanchez-Marroquin, A., Arnalds, O., Baustian-Dorsi, K. J., Browse, J., Dagsson- Waldhauserova, P., Harrison, A. D., . . . Murray, B. J. Iceland is an episodic source of atmospheric ice-nucleating particles relevant for mixed-phase clouds. Science Advances, 6(26), eaba8137. https://doi.org/10.1126/sciadv.aba8137
Schweizer, D., Cisneros, R., & Buhler, M. (2019). Coarse and Fine Particulate Matter Components of Wildland Fire Smoke at Devils Postpile National Monument, California, USA. Aerosol and Air Quality Research, 19(7), 1463-1470. https://doi.org/10.4209/aaqr.2019.04.0219
Sirithian, D., & Thanatrakolsri, P. (2022). Relationships between Meteorological and Particulate Matter Concentrations (PM2.5 and PM10) during the Haze Period in Urban and Rural Areas, Northern Thailand. Air, Soil and Water Research, 15, 11786221221117264. https://doi.org/10.1177/11786221221117264
Skiles, S. M., Mallia, D. V., Hallar, A. G., Lin, J. C., Lambert, A., Petersen, R., & Clark, S. (2018). Implications of a shrinking Great Salt Lake for dust on snow deposition in the Wasatch Mountains, UT, as informed by a source to sink case study from the 13–14 April 2017 dust event. Environmental Research Letters, 13(12), 124031. https://doi.org/10.1088/1748- 9326/aaefd8
Song, C., Dall’Osto, M., Lupi, A., Mazzola, M., Traversi, R., Becagli, S., . . . Shi, Z. (2021). Differentiation of coarse-mode anthropogenic, marine and dust particles in the High Arctic islands of Svalbard. Atmos. Chem. Phys., 21(14), 11317-11335. https://doi.org/10.5194/acp-21- 11317-2021
Sparks, T. L., & Wagner, J. (2021). Composition of particulate matter during a wildfire smoke episode in an urban area. Aerosol Science and Technology, 55(6), 734-747. https://doi.org/10.1080/02786826.2021.1895429
Steenburgh, W. J., Massey, J. D., & Painter, T. H. (2012). Episodic dust events of Utah’s Wasatch Front and adjoining region. Journal of Applied Meteorology and Climatology, 51(9), 1654-1669.
Stone, E. A., Yoon, S.-C., & Schauer, J. J. (2011). Chemical Characterization of Fine and Coarse Particles in Gosan, Korea during Springtime Dust Events. Aerosol and Air Quality Research, 11(1), 31-43. https://doi.org/10.4209/aaqr.2010.08.0069
Suburairat, K., & Bunjongsiri, K. (2020). The quantitative relationships of particulate matter (PM10 and PM2. 5) in each region and season. วารสาร วิทยาศาสตร ์และ เทคโนโลยี หัวเฉียว เฉลิมพระเกียรติ ISSN 2651-2483 (Online)(TCI Tier 2), 6(1), 93-103.
Taing, C., Ackerman, K. L., Nugent, A. D., & Jensen, J. B. (2021). A New Instrument for Determining the Coarse-Mode Sea Salt Aerosol Size Distribution [Article]. Journal of Atmospheric & Oceanic Technology, 38(11), 1935-1947. https://doi.org/10.1175/JTECH-D-20- 0197.1
Tanaka, T. Y., & Chiba, M. (2006). A numerical study of the contributions of dust source regions to the global dust budget. Global and Planetary Change, 52(1), 88-104. https://doi.org/https://doi.org/10.1016/j.gloplacha.2006.02.002
Tong, D., Feng, I., Gill, T. E., Schepanski, K., & Wang, J. (2023). How Many People Were Killed by Windblown Dust Events in the United States? Bulletin of the American Meteorological Society, 104(5), E1067-E1084. https://doi.org/https://doi.org/10.1175/BAMS- D-22-0186.1
Tong, D. Q., Wang, J. X. L., Gill, T. E., Lei, H., & Wang, B. (2017). Intensified dust storm activity and Valley fever infection in the southwestern United States. Geophysical Research Letters, 44(9), 4304-4312. https://doi.org/https://doi.org/10.1002/2017GL073524
Vicente, A., Alves, C., Calvo, A. I., Fernandes, A. P., Nunes, T., Monteiro, C., . . . Pio, C. (2013). Emission factors and detailed chemical composition of smoke particles from the 2010 wildfire season. Atmospheric Environment, 71, 295-303. https://doi.org/https://doi.org/10.1016/j.atmosenv.2013.01.062
Wang, L., Wanjura, J., Parnell, C., Lacey, R., & Shaw, B. (2005). Performance characteristics of a low-volume PM10 sampler. Transactions of the ASAE, 48(2), 739-748.
Wurtsbaugh, W. A., Miller, C., Null, S. E., DeRose, R. J., Wilcock, P., Hahnenberger, M., Moore, J. (2017). Decline of the world’s saline lakes. Nature Geoscience, 10(11), 816-821. https://doi.org/10.1038/ngeo3052
Yang, H.-H., Chiang, C.-F., Lee, W.-J., Hwang, K.-P., & Wu, E. M.-Y. (1999). Size distribution and dry deposition of road dust PAHs. Environment International, 25(5), 585-597. https://doi.org/https://doi.org/10.1016/S0160-4120(99)00036-7
