College of Social and Behavioral Science
171 Neighborhood Impact on Food Accessibility, Availability, and Price in Salt Lake City
Trey Rainford; Liz Wahlen; Nick Hunter; and Brandon Haddock
Faculty Mentor: Lazarus Adua (Sociology, University of Utah)
Abstract
The availability and price of food across different food outlets has the potential to influence purchasing patterns, dietary intake, and overall health of individuals. This study examined if neighborhood income level has an impact on the availability and price of different food items in a sample of Salt Lake City supermarkets, gas station/convenience stores, and ethnic markets
(N=29). The pricing of eight different food types commonly found in grocery stores was compared among selected stores to determine variations in availability and price. These food types included white bread, wheat bread, whole milk, one dozen eggs, bananas, apples, potatoes, and carrots. U.S. Census Data was used to categorize neighborhoodsby income level and internet information was used to identify each neighborhood’s retail food outlets. The resultsrevealed that median household income was significantly associated with food accessibility, availability, and cost. Higher-income neighborhoods contained more supermarkets, while lower-income neighborhoods were limited to smaller ethnic markets and gas station/convenience stores. The selected food items were more commonly found in stores located in higher-income neighborhoods, whereas lower-income neighborhoods had fewer items available similar to findings from existing research (Baker et al., 2006). Food items sold in gas stations and convenience storeswere notably more expensive than those sold in supermarkets. The implications of this study could be used to increase access to supermarkets offering lower prices and therefore optimize food access and availability.
Introduction
The effect of neighborhood demographics on food availability, quality, and cost has become increasingly morestudied and recognized. While these factors have been studied in several other cities in the United States, research has been limited in Salt Lake City. It is important to discuss the significance of the research that has already been conducted in other locations before considering our own research, to ensure its credibility and validity.
A cross-sectional study was performed in Baltimore, MD in 2006 (Franco et al., 2008) to examine the relationships between the availability of healthy foods and racial and income neighborhood composition. The study found that predominantly black and lower-class communities have less access to nutritious foods than white and higher-class neighborhoods. When assessing the correlation between economic and nutritional variations in contrasting neighborhoods of Canada (Latham & Moffat, 2007), it was found that there was no difference in food cost between thedifferent stores in the study. However, it was found that variety stores predominated in the lower-income neighborhood, carrying fewer produce goods and fewer healthful foods overall. Low income, limited access to transportation, and limited availability of nutritious foods (especially fresh fruits and vegetables) might make it more challenging for people living in low-income neighborhoods to maintain a balanced diet.
Racial segregation is also a commonly measured variable with income level when examining food availability. Research performed in Mississippi, North Carolina, Maryland, and Minnesota (Morland et al., 2002) to examine how food stores and food service establishments are distributed based on racial segregation and neighborhood wealth, foundthat wealthier neighborhoods had larger numbers of supermarkets and gas stations with convenience stores than the poorest neighborhoods. Poor and minority populations may not have equal access to the range of healthful food options available to nonminority and rich communities if they do not have access to supermarkets, which provide a large variety of foods at more affordable prices.
While most research reports a positive relationship between income level and food availability/quality, research in Vermont and Arkansas (Krukowski et al., 2010) found that based on the demographics around studied stores, the quality of healthy food options did not change in supermarkets and grocery stores. The cost of healthier food optionsdid not significantly differ across the neighborhoods under investigation. However, it was found that larger retailers typically provided healthier products at more affordable pricing which does bring concern since areas of lower income tend to have less access to large food stores.
This study examines if any relationship exists between the availability and price of food in low and high-income level neighborhoods in Salt Lake City. We investigated the availability of eight different common food items (4 produce items, and 4 non-produce items) and compared the prices of the respective items between stores in different income-level neighborhoods. It is hypothesized that these items will be less available in lower-income than higher-income neighborhoods. It is also hypothesized that the items will be more expensive in neighborhoods of lower income than in higher- income neighborhoods. If the level of income in Salt Lake City neighborhoods decreases, then the access to affordable food options decreases.
The theory is based on the notion that socioeconomic position is a broad variable that affects many facets of personal life. The hypothesis’s direction stems from an awareness of the intricate connections between socioeconomic factors and the local food landscape, as well as research that has already been conducted in other cities.
Neighborhood disparities in access to food are of great concern because of their potential to influence various aspects of health. Further study is required to address the different constraints of existing research, pinpoint efficacious policy measures, and assess strategies for intervention aimed at fostering equitable access to healthy food (Larson et al., 2009). The types of concerns this research project raises canhelp shape policy responses that could improve the health of low-income Salt Lake City residents and others. Reporting on this research will help readers understand what relationship exists between socioeconomic status and the difficulty in acquiring affordable food in Salt Lake City.
Methods
Data
Mapping of high and low-income neighborhoods in Salt Lake City was performed based on median household income. Three high-income level neighborhoods were identified: The Greater Avenues, Yalecrest, and EastBench/Foothill. Three low-income level neighborhoods were identified: Central City, Poplar Grove/Fairpark, and West Capitol Hill.
We first identified each neighborhood’s retail food outlets including supermarkets, ethnic markets, and gasstations/convenience stores with internet information. Supermarkets are classified as large, corporate-owned chain stores(Walmart, Target, Kroger, Harmons, etc). Membership clubs and warehouse stores were not included in the research. Food accessibility will be assessed based on the number and type of food outlets in different neighborhoods.
We then recorded item prices at the identified retail food outlets for the following items that are frequently found in the American diet: white bread, wheat bread, whole milk, one dozen eggs, bananas, apples, potatoes, andcarrots (Glanz et al., 2007). The price per pound was compared for the fruit and vegetable items. To keep data consistent we compared the lowest-priced items for each respective category, not including sale items.
Given our time and resources to complete the research, we used covert observation as our method of data collection. Each group member was tasked with collecting data from one or two different neighborhoods. They were responsible for identifying the different food outlets in the neighborhood, and then recording the prices of the compared items at the different outlets by physically visiting the outlets and collecting the data. We did not identify ourselves as researchers when collecting the data.
Sample
To address our research question, we evaluated the pricing and availability of eight different types of food commonly found in grocery stores. Each team member assigned to a neighborhood visited stores within their designated area relevant to our research. They then documented the pricing and availability of the eight food types listedabove. This sample is suitable for addressing our research question because it provides us with a real-world evaluation of the food environment residents in our selected neighborhoods deal with daily. By collecting data from these food environments, we gain a direct assessment of food access. Additionally, collecting data on the pricing and availability of foods is a feasible approach, allowing us to compare data across multiple locations in a measurable and tangible manner.
The data from this sample may be generalized to a broader area of Salt Lake City. Our sample size, consisting of eight different types of foods from various stores in six different neighborhoods, provides us with a diverse range of information applicable to other neighborhoods in Salt Lake City. This data will reliably help us understand the disparities in food access and pricing in surrounding areas.
Our sample utilized a nonprobability-based method. We selected stores accessible to us that are specifically representative of different types of food retailers such as supermarkets, gas stations, and ethnic markets.
Measures
We measured the accessibility and price of food at different food outlets in high and low- income level neighborhoods in Salt Lake City. The accessibility and price of food is the access by individuals to adequate resources for acquiring appropriate foods for a nutritious diet at an affordable cost. We measured this by identifying each neighborhood’s different food outlets (supermarkets, ethnic markets, gasstations/convenience stores) and excluded membership clubs. We then recorded the price of a controlled set of eight different food items among the different food outlets in various Salt Lake City neighborhoods. Information from the U.S. Census Bureau was used and defines the high-income- level neighborhoods with a median household income greater than $100,000. Low-income-level neighborhoods are defined with a median household income of less than $50,000 (United States Census Bureau, 2021). A map of the neighborhoods by income level can be seen in Appendix 3.
Analysis
A spreadsheet (Appendix 1) was created which was used to track the price of different food items at the various food outlets. The prices of the different food items were averaged among neighborhoods and income levels to comparehow the price of food changes by different neighborhood income levels in Salt Lake City. Accessibility was analyzed based on the number and type of food outlets within different neighborhoods. Food outlets were categorized by supermarkets, ethnic markets, and gas stations/convenience stores. The number of each of these stores was divided bythe total number of stores in that income level to give a composition of the different outlet types in percentages.
Results
Neighborhood income level (based on median household income) was significantly associated with food accessibility, availability, and cost among the sample. Food accessibility was analyzed based on the number and type offood outlets within different neighborhoods. The total sample size for stores between the three low-income levelneighborhoods was n=18. Of these total stores, 14 were gas station/convenience stores (78%), 3 were ethnic markets (17%), and 1 was a supermarket (5%). The total sample size for stores between the high-income level neighborhoods was n=11. Of the total stores, 7 were gas station/convenience stores (64%) and 4 were supermarkets (36%). There were no ethnic markets identified among the three high-income level neighborhoods.
The accessibility of supermarkets (Block & Kouba, 2006) in comparison to smaller grocery and conveniencestores may be a significant factor in healthy food availability. However, supermarkets are less likely to be found in low-income neighborhoods. Higher-income neighborhoods featured more supermarkets, while lower-income neighborhoods were limited to smaller ethnic markets and gas station/convenience stores. Among these stores, select food items were found with greater frequency on the shelves of stores in high-income level neighborhoods. White and wheat bread were found in all 11 stores in high-income neighborhoods. Low-income neighborhoods had less availability, with white breadonly being found in 12 stores (67%) and wheat bread found in 11 stores (61%). Whole milk was found in 10/11 (91%)high-income neighborhood stores, while only found in 13/18 (72%) low-income neighborhood stores. Dozen eggs werealso found at a greater frequency in high-income neighborhood stores, being found in 7 stores (64%), while only being found in 8/18 (44%) low-income neighborhood stores. Produce items were also more available among food outlets based in high-income level neighborhoods. Apples were found in 10/11 (91%) high-income neighborhood stores while being limited to 55% (10/18) in low-income level neighborhood stores. Bananas were available in 8/18 (44%) low-income level neighborhood stores but found at a higher frequency of 55% (6/11) of stores in higher-income neighborhoods. Potatoes and carrots were both only available at 2/18 (11%) lower- income neighborhood stores. The vegetables were both available at 36% (4/11) of stores in the higher- income level neighborhoods.
Along with the availability of select food items being more limited in lower-income level neighborhoods, the cost of seven of the eight select food items was also significantly more expensive in low-income level neighborhoods.The following is a list of the average cost of the eight select food items between the 18 stores in the three different low-income level neighborhoods: white bread ($3.17), wheat bread ($3.12), whole milk gallon ($5.11), dozen eggs ($4.59), apples ($3.17/lb), bananas ($1.79/lb),potatoes ($1.39/lb), and carrots ($1.49/lb). The following is a list of the average cost of the eight select food items between the 11 stores in the three different high-income level neighborhoods: white bread ($3.03), wheat bread ($3.51), whole milk gallon ($3.90), dozen eggs ($3.33), apples ($2.16/lb), bananas ($1.39/lb), potatoes ($0.87/lb), and carrots ($1.29/lb).
Discussion
The purpose of this study was to determine if the price and accessibility of nutrient-dense food differs in neighborhoods in both high and low-income areas. Using covert observation to collect data, we found that food itemssold in ethnic markets, gas stations, and convenience stores are significantly more expensive than those sold in supermarkets. Data also showed that access to grocery stores in low-income neighborhoods is lower, while access to convenience stores and gas stations is much higher. Food was also less available among stores in low-income neighborhoods than in high-income neighborhoods.
We hypothesized that lower-income neighborhoods would have higher food prices and less access to food when compared to higher-income neighborhoods. This hypothesis comes from the connection between socioeconomic factorsand the food environment found in previous research from other cities. A study conducted in the Southeastern United States (Wilcox et al., 2018) found that nutritional concerns were apparent in disadvantaged populations. Socioeconomic factors were associated with poor diet quality and challenges with meeting dietary guidelines. Our research data supported our hypothesis, showing a significant correlation between socioeconomic factors and both food accessibility and cost.
This study has multiple strengths. By using a direct observation method to collect data, physically visiting our selected stores allowed for firsthand observation and the gathering of accurate and reliable data. We also usedcomparative analysis to reach our conclusion; from doing so, we were able to clearly see the disparities that would have otherwise been hidden if the data had been summarized or combined.
This study covered 6 different neighborhoods within the Salt Lake City valley, excluding 16 other neighborhoodsin the city. The number of neighborhoods we sampled could limit the findings in our study. We used the internet to searchfor stores within the selected areas, potentially missing some stores not listed in our internet searches.
The findings of this study are relevant because they address the notable disparities in food access based on different levels of income. It is necessary to understand the ongoing issues of food insecurity and the inability to access nutritious food because the accessibility to nutrient-dense foods is crucial for improving public health and preventing diet-related health issues. The research findings on food access disparities could potentially help inform the development of policy changes that are aimed at solving this problem. Policymakers who are informed of this study could use the data to create programs or interventions that are designed to improve accessibility to healthy foods in every neighborhood regardless of income status.
Appendix

- Photo of store/cost spreadsheet used for data collection and analysis.
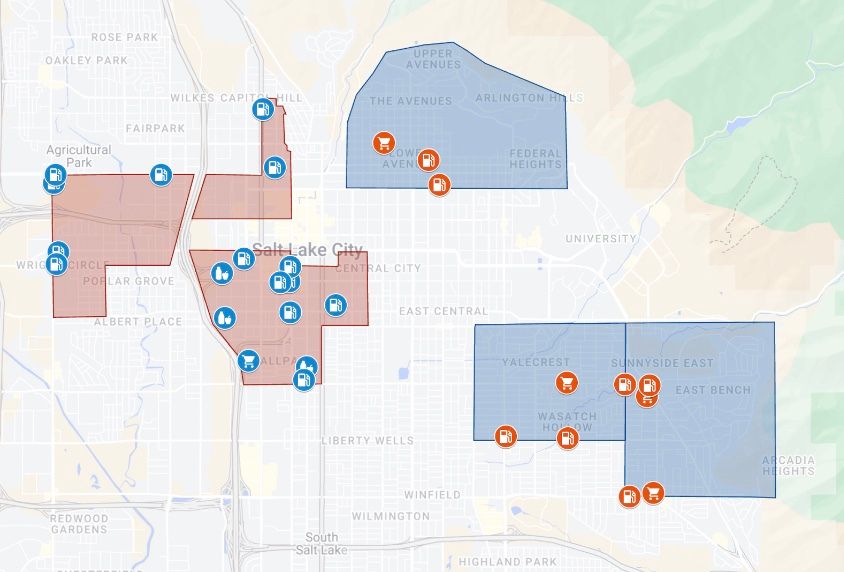
- Map of studied neighborhoods with food outlet locations depicted with icons. Icons are represented as follows: gas stations/convenience stores with a gas pump; supermarkets with a shopping cart; and ethnic markets with a bottle and apple.
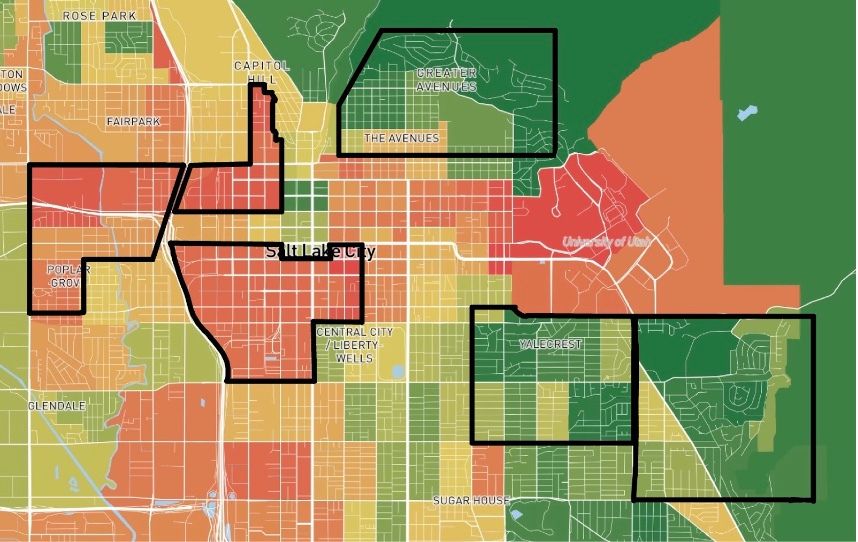
- Map of studied neighborhoods by median household income.
References
Baker, E. A., Schootman, M., Barnidge, E., & Kelly, C. (2006). The role of race and poverty in access to foods that enable individuals to adhere to dietary guidelines. Preventing chronic disease, 3(3), A76.
Block, D., & Kouba, J. (2006). A comparison of the availability and affordability of a market basket in twocommunities in the Chicago area. Public health nutrition, 9(7), 837–845. https://doi.org/10.1017/phn2005924
Glanz, K., Sallis, J. F., Saelens, B. E., & Frank, L. D. (2007). Nutrition Environment Measures Survey in stores (NEMS-S): development and evaluation. American journal of preventive medicine, 32(4), 282–289. https://doi.org/10.1016/j.amepre.2006.12.019
Jim Latham, Tina Moffat, Determinants of variation in food cost and availability in two socioeconomically contrasting neighbourhoods of Hamilton, Ontario, Canada, Health & Place, Volume 13, Issue 1, 2007, Pages 273-287, ISSN 1353-8292, https://doi.org/10.1016/j.healthplace.2006.01.006.
Kimberly Morland, Steve Wing, Ana Diez Roux, Charles Poole, Neighborhood characteristics associated withthe location of food stores and food service places, American Journal of Preventive Medicine, Volume 22, Issue 1, 2002, Pages 23-29, ISSN0749-3797, https://doi.org/10.1016/S0749-3797(01)00403-2.
Krukowski, R.A., West, D.S., Harvey-Berino, J. et al. Neighborhood Impact on Healthy FoodAvailability and Pricing in Food Stores. J Community Health 35, 315–320 (2010). https://doi.org/10.1007/s10900-010-9224-y
Manuel Franco, Ana V. Diez Roux, Thomas A. Glass, Benjamín Caballero, Frederick L. Brancati, NeighborhoodCharacteristics and Availability of Healthy Foods in Baltimore, American Journal of Preventive Medicine, Volume 35, Issue 6, 2008, Pages 561-567, ISSN 0749-3797, https://doi.org/10.1016/j.amepre.2008.07.003.
Nicole I. Larson, Mary T. Story, Melissa C. Nelson, Neighborhood Environments: Disparities in Access toHealthy Foods in the U.S., American Journal of Preventive Medicine, Volume 36, Issue 1, 2009, Pages 74-81.e10, ISSN 0749-3797, https://doi.org/10.1016/j.amepre.2008.09.025.
U.S. Census Bureau. (n.d.). Salt Lake City, UT QuickFacts. Retrieved from https://data.census.gov/map/.
Wilcox, S., Sharpe, P. A., Liese, A. D., Dunn, C. G., & Hutto, B. (2018). Socioeconomic factors associated with diet quality and meeting dietary guidelines in disadvantaged neighborhoods in the Southeast United States. Ethnicity & Health, 25(8), 1–17. https://doi.org/10.1080/13557858.2018.1493434
