College of Mines and Earth Sciences
101 Analysis of March 2nd Event as a Case Study for Dust Transport in the Salt Lake Valley
Angelina Miller
Faculty Mentor: Gannet Hallar (Atmospheric Sciences, University of Utah)
Abstract
Dust events happen when high wind blows through an area of available dirt that can be carried hundreds of miles across the globe. This dust can have devastating health, safety, and climate effects on surrounding urban and natural areas. When extreme dust events occur, there are more visits to hospitals for respiratory issues, visibility can dramatically drop to dangerous levels for roadways, and dust deposited on snow can increase springtime melt (Skiles et al 2018). These combined make the study of dust events, similar to the one that occured on March 2nd, 2024 in the Salt Lake Valley, important to understand. This paper aims to outline previous research done on dust events in the Salt Lake valley to better understand the sources of dust, causes, and effects of the case study on March 2nd in the Salt Lake Area. Analysis of the weather patterns and wind trajectories from this event show that instead of dust from the drying Great Salt Lake the dust from this event came from dry desert playas in the Sevier/Tule region of Utah’s west desert. The weather event that caused it is a cold front pushing through with high winds from the NW. Although monitors pick up dust in the valley the readings drop off after the Wasatch mountains meaning it likely deposited on the snowpack which is shown to contribute to up to two weeks (Lang et al 2022) shorter ski season having devastating effects on tourism and groundwater recharge.
Introduction
Salt Lake City, UT, is a busy metropolitan area located in a valley with unique topographic attributes that can form a strong stable layer in the valley and trap pollution. Events like these, known informally as inversions because of the temperature gradient inversion that is characteristic of this stable layer in the atmosphere, cause Salt Lake City to have some of the worst air quality in the country in the winter. Conditions can last for days allowing emissions from commuters, industrial practices, and utilities to fill the valley and pollution to double every day. The only way for a stable cold pool inversion to be cleared away is by a system with high winds or precipitation moving through to change the vertical mixing and remove some of the trapped particles from the area. But it is not only in the winter that the Salt Lake Valley is plagued with poor air quality. During the summer the county is out of compliance for high ozone due to a combination of local and regional precursor gasses that aid in the formation of tropospheric ozone. Additionally, high wind events during the spring and extreme forest fire and transport events during the summer and fall also affect the air quality. The majority of storm systems that enter the region move in from the west and have to pass over several arid desert regions such as the West Desert before reaching the Salt Lake valley(Attah et al 2023). This allows for the uplift, transport, and subsequent deposition of available dust from these regions to the Wasatch mountains. With dust on snow having faster melting rates, and metropolitan water availability for the Wasatch Front, agricultural industry, and the Great Salt Lake (GSL) all depending on spring melt, the effects of dust events have broad implications. The Great Salt Lake has been rapidly shrinking (Attah et al 2023) due to diversions of water from the watersheds upstream for mostly agricultural uses. This is cause for concern because as a terminal lake there are hundreds of years of build up of metals and chemicals in the water and as the shoreline recedes to historically low levels and more lakebed is exposed these metals are potentially being made available for transport towards the surrounding urban centers (Attah et al 2023). Not only do events like this affect the air quality of Salt Lake, but also the climate.
Aerosols, which include dust or any particle suspended in the air, solid or liquid, can have detrimental health effects and effects on climate both direct and indirect. They can affect the climate directly by absorbing or reflecting solar irradiance or indirectly by acting as nuclei for cloud formation or by changing the albedo of snow. Each of these effects can have either warming or cooling effects which makes aerosols some of the biggest uncertainties in global climate models (Hallar et al 2016). The positive and negative effects that can have on radiative forcing depend entirely on their size and composition of these aerosols, so understanding global distribution of these particles can lead to better predictions of future climate (Whiteman et al 2014). Additionally, these particles in a place like Salt Lake City which lays claim to “the Greatest Snow on Earth” can have major effects on the snow climate and in turn affect the local tourism industry, losing the government billions (Steed et al 2024).
Methods
Instrumentation on the roof of the University of Utah’s William Browning Building is continuously collecting data on aerosol size and concentration as well as some chemical composition for key atmospheric gasses. On the day of March 2nd after witnessing poor visibility I decided to analyze the data from these instruments further to try and understand the particles that were causing this low visibility, how long the event lasted, and where they might have come from. This data was used to determine the timing of the dust event. The instrumentation initially used for investigating the event were measurements of PM10 and PM2.5 from the Tapered Element Oscillating Microbalance (TEOM), and of nanoparticles from the Scanning Mobility Particle Sizer (SMPS). These data were then used in conjunction with Mesowest weather station data to determine the start of the dust event. Wind direction and speed on pressure maps were used to pinpoint the passage of the front through the valley to determine if the dust that blew through the Salt Lake Valley was primarily pre-frontal or post-frontal dust. Back Trajectories were run to estimate the source of the particles measured by the instrumentation and the pathway that the air parcels carrying the dust would have taken.
All of this data together was used to highlight the possible causes and sources of dust events in the Salt Lake Valley and determine if the event that occurred on march 2nd could be classified as a dust event. This is important to know as the increasingly exposed lake bed of the Great Salt Lake allows for more, potentially harmful, dust to be available for transport (Attah et al 2023). The purpose of this analysis is to determine when the dust passed through, where it might have come from, and show when it was washed out of the air by compiling data from several different sources and instruments. This will be helpful in gathering data that can be analyzed further by future researchers to determine where the dust for this particular event ended up and what the possible effects are.
Results/Discussion
On the day of the event, the Department of transportation issued a warning that visibility had dropped below 1 mile by 9:40 in the morning. Then later in the day DOT posted a warning about the snow storm blowing through. This is reflected in the data gathered by the nanoparticle instrument in Figure 1. This figure shows a clear increase in larger particles in the hours leading up to the start of precipitation. This high concentration of larger sized particles corresponds with the lowest visibility from 10-11am. As seen in this graph, precipitation, which began around noon, removed particles from the air by effectively washing them away. The snow that started at 12pm was less efficient at grabbing onto these particles as rain is (CITE) and so shows some spotty decreases in particles before eventually switching to rain and showing a clear drop off in particles of all sizes. Although there are not extremely high concentrations of larger particles their larger surface area allows for more impact on visibility with less particles.
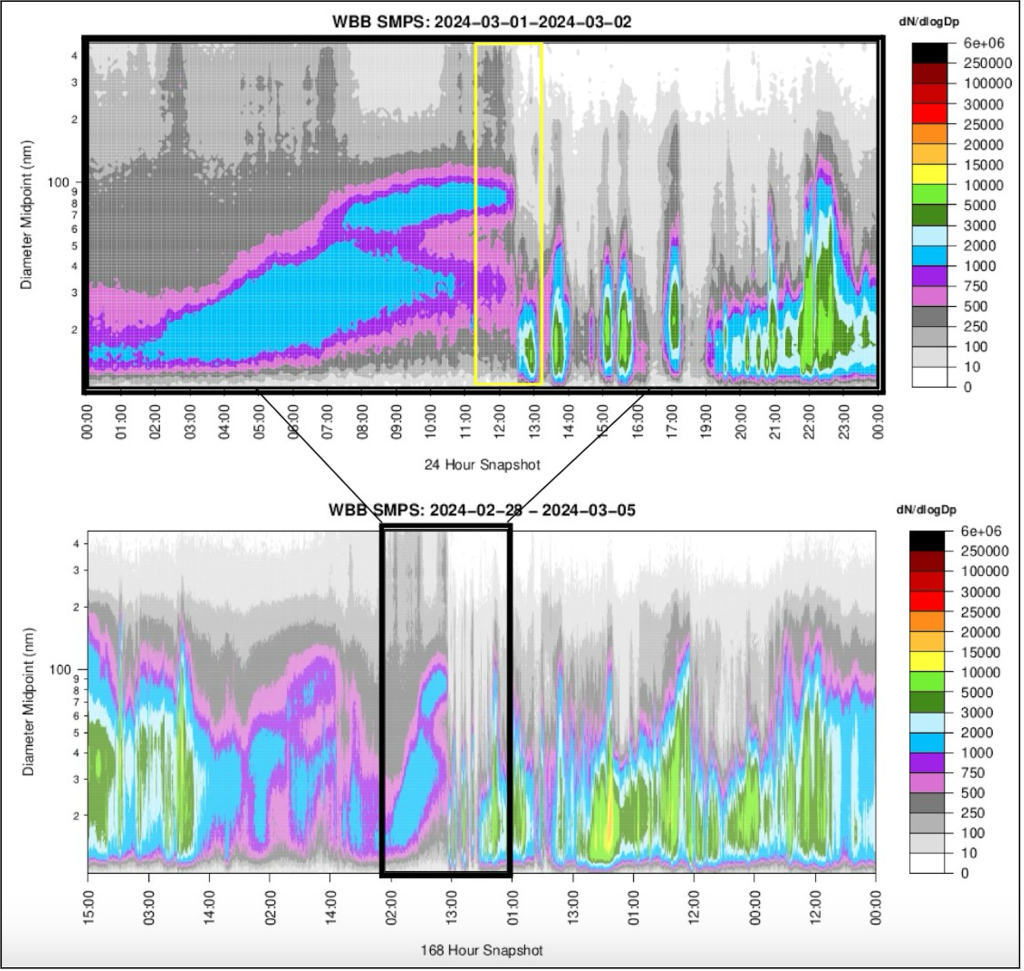
Figure 1: This figure shows the size (diameter) of the particles in relation to the time of day during the end of the dust event. The amount of particles is represented by the colors shown in the color gradient on the right side. The top panel shows data from March 2nd highlighting the deposition occurring in the middle of the day in a yellow box, and the bottom panel shows a size distribution of particles from the week surrounding the event outlining data from March 2nd in black box.
Data available from the Division of Air Quality to confirm the data from the instrumentation on WBB was limited because they do not have all their data from 2024 uploaded so far. The data that was available showed that 24 hour averages for PM10 and PM2.5 concentrations were high on the days of the possible event. Table 1 summarizes the DAQ values for February 29 through March 2nd compared to the monthly mean for 3 different sites in the Salt Lake Valley and 1 in Eastern Utah that have both PM10 and PM2.5 monitors. The federal standards for particulate matter over a 24-hour period are 150µg/m3 for PM10 and 35µg/m3 for PM2.5. On March 2nd the 24 hour average for PM10 was unfortunately not available at any of the sites in the valley, but PM2.5 was moderate at all sites. I think that the precipitation starting at noon and effectively washing out all particles from the air skewed the 24 hour average for PM2.5 to be much lower than it would have been in just the morning. Hourly data at these sites would have been much more useful for this analysis but were not available on the DAQ website. Additionally, if the PM10 data were available it would have shown high values and it is possible that the high concentrations were the cause of the damaged filters. As seen in figure 1, PM10 concentrations were also high on March 1st and this can be seen with the high concentration of PM10 (almost classifying as unhealthy for sensitive groups) at the Bountiful site on March 2nd in table 1. When compared to the concentration of PM10 outside of the valley it is much higher, and this may suggest that PM10 is not making it out of the valley due to deposition or wind patterns.
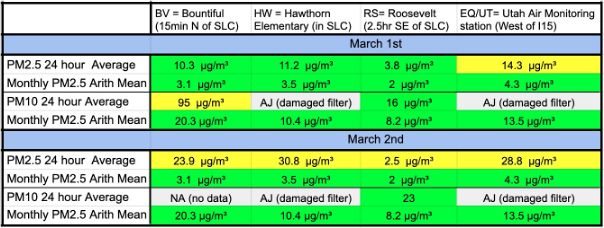 Table 1: PM2.5 and PM10 values at 4 different sites across Utah with corresponding AQI colors associated with these values.Figure 2 shows the progression of the event from Mesowest cameras located on the roof of the William Browning Building (WBB) at the University of Utah. These images help the viewer visualize the extent of this event and verify the weather data lines up with time stamps at the same location as the data collected for figure 1. As seen in the images the visibility is already low in the valley on March 1st reaching its worst around noon but then continues to get worse the morning of March 2nd until its peak around 10:30 AM. Then you can see the stormfront approaching the camera around 1pm March 2nd until the camera’s view is blocked by a snowflake and doesn’t clear up again until March 3rd where you can see blue skies and snow on the ground.
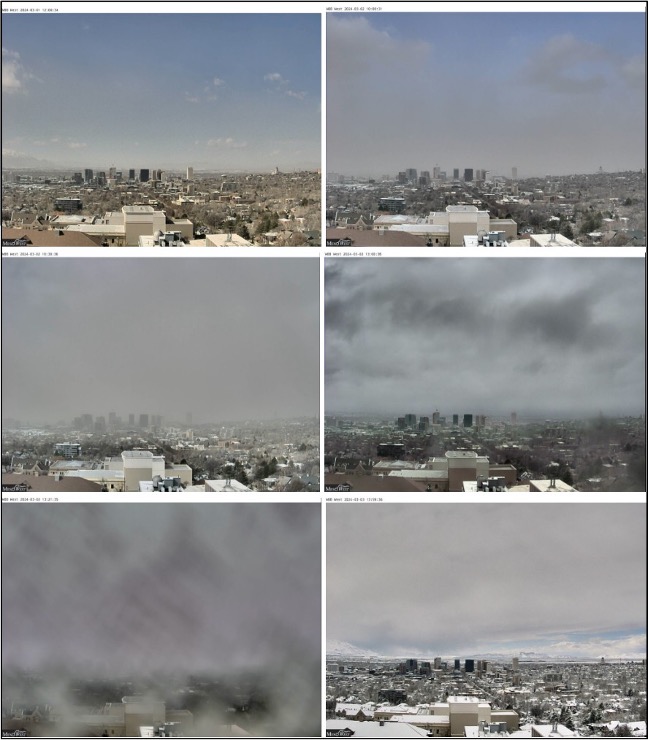
Figure 2: Six iImages from the WBB Mesowest Camera facing west from March 1st- March 3rd with MST timestamp in top left corner of each image.
Figure 3 shows the synoptic scale diagnosis of weather variables across the western US match the expected for the given weather patterns and observations using the GFS model. A low pressure system moving in from the pacific northwest is creating a cold front whose pre-frontal winds were hitting northern Utah for the days following the event. Wind barbs in the model show sustained winds of roughly 45 knots. These high winds are able to pick up and carry available dust from areas in south western Utah which would raise PM concentrations and lower visibility as seen in the data.
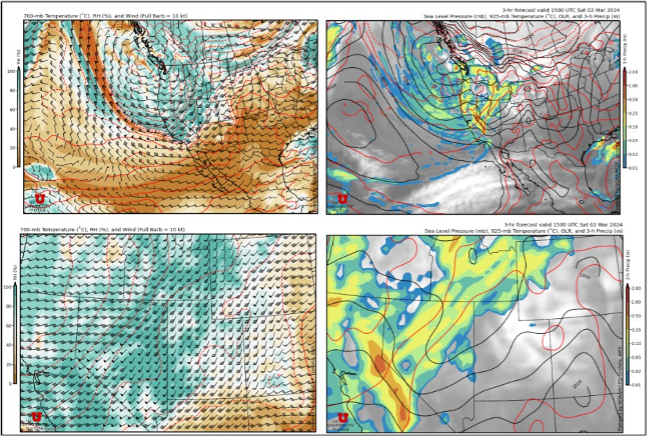
Figure 3: GFS-0P25deg Synoptic diagnosis of 700-mb RH, wind, and temperatures (left) and Sea-level pressure, 925-mb temperature, OLR, and 3-h accumulated precipitation (right) at both the national (top) and local (bottom) scales.
To determine where the dust carried into the valley could have come from, a 24-Hour NOAA HYSPLIT backward trajectory was created from WBB starting on March 2nd around 15:00 UTC (9:00 MST). This ensemble trajectory shown in figure 4 uses the NOAA HYSPLIT model to “simulate the dispersion and trajectory of substances transported and dispersed through our atmosphere, over local to global scales” (NOAA 2024). When compared with the maps from figure three it is clear that the air mass pathway seems to follow the thermal ridge preceding the cold front coming in from the west. This would also come with the high winds that we can see in the wind barbs in figure 3. By organizing all of this information into one document it is clear that a combination of weather patterns and the land type that air masses traveled over caused dust transport and given that monitors to the east of the valley do not show high PM10 values there is a chance this dust never made it out of the valley. As air masses try to move past mountains they are forced to lift which causes precipitation and deposition of dust into the mountains. This blown dust rests on the snow and can lower the albedo below what it would be for pure white snow which allows for more heat to be absorbed and faster melting.
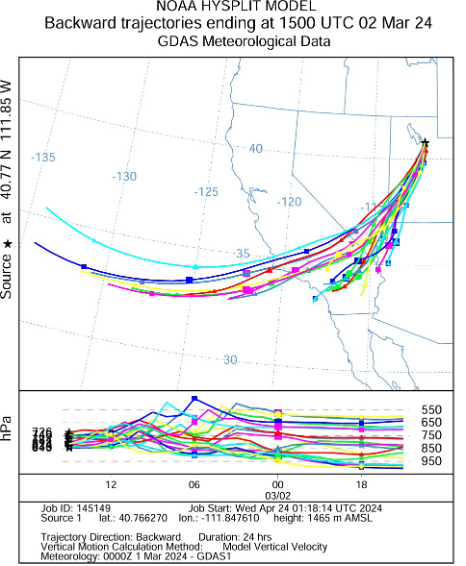
Figure 4: A 24-Hour trajectory starting at WBB at 15:00 UTC March 2nd around 15:00 UTC where the different color lines represent different possible trajectories for an air mass originating from the source at that time.
These events matter for everyone in the greater Salt Lake Area and the surrounding communities that rely on water from the Wasatch range, but the people most affected will be disenfranchised populations. These communities, who are more likely to work outside, cannot afford to pay for better HVAc systems in their homes, and are already more predisposed towards respiratory issues will be hit hardest as extreme events worsen. As drought worsens and the aridity of the west creates more exposed playas extreme weather events could transport more dust to the Salt Lake Area and perpetuate these injustices (Lang et al 2022).
Conclusion
Air quality continues to be an issue in the Salt Lake Valley and as the Great Salt Lake dries up and a megadrought continues throughout the western US it is important to start tracking events with high PM levels in order to see the effects they are having on human health, economy, and environment. Even one dust event can have large effects for snow radiative transfer and as they become more common the effects will be compounding. For an event such as the one studied in this paper dust can travel hundreds of miles before being deposited in our valley and onto our mountains. In a state where the snowsports industry is estimated to have a value of $1.2 billion and 20,000 jobs, this could have detrimental effects both on economy, water security, and human health (Steed et al 2024). Future research would need to be done in order to determine what percent of the dust in this event came from what arid region in the HYSPLIT path and by how many days it would increase snow melt.
Additionally, it would be beneficial to have more detailed data from surrounding sites regarding hourly PM data. With more detailed data it would be possible to better understand the extent of this event in order to calculate the risk it posed for respiratory and pulmonary systems on everyone in the valley, especially sensitive groups. These variables are important to research because, as with many environmental events, health risks are not distributed equally and lower income communities and at risk people are disproportionately affected.
References
Attah, Reuben, et al. “Assessing the Oxidative Potential of Dust from Great Salt Lake.” SSRN, 4 Dec. 2023, 31 pages. SSRN, https://papers.ssrn.com/sol3/papers.cfm?abstract_id=4652877.
Carling, Gregory T., et al. “Using Strontium Isotopes to Trace Dust from a Drying Great Salt Lake to Adjacent Urban Areas and Mountain Snowpack.” Environmental Research Letters, vol. 15, no. 11, 2020, article 114035. IOP Publishing Ltd.,doi:10.1088/1748-9326/abbfc4.
Lang, Otto I., Derek Mallia, McKenzie Skiles, and University of Utah. “The Shrinking Great Salt Lake Contributes to Record High Dust-on-Snow Deposition in the Wasatch Mountains During the 2022 Snowmelt Season.” Environmental Research Letters, vol. 18, no. 6, June 2023, DOI: 10.1088/1748-9326/acd409. License CC BY 4.0.
NOAA ARL READY. “Trajectory Model – HYSPLIT.” NOAA Air Resources Laboratory, https://www.ready.noaa.gov/hypub-bin/traj1.pl. Accessed 23 April 2024.
Skiles, S. McKenzie, et al. “Implications of a shrinking Great Salt Lake for dust on snow deposition in the Wasatch Mountains, UT, as informed by a source to sink case study from the 13–14 April 2017 dust event.” Environmental Research Letters, vol. 13, no. 12, 2018, article 124031. DOI: 10.1088/1748-9326/aaefd8.
Steed, Brian, JD, PhD, Great Salt Lake Commissioner, submitted by. “Great Salt Lake Strategic Plan.” Great Salt Lake Advisory Council, 15 Jan. 2024,
chrome-extension://efaidnbmnnnibpcajpcglclefindmkaj/https://greatsaltlake.utah.gov/w p-content/uploads/Great-Salt-Lake-Strategic-Plan-1.pdf. Accessed 23 April 2024.
University of Utah. “Weather Webcam Archive – West Bear River (WBBW).” MesoWest, University of Utah, https://meso1.chpc.utah.edu/station_cameras/archive/wbbw_cam/. Accessed 23 April 2024.
Utah Department of Environmental Quality. Air Quality Division. [https://air.utah.gov/].Accessed 23 April 2024.
Whiteman, C. David, et al. “Relationship between Particulate Air Pollution and Meteorological Variables in Utah’s Salt Lake Valley.” Atmospheric Environment, vol. 94, 2014, pp.742-753. ISSN 1352-2310, https://doi.org/10.1016/j.atmosenv.2014.06.012.
