Spencer Fox Eccles School of Medicine
87 Identifying Possible Biomarkers in EEG Recording for Patients Receiving High-Dose Propofol Sedation for Treatment-Resistant Depression
Seth Lunt
Faculty Mentor: Brian Mickey (Psychiatry, University of Utah)
Abstract
Preliminary studies for high dose propofol showed positive clinical response in treating patients with treatment-resistant depression. However, it is not completely understood why some patients respond to propofol, and why some do not. In this study, electroencephalograms from 21 patients receiving high dose propofol were analyzed to identify possible electrical biomarkers, which will serve as additional data points to understand the brain’s response to propofol. These electrical biomarkers were extracted as patients experienced Burst-Suppression, which occurs during peak effect-site concentration of high-dose propofol. During Burst-Suppression, three types of bursts were identified: Canonical Broadband Bursts, Spindle Bursts, and Low-Frequency Bursts. These bursts were independent from one another in the time and frequency domain. The Low-Frequency Bursts are a category of burst not previously studied or mentioned in literature. These electrical biomarkers are a means to facilitate further understanding of burst-suppression, propofol as a treatment for MDD, and optimizing treatments for those suffering with MDD.
Introduction
In 2020 an estimated 21 million adults, or approximately 8.4% of the American adult population, had experienced at least one episode of MDD [1]. Of the population of adults who have MDD, about one-third do not respond to conventional first-line treatments and are therefore classified as having treatment-resistant depression (TRD) [2]. In addition, these treatments take weeks or even months to have a full therapeutic effect. This delay in therapeutic effect is correlated with increased morbidities and risk of suicidal behavior [3]. Many people cannot find effective or efficient treatment for TRD. As such, there is an immediate need to develop novel, fast-acting treatments. One possible novel treatment is propofol, which has shown positive clinical outcomes in patient trials. The overall purpose of this research is to investigate why propofol, a novel and fast-acting treatment undergoing patient trials, has been shown to be effective in treating TRD.
Propofol is of interest because of certain shared characteristics with other treatments that are fast-acting and effective. Novel, fast-acting treatments have different targets than the typical slow-acting treatments. These slow acting treatments are often ineffective, such as fluoxetine and Lexapro. Fast-acting treatments such as ketamine, electroconvulsive therapy (ECT), and anesthetics such as isoflurane have been shown to be therapeutic in providing remission of depressive symptoms. Propofol is a novel treatment of interest because it shares several mechanisms of action with other effective treatments, such as ECT or ketamine, and has comparatively few side effects. In preliminary studies, about 60% of adults receiving high dose propofol experienced a positive clinical response [4], [5].
In preliminary high dose propofol studies, the majority (60%) of patients showed a positive clinical response, however, approximately 40% did not [4]. It is possible that differences in the brain’s acute response to propofol can explain differences between responders and non-responders. Electrical activity in the brain during treatment is recorded by electroencephalography (EEG), and bursts in electrical activity during deep propofol sedation act as electrical biomarkers. The current work seeks to identify and quantify these bursts to use as electrical biomarkers. These biomarkers can then be correlated with patient outcomes and can help differentiate between responders and non-responders. They will also help provide insight into the mechanisms of action explaining why propofol is an effective treatment for TRD.
The therapeutic period of propofol treatment is believed to occur in a state observed by EEG called Burst-Suppression. This study is designed to test the hypothesis that the bursts in electric activity that occur during BSP act as biomarkers. This analysis is done after treatment sessions. The different categories of bursts that appear can be correlated and used to predict patient outcomes. The differences in these electrical biomarkers in patients who respond and don’t respond might also help in understanding how propofol is effective in treating TRD. With this information, doctors will be given better tools to help patients overcome MDD quickly, thus decreasing the possibility of comorbidities and death by suicide.
Background
Novel treatments for TRD are focusing on several mechanisms. Research has shown the effectiveness of agents targeting N-methyl-D-aspartate (NMDA) receptors [6] and gamma-aminobutyric acid (GABA) receptors in treating depression [7]. It has been observed that ECT patients experience a period of electrical suppression called Burst Suppression (BSP) which is characterized on EEG recordings by extended periods of isoelectric activity interrupted by short, individual bursts in electrical activity [8] That observation led researchers to hypothesize that ECT induced seizures were not necessary for antidepressant effects, and that a period of pharmacologically induced BSP might suffice [5], [9]. Researchers have also suggested that ECT is clinically effective because of its ability to reduce NMDA receptor activity, modulate glutamatergic synapses [10] and increase cortical GABA concentrations [11]. As well, preliminary evidence suggests that anesthesia induced BSP could be effective in treating patients with TRD [5].
Propofol shares the pharmacodynamic effects of reducing NMDA receptor activity, modulating glutamatergic synapses, and increasing cortical GABA concentrations [4]. It is similar to the anesthetic isoflurane, which has also been shown to have anti-depressive effects, and which induces BSP similar to the postictal suppression that occurs after ECT [5] Propofol is also regarded as very safe as it has few side effects and has rapid onset and offset. With these characteristics, propofol may be an ideal novel treatment for TRD [4].
Methods
Participant Parameters
This study was approved by IRB as part of patient trials for propofol as a treatment for treatment resistant depression. Patients were qualified through several evaluations such as comprehensive psychiatric evaluations, full medical histories, physical examinations, blood tests, and 12-lead echocardiograms. The inclusion criteria included being aged 18-55 inclusive, primary diagnosis of DSM-5 MDD or bipolar disorder, being in a current moderate-to-severe depressive episode, minimum of 2 failed antidepressant medication trials, and failing both a Quick Inventory of Depressive Symptomology and a Hamilton Depression Rating.
Treatments
The EEG recordings acquired for this study were taken from 21 patients receiving high-dose propofol in a closed-label blind trial. The patients received either high-dose propofol or low-dose propofol treatment series chosen at random. Patients received up to 10 treatments, with treatments being administered 3 times a week until treatment goal was reached.
Anesthesiologists administered the propofol and monitored the patients throughout the treatments. Vitals were monitored through pulse oximetry, EKG, blood pressure by non-invasive cuff, respiratory rate, and end-tidal carbon dioxide. A BIS Monitor (BIS VISTA Monitoring System, Aspect Medical Systems) with a 4-electrode sensor (BIS Quatro, Covidien) was applied to measure left frontal EEG throughout the procedure. After preoxygenation, an induction dose of propofol was administered i.v. (2,6-diisopropylphenol; Diprivan injectable emulsion; Fresenius Kabi) and desired dosage was maintained via constant IV infusion and small boluses as needed. Trendelenburg positioning, IV fluids, and small boluses of pressors were used as needed for hypotension. A laryngeal mask airway and mechanical ventilation were used for respiration support. Patients were monitored by a nurse in a post-anesthesia care unit until discharge criteria were met.
Dosage depended on the patient and was adjusted based on the reported burst-suppression ratio (BSR) as reported by the BIS Monitor in the treatment. BSR is a measure of how much time a patient experienced isoelectric EEG activity compared with time they experienced some sort of electrical activity over the course of the previous minute of treatment. Dosage of the propofol infusion and small boluses of propofol were adjusted to keep the patient between 85% and 100% BSR for 15 minutes. For more information about specifics of inclusion and exclusion criteria, treatment procedures, and dosage refer to Mickey et al. and corresponding supplemental information [4].
EEG Analysis
EEG analysis was performed after treatments in MATLAB (2019a, MathWorks, Natick, MA, USA). Raw EEG signal was uploaded, and artifacts in the recording due to external stimuli, movement, etc. were extracted manually. High pass filters were applied to the signal. A sliding window was applied to the signal and signal energy was calculated using Teager’s Algorithm to distinguish when a patient was experiencing bursts during burst suppression [12].
Although BSR was calculated by the BIS Monitor, there was doubt as to whether the calculation was completely accurate. As such, BSR was calculated by a custom algorithm which took a sliding window over the EEG and compared the amount of time the patient was experiencing bursts versus suppression over one minute. The EEG signal of interest occurred when BSR > 50%. The BSR was cross checked with the calculated effect site concentration (CE) of propofol to make sure values were logical. The timing of when bursts occurred was recorded to facilitate extracting desired data parameters. Such parameters included burst length, time between bursts, peak to peak maximum and minimum amplitude, CE during burst, median frequency, spectral edge frequency, and frequency band power. Band power was taken overall, as well as at different frequency ranges: delta (1-4Hz), theta (4-7Hz), alpha (7-12Hz), beta (12-30Hz), and low gamma (30-45Hz). Frequency content and power of bursts was visualized on a scalogram calculated with a continuous wavelet transform. Bursts were also analyzed qualitatively by plotting them side by side and with their respective scalograms to identify common waveforms and patterns. Different extracted parameters were plotted compared to one another to identify clusters that could indicate different categories of bursts to further support the qualitative categories created.
Validation and Statistical Analysis
Statistical analysis was performed in R (4.2.2, R Core Team, Vienna, Austria). There were 21 patients from which 114 high-dose treatments were analyzed to extract bursts. There was a total of 11,289 bursts that were extracted across all treatments. The average and standard deviation of burst length, peak-to-peak amplitude, and frequency ranges were computed for each burst category. These calculations were performed for each treatment, and then were averaged across treatments and subjects so that subjects would have equal weight on the overall values. Validation of burst categorization was performed by presenting 100 randomly selected bursts from each category to an expert human rater to compare their categorization to the algorithm [13].
Results
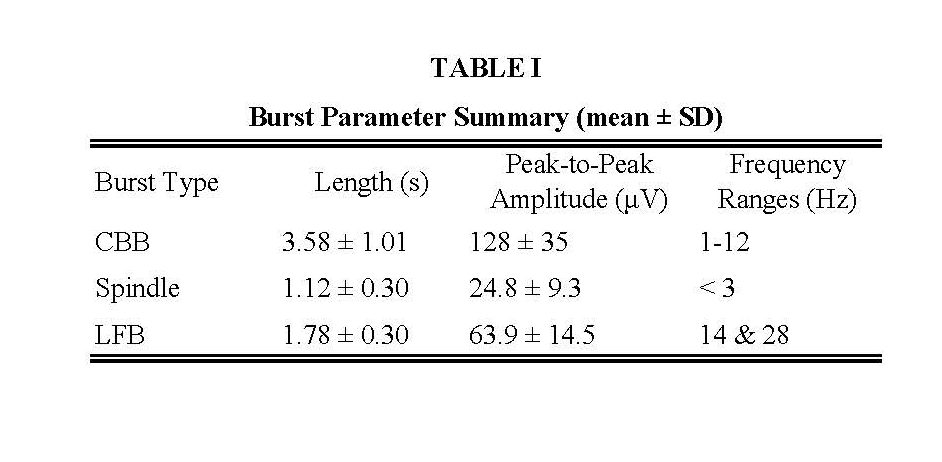
Three bursts were observed across treatments. The types of bursts were canonical broadband bursts (CBB), spindles, and a novel low frequency burst (LFB). CBBs are characterized as being several seconds in duration, with a low-frequency positive deflection underlaid with 10 Hz activity. Spindles are characterized by low-amplitude activity with narrowband oscillations centered around 13-17 Hz. LFBs were biphasic in nature, with a shorter duration than CBBs, and with mostly low-frequency content and hardly any 10 Hz power. (Figure 1) Summary table of mean values of burst length, peak-to-peak amplitude, and frequency power ranges provided in Table 1. The expert human rater agreed with 283 of the 300 burst classifications, specifically 94% of CBBs, 96% of LFBs, and 93% of spindles. The remaining 17 bursts were labeled ambiguous [13].
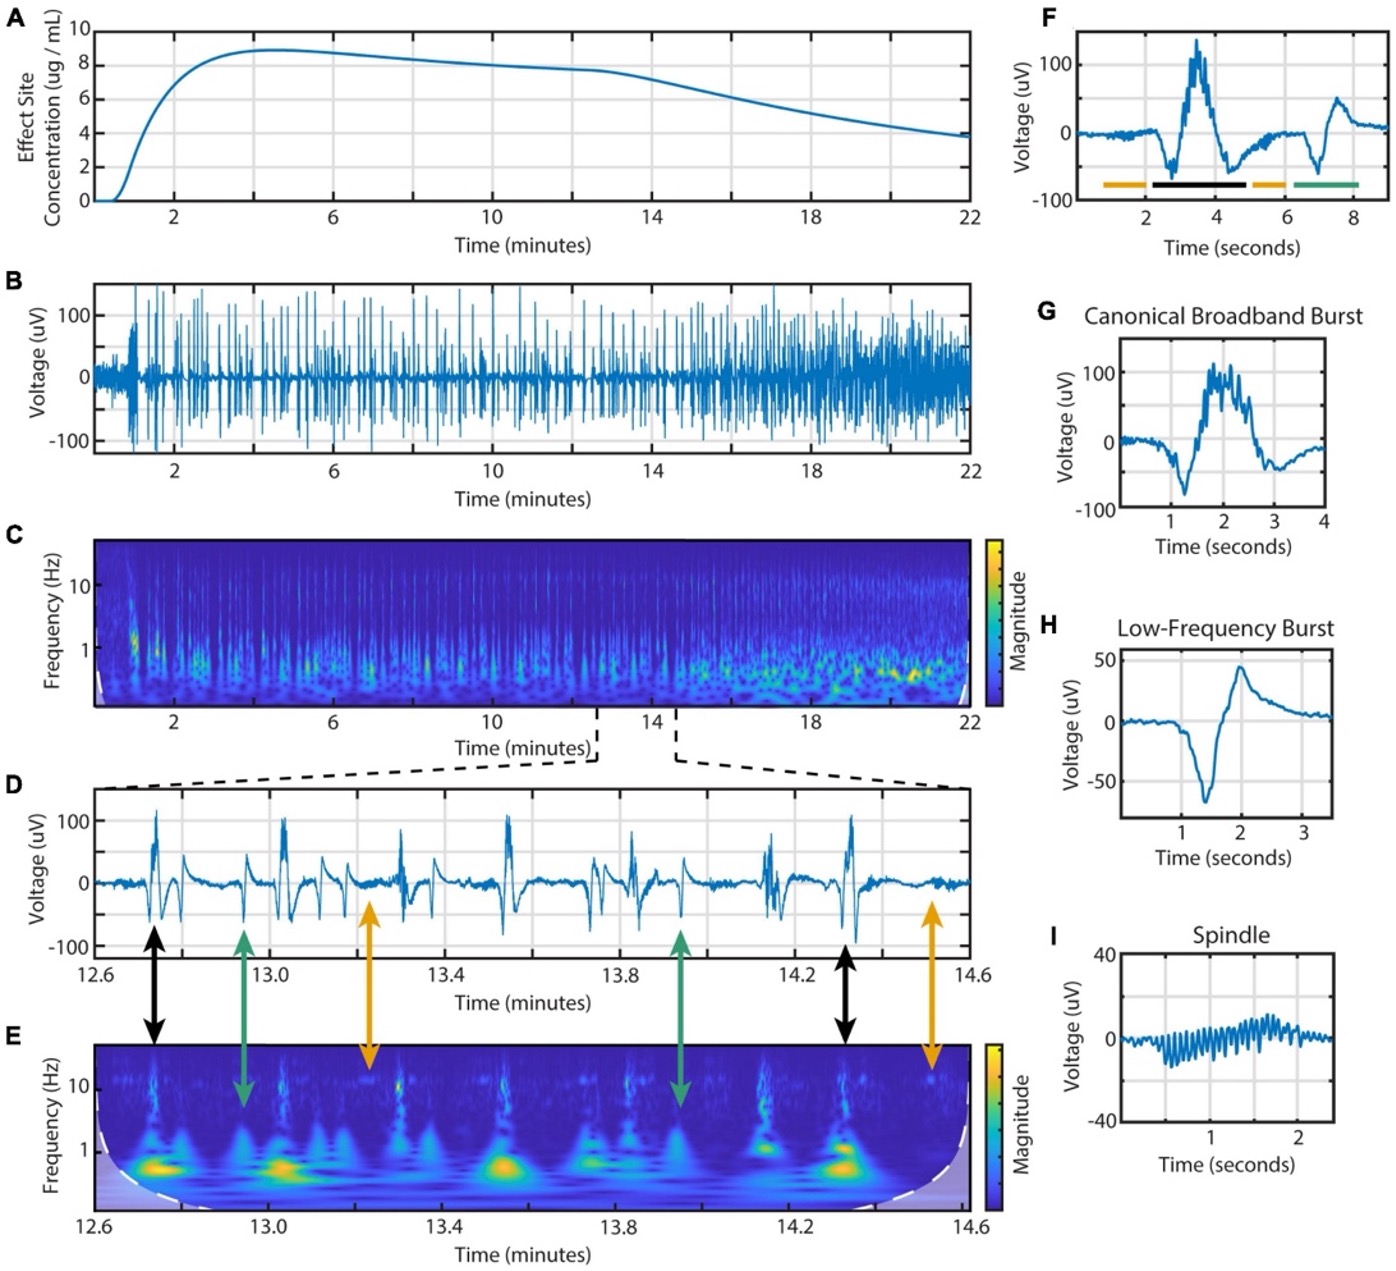
Figure 1. Example of section EEG signal with different bursts extracted and compared with frequency spectrogram and effect site concentration of propofol. (A) Calculated effect site concentration. (B) Entire EEG signal of example treatment. (C) Spectrogram of entire EEG signal. (D) Segment of EEG during BSP to display different burst types present. (E) Spectrogram of segment with arrows connecting voltage recording of bursts to the corresponding spectrogram segment. Black arrows connect CBBs, green arrows connect LFBs, and yellow arrows connect spindles. (F) Smaller segment of EEG showing example of different types of bursts next to each other. Bar colors indicating type of burst are consistent with previously described arrows. (G) EEG of a CBB. (H) EEG of an LFB. (I) EEG of a spindle [13].
Discussion
The aim of this research was to identify possible electrical biomarkers in EEG from patients receiving high-dose propofol for treatment-resistant depression (TRD). Explicitly defined data parameters and qualitative categorization from an expert rater have confirmed that there are at least three distinct types of bursts that occur during Burst-Suppression (BSP). An electrical biomarker in EEGs of high-dose propofol-treated patients has been found due to algorithmically identified and quantified BSP bursts. Bursts can be used not only in correlations with patient outcomes, but also comparing burst prevalence patient demographics. Also, the bursts within the same category can experience change from patient-to-patient, treatment-to-treatment, and from burst-to-burst within a treatment based on several variables such as effect-site concentration or treatment length [13]. With these comparisons, further hypothesis will be tested that explain underlying differences in how certain populations react to propofol. These biomarkers will also be correlated to patient outcome to help explain differences between responders and non-responders as well as possibly predict patient outcome. The end goal to identifying these biomarkers is being able to optimize treatments for individuals suffering with TRD and create better treatments in the future.
The CBB and spindles (Fig 1- G&I) in the context of propofol-induced burst suppression have already been discussed previously in literature. In Huotari’s 2004 paper on EEG patterns during propofol-induced burst suppression, bursts and spindles were identified with similar quantifiers. Their definition of bursts was consistent with the present work’s definition of CBBs as was their definition of spindles. However, there was no mention of the novel burst type LFB (Fig 1-H) [14]. Another work discusses burst suppression and mentions bursts which have been classified in the present work as CBBs and spindles, but also doesn’t mention LFBs. Of note, in some papers burst suppression is framed as undesirable because of it occurs after an epileptic seizure and is a state near what some would call “brain death.” However, many countries have since abandoned that classification, and propofol induced burst-suppression has been regarded as safe [15].
Categorization by expert human rater had some differences from the algorithmic categorization. However, these differences were small and the few bursts that didn’t match the algorithms output were too ambiguous to classify by eye.
This research has provided a robust classification for bursts during BSP that will act as biomarkers for patients receiving high dose propofol for TRD. These biomarkers are being used to understand differences in reaction to propofol across patients. These biomarkers will further be used to compare patient outcome to EEG recordings and facilitate greater understanding of propofol as a treatment for TRD. Furthermore, these biomarkers will facilitate the optimization of TRD treatments and the creation of better treatments in the future.
Acknowledgements
Keith Jones PhD, Carter Lybbert MS, Matthew J. Euler PhD, Jason Huang MS, Sindhu V. Richards MD, Jacob E. Jessop DO, Adam Larson MD, David H. Odell MD, Kai Kuck PhD ME, Scott C. Tadler MD.
References
[1] SAMHSA, “Major Depression,” Bethesda, 2020.
[2] A. J. Rush et al., “Acute and longer-term outcomes in depressed outpatients requiring one or several treatment steps: a STAR*D report,” American Journal of Psychiatry, vol. 163, no. 11, pp. 1905–1917, 2006.
[3] R. Machado-Vieira et al., “The timing of antidepressant effects: A comparison of diverse pharmacological and somatic treatments,” Pharmaceuticals, vol. 3, no. 1. MDPI AG, pp. 19–41, 2010. doi: 10.3390/ph3010019.
[4] B. J. Mickey et al., “Propofol for treatment-resistant depression: A pilot study,” International Journal of Neuropsychopharmacology, vol. 21, no. 12, pp. 1079–1089, Dec. 2018, doi: 10.1093/ijnp/pyy085.
[5] S. C. Tadler and B. J. Mickey, “Emerging evidence for antidepressant actions of anesthetic agents,” Current Opinion in Anaesthesiology, vol. 31, no. 4. Lippincott Williams and Wilkins, pp. 439–445, Aug. 01, 2018. doi: 10.1097/ACO.0000000000000617.
[6] C. Zarate, R. S. Duman, L. Guosong, S. Sartori, J. Quiroz, and H. Murck, “Zarate-2013-Targeting NMDA,” Ann N Y Acad Sci, vol. 1292, no. 1, pp. 21–31, 2013.
[7] S. Kanes et al., “Brexanolone (SAGE-547 injection) in post-partum depression: a randomised controlled trial,” The Lancet, vol. 390, no. 10093, pp. 480–489, Jul. 2017, doi: 10.1016/S0140-6736(17)31264-3.
[8] A. J. Derbyshire, B. Rempel, A. Forbes, and E. F. Lambert, “The Effects of Anesthetics on Action Potentials in the Cerebral Cortex of the Cat,” American Journal of Physiology, vol. 116, no. 3, pp. 557–596, Jul. 1936.
[9] G. Langer, J. Neumark, G. Koinig, M. Graf, and G. Schönbeck, “Rapid psychotherapeutic effects of anesthesia with isoflurane (ES narcotherapy) in treatment-refractory depressed patients,” Neuropsychobiology, vol. 14, no. 3, pp. 118–120, 1985.
[10] F. Fumagalli et al., “Repeated electroconvulsive shock (ECS) alters the phosphorylation of glutamate receptor subunits in the rat hippocampus,” International Journal of Neuropsychopharmacology, vol. 13, no. 9, pp. 1255–1260, Oct. 2010, doi: 10.1017/S1461145710000544.
[11] G. Sanacora et al., “Increased Cortical GABA Concentrations in Depressed Patients Receiving ECT,” 2003. [Online]. Available: http://ajp.psychiatryonline.org
[12] lames F. Kaiser, “On a simple algorithm to calculate the ‘energy’ of a signal.” International Conference on Acoustics, Speech, and Signal Processing, vol. 1, pp. 381-384, Apr. 1990 doi: 10.1109/ICASSP.1990.115702.
[13] K. G. Jones et al., “Diversity of Electroencephalographic Patterns During Propofol-Induced Burst Suppression,” Front Syst Neurosci, 2023.
[14] A. M. Huotari et al., “Evoked EEG patterns during burst suppression with propofol,” Br J Anaesth, vol. 92, no. 1, pp. 18–24, 2004, doi: 10.1093/bja/aeh022.
[15] F. Amzica, “What does burst suppression really mean?,” Epilepsy and Behavior, vol. 49, pp. 234–237, Aug. 2015, doi: 10.1016/j.yebeh.2015.06.012.
