College of Science
120 Assessing Plant Adaptability to Wildfire Impact and Drought
Julia Clista Galecki
Faculty Mentor: William Anderegg (School for Biological Sciences)
Abstract
Forests’ responses to drought are influenced by a multitude of factors, including elevation, prior exposure to fire, prior exposure to drought, clade, and species. (Anderegg et al. in 2020) Severe drought or the heat generated by a fire event can lead to hydraulic failure. (McDowell et al. in 2008) Hydraulic failure refers to a situation where a plant loses its ability to sufficiently transport water from the roots to the leaves. This might indicate that trees burned in wildfires will not be better adapted to summer drought. However, it’s important to consider that if a tree is given ample time to recover from a stressful event like a wildfire, it may indeed become better adapted to handle future drought conditions. (Anderegg et al, 2020). This research investigates the impact of wildfire exposure on a plant’s capacity to acclimate to summer drought. This is important due to the escalating occurrence of wildfires alongside the concurrent rise in temperatures and drought events (Diffenbaugh et al., 2015). The primary objective is to determine whether plants that have survived wildfires are more or less drought resilient. To test this hypothesis, a native tree species, Juniper, in central Utah was selected to analyze the drought-related physiological characteristics. Comparing the drought-related physiological characteristics in a subset of 15 Juniper trees were selected in both a burned and unburned area in central Utah. This study suggests the Juniper species are more drought resistant after surviving and recovering from a fire event. The burned and unburned Juniper trees did not have a statistically significant difference between the pre and post drought measurements, health, and stress in each subset. The general health of the Juniper trees are generally not substantially impacted by fire. This research has the potential to offer valuable insights into the adaptability of various tree species to survive droughts and wildfires, aiding in our ability to predict future landscape ecology.
Introduction
Forests play a crucial role in maintaining biodiversity and regulating ecosystems worldwide. They contribute to the hydrological and nutrient cycles (Choat et al., 2018). However, extreme climate events such as rising temperatures, droughts, and wildfires are posing significant threats to forests worldwide, potentially compromising forest ecosystems and the terrestrial carbon sink. (Anderegg et al., 2020) There are many factors that contribute to forest mortality. Some of the leading contributors are carbon starvation, hydraulic failure, and biotic agents. Carbon starvation occurs when plants close stomata to minimize water loss during drought conditions, which drains the carbon reserves to stay alive during this period of photosynthetic inactivity (McDowell & Sevanto, 2010). Hydraulic failure occurs when drought induces extremely high xylem tensions, resulting in not being able to transport enough water to sustain photosynthesis (Sevanto et al., 2013). Biotic agents, such as insects and pathogens, are not the focus of this paper but are often attracted by plants weakened by drought stress (McDowell et al., 2008). The increased severity and frequency of droughts due to climate change has had a stressing impact, specifically on drylands (Kannenberg et al., 2021) Drylands ecosystems are likely to be particularly impacted by climate change and droughts (Bestelmeyer et al., 2015; Hoover et al.2020). Since much of Central Utah is classified as a dryland, it is important to understand potential factors causing ecological impacts such as forest mortality.
Juniper trees (Juniperus spp) are dominant species within dryland central Utah. Junipers provide shade, shelter, and food for the wildlife in the area. Therefore, understanding the impacts that drought and wildfires will have on Junipers will give an understanding of the ecological impacts of climate change on this region. In addition to the ecological impacts, there are social impacts of climate change that cannot be ignored. Landowners’ livelihoods depend on the understanding and prevention of devastating impacts on their land. Observing the die-off of the Juniper trees may be a precursor to more significant issues, such as forest mortality affecting biodiversity and the ecosystem. Additionally, landowners may experience a loss of value in their land and may no longer be able to generate revenue. It is not well understood why some trees survive while others do not. It is already known that Junipers are a very drought resilient species (Kannenberg et al., 2021), but recent droughts might have overcome that resilience.
Multiple droughts have become a growing concern on a global scale. More frequent and stronger intensity climate extremes such as droughts are expected due to global climate change (Smith, 2011). Droughts following a severe drought can have major influences on an ecosystem’s vulnerability, especially if the next drought occurs before the ecosystem has had time to recover. Since drought frequency is increasing it will be more probable that species will not have enough time to recover before the following drought. Therefore the more time a species requires to recover after a drought the more at risk the species is of hydraulic failure (Anderegg et al., 2015).
Extreme droughts can lead to legacy effects (Szejner et al., 2019). Legacy effects encompass the disparity between the predicted and observed growth. These effects manifest in various aspects such as stomatal conductance, wood anatomy and density, xylem vulnerability to drought, drought- induced tree mortality and above ground primary productivity. Legacy effects have been found to have positive and negative correlations to the years after the drought (Anderegg et al., 2015). This indicates there is a possibility that if the tree has had a sufficient amount of time to recover from a stressing event it could be better adapted for future droughts (Anderegg et al., 2020).
Tree-level drought sensitivity differs by clade, biome or region (Anderegg et al., 2020). It is important to understand as many different clade/biomes as possible such as Central Utah’s dryland Junipers. The Juniper’s lesser reliance on summer precipitation (West et al., 2007) results in amore drought resistant species. Another trait making Junipers more drought resilient is their xylem, which are more resistant to hydraulic damage such as having deeper roots (Schwinning etal., 2020) and a more highly sectorial hydraulic architecture (Schenk et al., 2008). Since the deep roots of Junipers are one of the physiological traits that make the Juniper so resistant to drought, damage to the roots would limit photosynthesis because of a reduction in nutrient and water uptake. (Coomes and Grubb 2000; Swezy and Agee 1991; Hungerford et al.1991).
Droughts and wildfires have been shown to be linked therefore it is important to understand the impacts of wildfires on forests. There are many contributions to the impact of wildfires on trees. Fire-induced damages can lead to immediate tree mortality or a prolonged state of decline (Thompson et al., 2016). There are the obvious impacts: actually burning of the tree, smoke contributions, and overheating. These can result in reduced growth and thus reduced leaf area. The scorching of the foliage of the tree can result in a higher sapwood to leaf area ratio (Thompson et al., 2016). Fire can reduce sapwood area to be formed in the future by damaging the cambium and phloem (Ryan et al. 1988; Ducrey et al. 1996; Dickson and Johnson 2004). This can result in the tree limit of ability to transport water within its xylem. The cambium has also been shown to be one of the more negatively susceptible features to heat (Salladay & Pittermann, 2023). Sudden increases in vapor pressure deficit which is associated with high temperatures from wildfires can result in xylem cavitation (Kavanagh et al., 2010).
As previously mentioned, hydraulic failure is one of the leading causes of tree mortality. The current study focuses on the causes of hydraulic failure. The elevated temperatures due to climate change increase the intensity of the impact from the drought by amplifying evaporative demand (Diffenbaugh et al., 2015), causing drought and wildfires. Both drought and fire can cause emboli in the xylem that reduce water transport and therefore cause tree mortality. Emboli are air bubbles or blockages that can disrupt the flow of water in xylem vessels, impacting their functionality. As mentioned above, there are rising temperatures and an increase in droughts which has been shown to be linked with an increase of wildfires (Diffenbaugh et al., 2015). Within the Central Utah Sanpete valley there have been dry periods in 2012-2021, periods of more severe droughts 2018- 2019 and 2020-2022 as illustrated in Figure 1. There have also been significant wildfires in the years 2012, 2014, 2016, 2018, 2019 (National Geographic Area Coordination Center website portal).
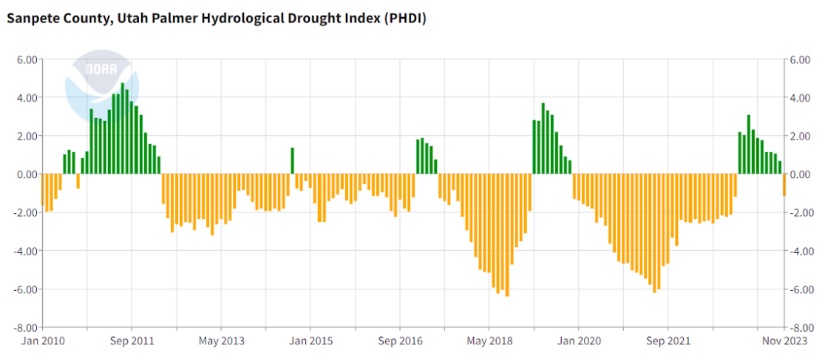
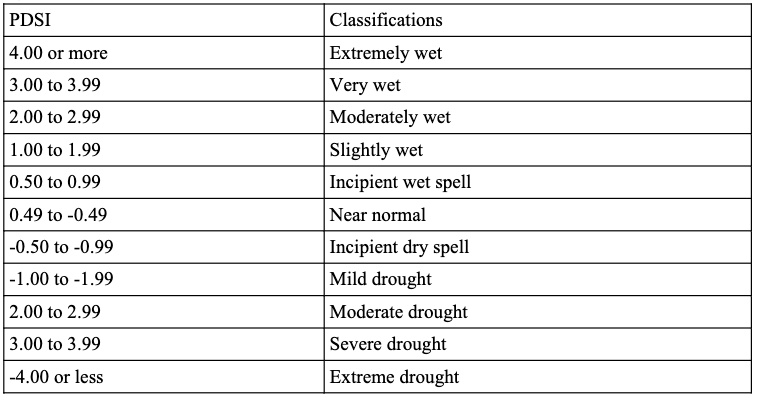
Figure 1: Sanpete County Hydrological Drought Index for January 2010 through November 2023. (County time series: Climate at a glance) The positive green values correspond to wetter conditions and the negative yellow values correlate to drought conditions. The exact y-PDSI value classifications can be found in Table 1.
Table 1. PDSI Classifications for Dry and Wet Periods illustrated in Figure 1 (adapted from Hayes, 2006).
This study assesses whether exposure to wildfire impacts a plant’s ability to acclimate to summer drought. It will be addressed by comparing drought physiological traits of a native tree species, Utah Juniper, in burned versus unburned sites in central Utah. The goal of the project is to determine whether plants that survive wildfires are more or less drought resilient. This research provides insight into whether various tree species are better adapted to survive droughts and wildfires which will help in future ecology predictions of the future landscapes.
Methods
The study area is located in northern Sanpete County, Utah, just north of the geographic center of the State. The 2018 Hilltop Fire burned approximately 1,865 acres at the interface of Utah Steppe/Agricultural habitat where the Northern Mountains, North Central, and South Central climate regions intersect. The established plots are both within and immediately adjacent to the perimeter of the Hilltop Fire (Figure 2). The land ownership in the study region is 100 percent privately held. In order to limit confounding effects, all plots are within an elevation of 200 feet of each other, with a similar slope (~16°) and aspect (~73°); the geographic and topographic similarities between the plots will reduce potential physiological differences due to elevation, aspect, or prior drought effects. Three plots consisting of 5 trees each were established in both the burned and unburned areas for a total of 6 plots and 30 trees.
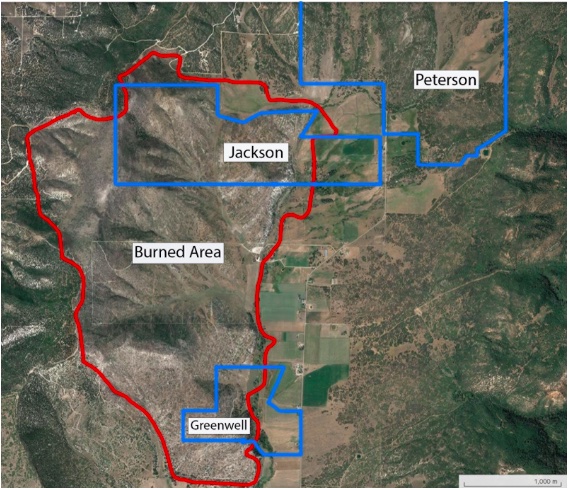
Figure 2. The Burned section is outlined in red. One burned plot was established on the Greenwell land. Then two burned plots were established on Jackson land. All three of the unburned plots were established on Peterson Land.
Both Rocky Mountain Juniper (Juniperus scopulorum) and Utah Juniper (Juniperus osteosperma) species were sampled, due to difficulty in field identification of these two species. These species are both native and dominant tree species in Utah (Ramsey & West). Both species are in both subsets of the burned and unburned plots. Preferably only one species would have been tested; but there are many similarities between the two species (Burns & Honkala, 1990). Both are known to be similarly very drought resistant species, which still allows for drought resistant comparability (Kannenberg et al., 2021).
Tree branches from each similar area (aspect, slope, and elevation) from trees of similar size and age were sampled for this study. The trees chosen in the burned plots all had been visibly burned by the fire. The samples chosen from the tree were 180° from the burned section of the tree. Each tree in the burned area had a different amount of burned percentage, which was noted and considered in analysis. Laboratory analysis to assess the adaptability included: 1) determining the hydraulic conductivity; 2) Leaf area vs sapwood area ratio (LA/SW); 3) ∂13C and nitrogen percentage measurements. Tree branches for the hydraulic conductivity measurements were collected twice, once in May 2022 and a second time in August 2022. For the remaining measurements, samples were only collected once: LA/SW in May 2022, and ∂13C and nitrogen percentage in August 2022, respectively.
Hydraulic conductivity
A branch from each of the 30 trees was cut in the field, then the cut end was immediately wrapped in a wet paper towel to maintain the native hydraulic value and placed in a plastic ziplock bag. The samples were kept out of sunlight as best as possible until they were placed into a cooler with no sunlight access to limit transpiration and get the most accurate native hydraulic value as possible. In the lab, each stem was cut underwater to obtain the 14 cm length stem. The ends of the stems were trimmed to have a flat smooth cut. Using a gravity utilizing setup, water is gently pushed through each stem. The water transported through the stem is weighed on a scale. The rate atwhich the stem transports the water is then determined using a coded computer program (Sperry, 2007). Prior to the initial measurement of hydraulic conductivity, stems are placed under vacuum in water overnight in order to fully fill all water-transporting vessels in the xylem. This will give the max hydraulic conductivity of the stem. The stem is then put into a centrifuge and spun, then the conductivity is measured once again. The centrifuge creates air emboli in the xylem, simulating drought conditions; the greater the spin speed, the more severe the simulated drought (Sperry et al., 1988). This process is then repeated on each stem, increasing the speed of the centrifuge after each measurement until there is no water being transported onto the scale (100 percent loss in conductivity). As the Juniper tree species are known for high drought tolerance, none of the curves reach the point where zero water was being transported due to the limit of the centrifuge spin capabilities. The centrifuge speeds were 0.5, 1, 2, 4, 6, 8, 10 MPa for each curve. This enabled a sufficient number of data points to determine the curve. The resulting data points were then plotted and curves fit to the data using R. This is used to calculate the P50 and P20 of the tree (the negative pressures at which 50 and 20 percent of the stem’s maximum hydraulic conductivity is lost).
Leaf area vs. sapwood area
The leaf area vs. sapwood area ratio was determined by taking a branch from the mature tree, then measuring the sapwood and heartwood with calipers. Using these measurements, the sapwood area was calculated by subtracting out the pith/ heartwood area. By measuring the sapwood plus heartwood diameter with calipers then rotating 90° and measuring again and averaging the diameter. This was repeated to obtain pith/heartwood diameter. Areas were calculated (Area= π(d1/2)2-π(d2/2)2) Where d1 is equal to the average sapwood plus heartwood diameter and d2 is the average pith/heartwood diameter. The leaves were stripped from the branch, dried at 60 ℃ for at least 48 hours, with no sign of water, then weighed. To determine the area a subset of the leaves from each tree were separated out prior to drying, scanned and the area calculated using ImageJ, then dried and weighed. Using this ratio the total leaf area of each branch could be determined by taking the total weight of dried leaves multiplied by the ratio determined with the subset of leaves. TW * AS/WS = TA. Where TW is total leaf weight (it was made sure the subset weight was added to total weight) AS is the area of the subset and WS is the weight of the subset. The final leaf area to sapwood ratio was determined by taking each individual leaf area divided by the associated calculated sapwood area.
Carbon-13 and Nitrogen %
Carbon-13 ( 13C) and the nitrogen percentage (N) analysis is performed by using a single conifer needle that has been dried for at least 48 hours in an oven. Dried leaves were then frozen with liquid nitrogen and ground into a fine powder using a mortar and pestle. The powder is then sent to the SIRFER stable isotope facility, who measure carbon and nitrogen isotope ratios using Elemental Analyzer – Isotope Ratio Mass Spectrometry. Gloves were worn throughout the whole process to ensure no carbon or nitrogen from hands would interfere with the results.
Statistical Analysis
The statistical significance was determined for all data/graphs. An F-test was first utilized to determine unequal vs variances. Then a T-test was performed to determine the t statistic, p value, and the t critical value. For the burned percentage data the r squared, p-value, and coefficient was determined with a linear regression. The alpha value was set to 0.05 which is a common standard. Withthe smaller sample size of 30 total trees with 15 trees in each group, statistical significance is hard to reach even if there is a difference.
Results
The hydraulic vulnerability curves illustrated in Figure 3 demonstrate unburned trees have a P50value of ~7.8 MPa, whereas the burned fraction of trees have a P50 value of ~9.9. PLC (located on the y-axis) is the percent loss in conductivity, indicating the relative amount of hydraulic conductivity the plant has lost due to emboli. The use of a centrifuge to create emboli in the stems was utilized as described in the Methods section. The centrifuge creates air emboli in the xylem, simulating drought conditions; the greater the spin speed, the more severe the simulated drought (Sperry et al., 1988). Therefore the x-axis is essentially the amount of drought the stem is experiencing. Since the burned subset of trees has a higher P50 value it indicates burned trees are less vulnerable to drought. In Figure 4, the burned (red) and unburned (blue) subsets are overlaid, highlighting the difference between the two subsets. Note there is a larger variability in the burned trees. A possible hypothesis for this is the degree in burn percentage.
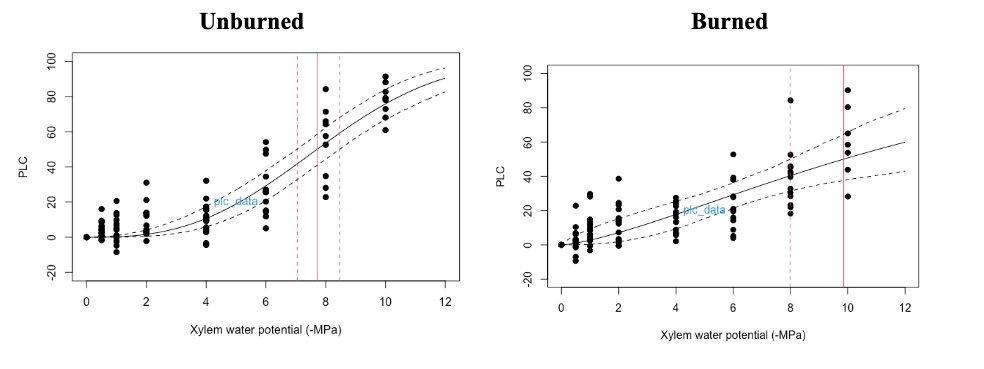
Figure 3. Hydraulic vulnerability curves: unburned (left) burned (right). Each point on the graph corresponds to a single stem of the subset spun at each speed. The solid red line is the P50 value and the dotted red lines indicate the error of the P50. The solid black line is the line of best fit and the dotted black lines are the 95% confidence interval.
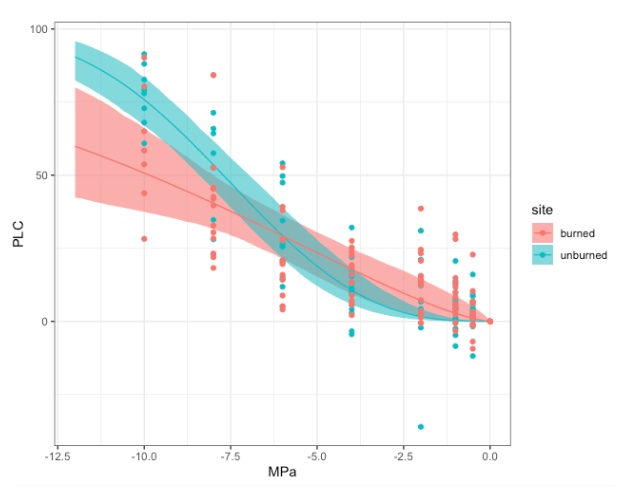
Figure 4. Overlayed unburned (blue) and burned (red) hydraulic vulnerability curves. Each line indicates the line of best fit. The shaded regions are the 95% confidence interval of the curve.
Figure 5 plots the P12 and P20 values vs the burn percentage for each individual burned tree in the study. The P12 and P20 values were utilized because some of the stems did not reach their P50 value. Juniper trees are highly drought resistant and are known for their high P50 values, in which breakage of the stem can occur before the curve is complete. The P12 and P20 values give a good indication for drought tolerance for more drought resistant trees. A general trend can be seen where the more a tree is burned, the lower the P12/P20 value. The analysis of the line of best fit is demonstrated in Table 2. The R-squared values indicated that 4% and 15% of the variation in thePLC can be explained by the burned percentage in the P12 and P20 curves, respectively. There is not a strong correlation between P12/P20 values and the burned percentage. The P20 R-square value is more significant showing a slightly higher probability that the burn percentage could be used to predict conductivity. This is contradictory to the vulnerability curves in Figure 4. It would have been expected to have a higher PLC as the percentage of burn went up.
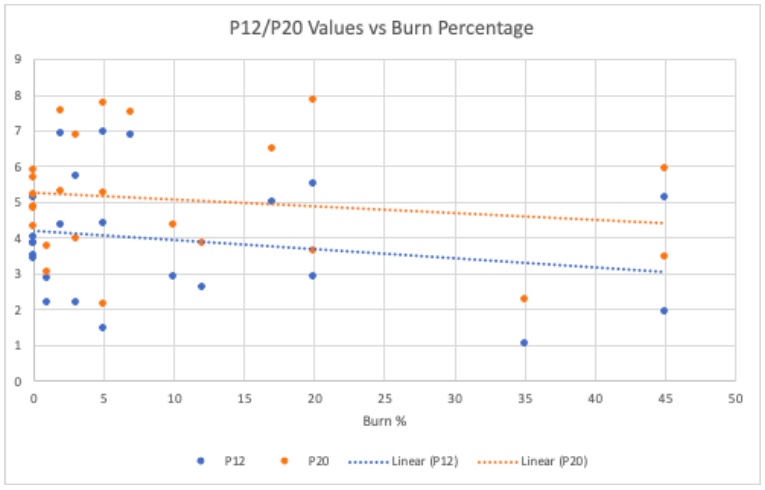
Figure 5. Plotted is the dependence of burn percentage on the P12 (dotted blue line) and P20 (dotted orange line) values. Each individual point represents a single tree branch P12 or P20 value calculated from their individual vulnerability curves. The burned percentage is the percentage of the tree thatwas visibly scorched. The dotted lines indicate the line of best fit for both the P12 and P20dependence.
Table 2. Statistical Significance of the data presented in Figure 5. The results were obtained using a linear regression.
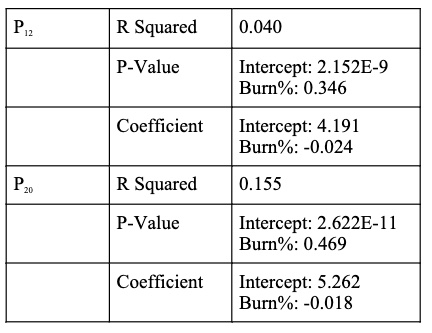
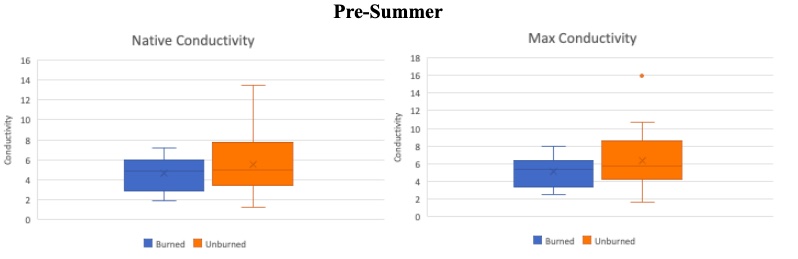
Figure 6. Pre-summer drought comparison using box plots for burned (blue) and unburned (orange) subsets of trees for both their native hydraulic conductivity (left) and max hydraulic conductivity (right). The native value indicates the hydraulic conductivity at the time the sample was taken. Whereas the max hydraulic conductivity is the maximum hydraulic conductivity the stem can produce. Boxes indicate median, minimum, maximum, interquartile range, and outlier values.
In Figure 6 the pre-summer native and maximum hydraulic conductivity values are shown as box plots. There is more variability within the unburned samples. Note that both the native and maximum values of the burned samples have lower conductivity values. For the natives this would indicate the burned subset of trees was experiencing more hydraulic stress at the beginning of the summer.
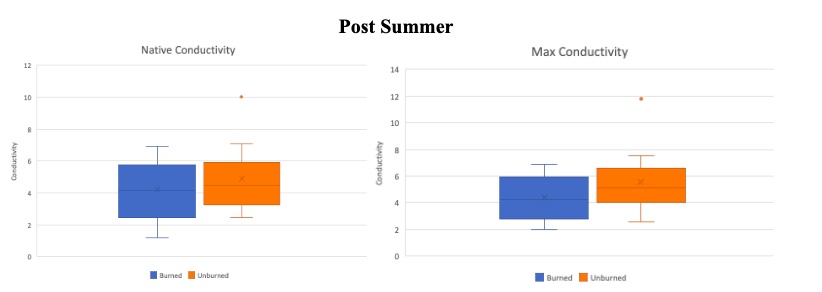
Figure 7. Post-summer drought comparison using box plots for burned (blue) and unburned (orange) subset of trees for both their native hydraulic conductivity (left) and maximum hydraulic conductivity (right). Boxes indicate median, minimum, maximum, interquartile range, and outlier values.
The same measurements (Native and Max conductivity) were taken again at the end of the summer. Similar to the pre-summer measurements, the burned values are lower for both the native and max values. Therefore the burned set of trees are still experiencing more stress at the end of the summer than the unburned trees.
Table 3. Statistical Significance of the data presented in figures 6-8. The results were obtained using F-tests, and T-tests.
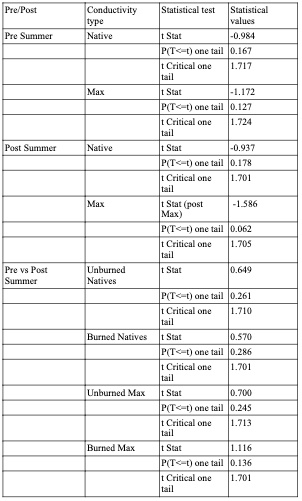
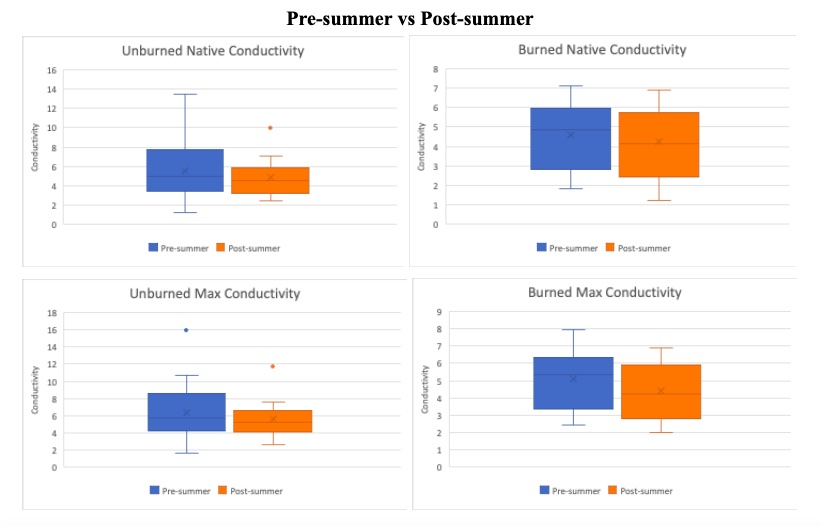
Figure 8. Pre-summer drought vs Post-summer drought comparison using box plots. Boxes indicate median, minimum, maximum, interquartile range, and outlier values. The native hydraulic conductivity (Top row) with the corresponding maximum hydraulic conductivity (bottom row), respectively. Each box plot compares the post-summer drought (blue) and pre-summer drought (orange) separated by unburned trees (left column) and burned trees (right column).
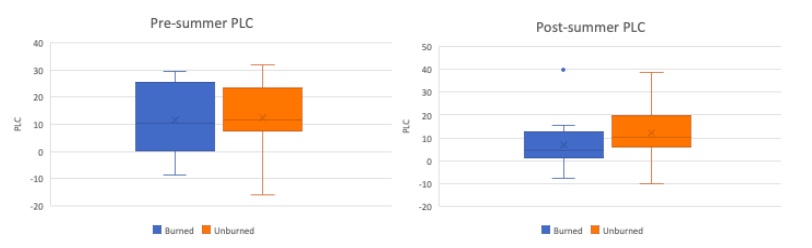
Figure 9. Pre-summer drought (left) vs Post-summer drought (right) comparison of PLC using box plots. The burned and unburned subset of trees are designated by blue and orange, respectively. Boxes indicate median, minimum, maximum, interquartile range, and outlier values.
To better understand the effect of the summer drought, the pre and post-summer anticipated native and maximum hydraulic conductivity values are compared in Figure 8. When reviewing maximum values one would expect the max values to increase because plants build new xylem over the summer. However the unburned and burned subset of trees in Figure 8 (bottom left and right box plots), there is a slight decrease in max hydraulic conductivity after the summer. Note the post-summer native values drop as expected following a summer drought, suggesting the tree experienced more stress and therefore more embolism. In Figure 9, the PLC was calculated using equation PLC=((Max-Native)/(Max))*100. The pre-summer PLC between burned and unburned were virtually the same. Whereas at the end of the summer the burned trees have a lower PLC than the unburned trees, indicating that the burned trees were under more stress.
Table 4. Statistical Significance of data presented in Figure 9. The results were obtained using F- tests, and T-tests
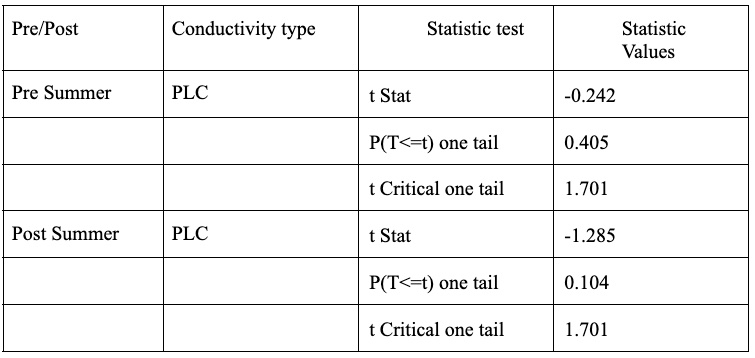
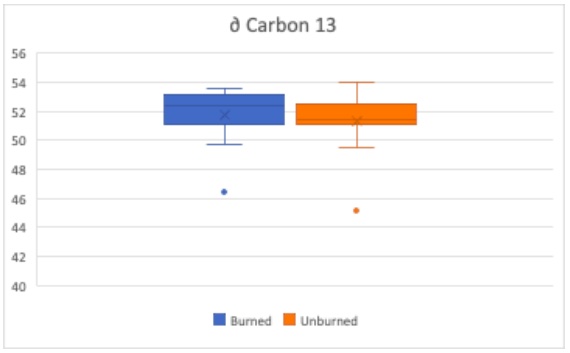
Figure 10. Carbon 13 to Carbon 12 Ratio are compared using box plots. Boxes indicate median, minimum, maximum, interquartile range, and outlier values. Burned subset of trees (blue) and unburned subset of trees (orange)
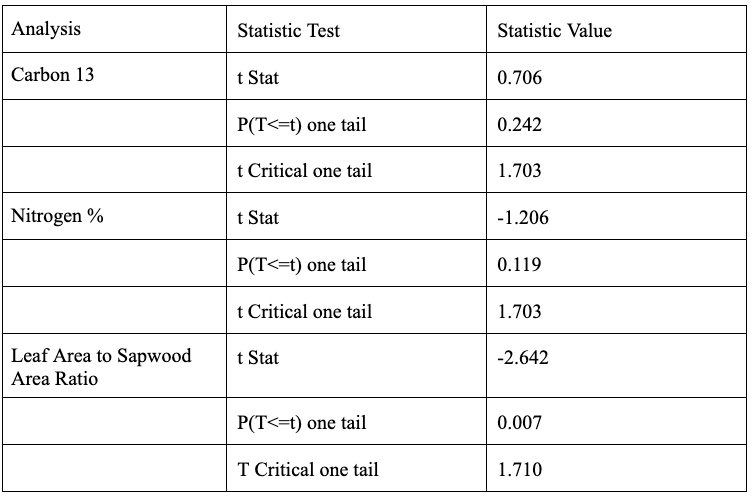
The ratio of Carbon-13 to Carbon-12 in a plant’s leaves is another indicator to the drought resistance of a tree. A larger 13C to 12C ratio indicates greater drought stress due to plants preferentially uptake 12C when possible, but will uptake 13C in drought conditions to minimize water loss during transpiration. Therefore, as seen in Figure 10, the burned set of trees are experiencing greater drought stress than the unburned trees. This difference is not considered significantly different with a p-value of 0.242. Although it is important to keep in mind the relatively small total sample size of 30 trees with two subsets of 15 trees each suggesting it is fairly hard to achieve statistical significance.
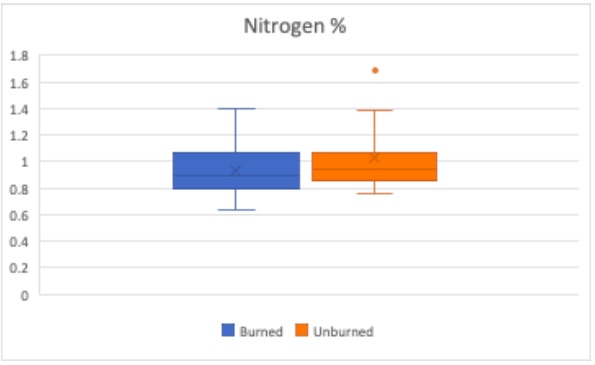
Figure 11. Burned subset of trees (blue) and unburned subset of trees (orange) Nitrogen percentage are compared using box plots. Boxes indicate median, minimum, maximum, interquartile range, and outlier values.
The health of a plant can be indicated by the percentage of nitrogen in their leaf. A plant with more nitrogen is healthier. The nitrogen percentage is linked to the photosynthetic capacity of the leaves and the amount of chlorophyll (Evans, 1989). As illustrated in Figure 11, the unburned trees are considered healthier with respect to leaf nitrogen content. This difference is not considered significantly different with a p value of 0.119. Although as previously mentioned the smaller sample size could be contributing to the lack of seeing statistical significance.
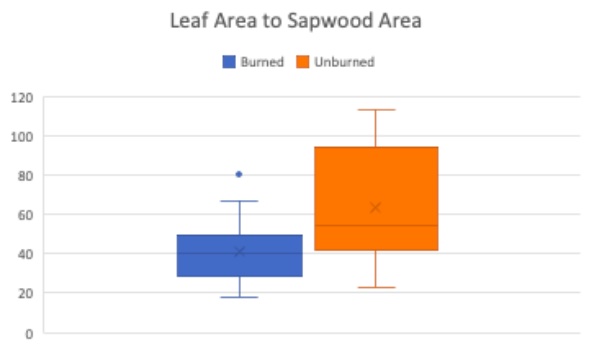
Figure 12. Burned subset of trees (blue) and unburned subset of trees (orange) leaf area to sapwood area ratio are compared using box plots.Boxes indicate median, minimum, maximum, interquartile range, and outlier values.
The last analysis performed was the Leaf Area to Sapwood Area ratio. Testing the leaf area vs. sapwood area will help determine whether transpiration efficiency has been impacted by drought (Togashi et al., 2015); more drought resistant trees tend to have a lower leaf area vs. sapwood area ratio. As illustrated in Figure 12, the burned trees have a significantly lower ratio (p value = 0.007) indicating that the burned trees are more drought resistant than the unburned trees.
Table 5. Statistical Significance of data presented in figures 10-12. The results were obtained using F-tests, and T-tests.
Discussion
This study suggests the Juniper species are more drought resistant after surviving and recovering from a fire event. The burned and unburned Juniper trees did not have a statistically significant difference between the pre and post drought measurements, health, and stress in each subset. The general health of the Juniper trees are generally not substantially impacted by fire.
Previous research has shown that wildfires can either cause immediate mortality or may cause tree health to decline as time continues (Thompson et al., 2016). This could indicate that the burned trees are on a slow decline as evident by the more stressed burned trees, with (the not statistically significant) slightly higher native PLC value, slightly higher ∂ carbon 13, and slightly lower nitrogen percentage.
Prior research suggests the scorching of the leaves during a fire can actually help with the survival of a burned tree because it can lessen the leaf area to sapwood ratio (Thompson et al., 2016). This phenomenon could explain the significant difference in the observed leaf area to sapwood area ratio seen in this study.
The heating of the tree’s xylem can potentially lessen the growth of future sapwood, which would limit the transport of water within the tree (Ducrey et al. 1996; Ryan et al. 1988; Dickson and Johnson 2004). Similarly, high temperatures can result in xylem cavitation resulting in lessening water transport (Kavanagh et al., 2010). However, this is not concurrent with results in this study, as it seems the burned trees are more efficient in transporting water. A potential reason could be the cambium which promotes the growth of the phloem and xylem has been shown to be more damaged by heat exposure (Salladay & Pittermann, 2023). Damage or stress to the cambium could result in the cambium producing smaller tracheids. This suggests the trees could be acclimating and building more drought resistant xylem.
Other prior research has found if trees have a sufficient amount of time to recover from a stressing event, the tree could be better adapted to future droughts (Anderegg et al., 2020). This is concurrent with the hydraulic vulnerability curves. This was observed with the higher P50 value of the burned Juniper trees in this study, indicating the burned Juniper trees can now handle more severe droughts. On average growth rates of surviving trees take an average of 2 to 4 years to recover from an extreme drought (Anderegg et al., 2015). Although the observation that the burned trees were under more stress could indicate the four years since the wildfire was enough time to heal to become more drought resistant, but not long enough to not be experiencing backlash stress from the fire. This could be evident by the fact that the leaves of the chosen trees were still visibly scorched.
On a similar note, we found the P12 value is negatively correlated with the burn percentage. Which is not as expected based on the hydraulic vulnerability curves which indicate the burned trees are more drought resistant. This could potentially identify a ‘sweet-spot’ to how much stress a tree can recover from. Whether there is a variable to consider for the trees with a more significant burn needing more time to recover than the four years in the study.
In conclusion, Junipers that have survived a wildfire are modestly more drought resistant than Junipers that were not affected by the wildfire. This is supported by the burned trees having a higher P50 value (~9.9 MPa) and also having a significantly lower leaf area to sapwood area ratio.
However at the same time, the burn subset was more stressed than their unburned counterparts, as seen by the lower PLC and native values of the burned subset. The slightly larger amount of carbon 13 within the leaves also indicates the burned trees were more stressed. The lesser amount of nitrogen in the burned leaves also indicates a less healthy tree. All of which may suggest the burned trees may need a longer recovery period to not be as stressed as the unburned trees even though they are more drought resistant.
References
Anderegg, W. R. L., Schwalm, C., Biondi, F., Camarero, J. J., Koch, G., Litvak, M., Ogle, K.,
Shaw, J. D., Shevliakova, E., Williams, A. P., Wolf, A., Ziaco, E., & Pacala, S. (2015). Pervasive drought legacies in forest ecosystems and their implications for carbon cycle models. Science, 349(6247), 528–532. http://www.jstor.org/stable/24748641
Anderegg, W. R., Trugman, A. T., Badgley, G., Konings, A. G., & Shaw, J. (2020). Divergent forest sensitivity to repeated extreme droughts. Nature Climate Change, 10(12), 1091– 1095. https://doi.org/10.1038/s41558-020-00919-1
Bestelmeyer, B. T., Okin, G. S., Duniway, M. C., Archer, S. R., Sayre, N. F., Williamson, J. C., & Herrick, J. E. (2015). Desertification, land use, and the transformation of global drylands. Frontiers in Ecology and the Environment, 13(1), 28–36. https://doi.org/10.1890/140162
Burns, R. M., & Honkala, B. H. (1990). Silvics of North America. U.S. Dept. of Agriculture, Forest Service.
Choat, B., Brodribb, T. J., Brodersen, C. R., Duursma, R. A., López, R., & Medlyn, B. E. (2018). Triggers of tree mortality under drought. Nature, 558(7711), 531–539. https://doi.org/10.1038/s41586-018-0240-x
Coomes, D. A., & Grubb, P. J. (2000). Impacts of root competition in forests and woodlands: A theoretical framework and review of Experiments. Ecological Monographs, 70(2), 171–207. https://doi.org/10.1890/0012-9615(2000)070[0171:iorcif]2.0.co;2
Dickinson, M. B., & Johnson, E. A. (2004). Temperature-dependent rate models of vascular cambium cell mortality. Canadian Journal of Forest Research, 34(3), 546–559. https://doi.org/10.1139/x03-223
Diffenbaugh, N. S., Swain, D. L., & Touma, D. (2015). Anthropogenic warming has increased drought risk in California. Proceedings of the National Academy of Sciences, 112(13), 3931–3936. https://doi.org/10.1073/pnas.1422385112
Ducrey, M., Duhoux, F., Huc, R., & Rigolot, E. (1996). The ecophysiological and growth responses of Aleppo Pine (pinushalepensis) to controlled heating applied to the base of the Trunk. Canadian Journal of Forest Research, 26(8), 1366–1374. https://doi.org/10.1139/x26-152
Evans, J. R. (1989). Photosynthesis and nitrogen relationships in leaves of C3 Plants. Oecologia, 78(1), 9–19. https://doi.org/10.1007/bf00377192
Hayes, M. J. (2006). Drought indices. Van Nostrand’s Scientific Encyclopedia.https://doi.org/10.1002/0471743984.vse8593
Hoover, D.L., Bestelmeyer, B., Grimm, N.B., Huxman, T.E., Reed, S.C., Sala, O., Seastedt, T.R., Wilmer, H., Ferrenberg, S. (2020). Traversing the wasteland: a framework for assessing ecological threats to Drylands. Bioscience 70, 35–47. https://doi.org/10.1093/biosci/biz126.
Hungerford RD, Harrington MG, Frandsen WH, Ryan KC, Niehoff GJ (1991) In: Harvey AE, Neuenschwander LF (eds) Influence of fire on factors that affect site productivity. Proceedings of the management and productivity of Western-montane forest soils.USDA
Kannenberg, S. A., Driscoll, A. W., Malesky, D., & Anderegg, W. R. L. (2021). Rapid and surprising dieback of utah Juniper in the southwestern USA due to acute drought stress. Forest Ecology and Management, 480, 118639. https://doi.org/10.1016/j.foreco.2020.118639
Kavanagh, K. L., Dickinson, M. B., & Bova, A. S. (2010). A way forward for fire-caused tree mortality prediction: Modeling a physiological consequence of fire. Fire Ecology, 6(1), 80–94. https://doi.org/10.4996/fireecology.0601080
National Geographic Area Coordination Center website portal. National Geographic Area Coordination Center Website Portal. (n.d.). https://gacc.nifc.gov/
County time series: Climate at a glance. County Time Series | Climate at a Glance | National Centers for Environmental Information (NCEI). (n.d.). https://www.ncei.noaa.gov/access/monitoring/climate-at-a-glance/county/time-series
McDowell, N. G., & Sevanto, S. (2010). The mechanisms of carbon starvation: How, when, or does it even occur at all? New Phytologist, 186(2), 264–266. https://doi.org/10.1111/j.1469-8137.2010.03232.x
McDowell, N., Pockman, W. T., Allen, C. D., Breshears, D. D., Cobb, N., Kolb, T., Plaut, J., Sperry, J., West, A., Williams, D. G., & Yepez, E. A. (2008). Mechanisms of plant survival and mortality during drought: Why do some plants survive while others succumb to drought? New Phytologist, 178(4), 719–739. https://doi.org/10.1111/j.1469-8137.2008.02436.x
Ramsey, R. D., & E. West, N. E. W. E. (n.d.). Vegetation of Utah, 49–56. https://cwcedb.utah.edu/wp-content/uploads/2022/03/ramsey-west-vegetation-of- utah.pdf
Ryan KC, Peterson DL, Reinhardt ED (1988) Modeling long-term fire-caused mortality of Douglas-fir. For Sci 34:190–199
Salladay, R. A., & Pittermann, J. (2023). Using heat plumes to simulate post-fire effects on cambial viability and hydraulic performance in sequoia sempervirens stems. Tree Physiology, 43(5), 769–780. https://doi.org/10.1093/treephys/tpad006
Schenk, H.J., Espino, S., Goedhart, C.M., Nordenstahl, M., Martinez Cabrera, H.I.,Jones, C.S., 2008. Hydraulic integration and shrub growth form linked across continental aridity gradients. Proc. Natl. Acad. Sci. U. S. A. 105, 11248–11253. https://doi.org/10.1073/pnas.0804294105.
Schwinning, S., Litvak, M. E., Pockman, W. T., Pangle, R. E., Fox, A. M., Huang, C.-W., & McIntire, C. D. (2020a). A 3-dimensional model of pinus edulis and Juniperus monosperma root distributions in New Mexico: Implications for soil water dynamics. Plant and Soil, 450(1–2), 337–355. https://doi.org/10.1007/s11104-020-04446-y
Sevanto, S., McDowell, N. G., Dickman, L. T., Pangle, R., & Pockman, W. T. (2013). How do trees die? A test of the hydraulic failure and carbon starvation hypotheses. Plant, Cell & Environment, 37(1), 153–161. https://doi.org/10.1111/pce.12141
Smith, M. D. (2011). The ecological role of climate extremes: current understanding and future prospects. Journal of Ecology, 99(6). https://doi.org/10.1111/jec.2011.99.issue-6
Sperry, J. S., Donnelly, J. R., & Tyree, M. T. (1988). A method for measuring hydraulic conductivity and embolism in xylem. Plant, Cell & Environment, 11(1), 35–40. https://doi.org/10.1111/j.1365-3040.1988.tb01774.x
Sperry, J. (2007). Sperry Lab. The Sperry Lab at The University of Utah.https://sperry.biology.utah.edu/
Swezy, D. M., & Agee, J. K. (1991). Prescribed-fire effects on fine-root and tree mortality in old- growth ponderosa pine. Canadian Journal of Forest Research, 21(5), 626–634. https://doi.org/10.1139/x91-086
Szejner, P., Belmecheri, S., Ehleringer, J. R., & Monson, R. K. (2019). Recent increases in drought frequency cause observed multi-year drought legacies in the tree rings of semi-arid forests. Oecologia, 192(1), 241–259. https://doi.org/10.1007/s00442-019-04550-6
Thompson, M. T., Koyama, A., & Kavanagh, K. L. (2016). Wildfire effects on physiological properties in conifers of central Idaho Forests, USA. Trees, 31(2), 545–555. https://doi.org/10.1007/s00468-016-1489-z
Togashi, H. F., Prentice, I. C., Evans, B. J., Forrester, D. I., Drake, P., Feikema, P., Brooksbank, K.,Eamus, D., & Taylor, D. (2015). Morphological and moisture availability controls of the leaf area‐to‐sapwood area ratio: Analysis of measurements on australian trees.
Ecology and Evolution, 5(6), 1263–1270. https://doi.org/10.1002/ece3.1344
West, A.G., Hultine, K.R., Burtch, K.G., Ehleringer, J.R., 2007a. Seasonal variations in moisture use in a pinon-Juniper ̃ woodland. Oecologia 153, 787–798. https://doi.org/10.1007/s00442-007-0777-0.
