College of Health
31 An Examination of Sleep Diary versus Wrist Actigraphy Data
Hailee Fell; Michelle Kubicki; Audrey Stegman; Grace Zimmerman; and Christopher Depner
Faculty Mentor: Christopher Depner (Health and Kinesiology, University of Utah)
Introduction
The Sleep Research Society and American Academy of Sleep Medicine recommend obtaining 7 hours of sleep per night (Watson, N.F. et al. 2015) in healthy young adults. However, in 2022, 1 in 3 adults in the United States reported sleeping less than the recommended 7 hours per night (National Heart, Lung, and Blood Institute, 2022). Previous findings have shown that short sleep duration is associated with adverse health outcomes including obesity, diabetes, heart disease, and overall mortality (Depner, et al. 2019). Many studies have investigated this relationship; however, sleep measurement methods may influence the results and interpretations of the data. There are also different ways data can be collected depending on what is being measured. Some studies use polysomnography (PSG), known as the “gold standard” for most sleep outcomes and clinical diagnostics of sleep disorders. PSG utilizes electroencephalography, pulse-oximetry, electrocardiogram, airflow, respiratory effort, and electromyogram to record the electrophysiology of the brain during sleep. Thus, PSG has excellent accuracy in quantifying the electrophysiological characteristics of the brain during sleep (Rundo and Downey 2019). Despite its status as the gold- standard, PSG has limitations, such as high cost and participant burden. Moreover, PSG requires technical expertise with specific tools that typically require overnight visits in the laboratory. (Lehrer, Yao et al. 2022). Due to these restrictions, there are other methods of measuring sleep that are less costly and can allow for at-home monitoring, such as sleep diaries and wrist-worn actigraphy. Notably, home sleep monitoring may lack the rigor of laboratory monitoring but has the advantage of being more ecologically valid and representative of real-world sleep habits. Using self-reported data such as sleep diaries can provide information on timing of sleep and wakefulness, time in and out of bed, duration of sleep, as well as qualitative dimensions of sleep such as satisfaction. However, self-report can be biased and create more confounding variables due to inaccuracy and lack of adherence over time. Another tool, wrist actigraphy, measures wrist movement and light levels during daily activity and sleep to estimate time in bed and sleep duration. Wrist actigraphy, however, can falsely label low levels of wrist movement (e.g. quiet wakefulness) as sleep. Thus, there are many methods to assess sleep, and currently it is not established if there is a superior method for use in free-living sleep intervention studies focused on cardiometabolic endpoints.
As such, our goal is to evaluate the difference in total sleep time (TST) between sleep diary and wrist actigraphy in individuals who report habitually sleeping less than 6.5 hours per night. Additionally, we want to observe the correlation between sleep duration and insulin sensitivity, using the Matsuda Index. Data are derived from a single-arm sleep extension study with a 2-week baseline and 4-week sleep extension intervention segments.
Methods
Data collection is ongoing. Inclusion criteria seeks men and women aged 18-35, having body mass index of 18.5 – 24.9 kg/m2, habitual sleep duration of less than 6.5 hours per night and having lived at the altitude of Salt Lake City or higher for at least 3 months. For the study protocol, participants complete 2 weeks of baseline at-home monitoring followed by 4 weeks of sleep extension, where participants are asked to extend their nightly time in bed by 2 hours per night. Sleep is measured daily by self-report sleep diaries and continuous wrist-worn actigraphy. Each day, participants are asked to record information in their sleep diaries about their sleep and wake times, and times they got in and out of bed for the day. Participants wore an Actiwatch device throughout the study to monitor light exposure and physical activity levels through wrist movement. The actigraphy data from the Actiwatch is manually scored by two different laboratory members to ensure accuracy. After baseline and sleep extension segments, oral glucose tolerance testing (OGTT) was administered one hour after waketime, providing plasma glucose (PG) and insulin levels after 30-, 60-, 90- and 120- minutes. These measurements were used to calculate Matsuda Index insulin sensitivity.
Statistical Analysis
We compared baseline versus sleep extension using a linear mixed-effects regression (LMER) model for the following outcomes: sleep duration by actigraphy, sleep duration by sleep diary, and Matsuda Index insulin sensitivity. We also used a linear mixed-effects regression model to observe if there was a correlation between sleep duration and insulin sensitivity using sleep duration by actigraphy and sleep duration by diary. To compare sleep duration by actigraphy versus sleep diary, we used a Bland-Altman plot. Actigraphy data and sleep diary data were processed through R and we used actigraphy as the reference data and sleep diary as the experimental data. To determine if there was a statistical significance between the two methods, we used a two-tailed T-test.
Results
20 participants, 14 males and 6 females, completed the entirety of the study. During baseline, the average sleep duration measured by actigraphy was 5.55 hours ± 0.81 (mean, SEM) while the sleep duration measured by sleep diary was 6.85 hours ± 1.17 (mean, SEM). During the sleep extension intervention, the average sleep duration measured by actigraphy was 6.44 hours ± 0.53 (mean, SEM) while measured by sleep diary, it was 8.08 ± 0.86 (mean, SEM). A T-test revealed statistically significant differences between the total sleep duration recorded by the sleep diary and actigraphy, both during baseline (t(df) = 7.56e-3, p = 5.85e-08) and sleep extension (t(df) = 2.58e-07, p = 2.72e-06) segments. Figure 1 supports this data, indicating a consistent trend where the total sleep time reported by the sleep diary tends to be overestimated compared to actigraphy. As total sleep time increases, so does the disparity between the two methods, suggesting a consistent tendency for the sleep diary to overestimate sleep duration.
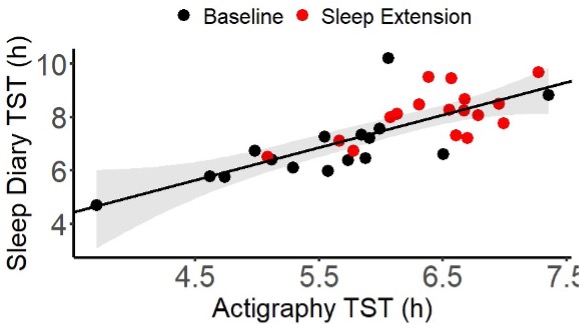
Figure 1: Linear mixed-effects regression data showing the difference in total sleep time (TST) between manually scored actigraphy data and self-reported sleep diary data.
Next, we used LMER to asssess the relationship between Matsuda insulin sensitivity, sleep duration measured by actigraphy, and sleep duration measured by sleep diary. We compared actigraphy and sleep diary separately withMatsuda Index to see if one had more or less of an effect than the other. The average Matsuda Index score at baseline was7.47 ± 4.18 (mean, SEM) while during sleep extension, it was 5.27 ± 1.83 (mean, SEM). There was no statistically significant relationship between insulin sensitivity and sleep duration measured by actigraphy (p = 0.44) or by sleep diary (p = 0.29).
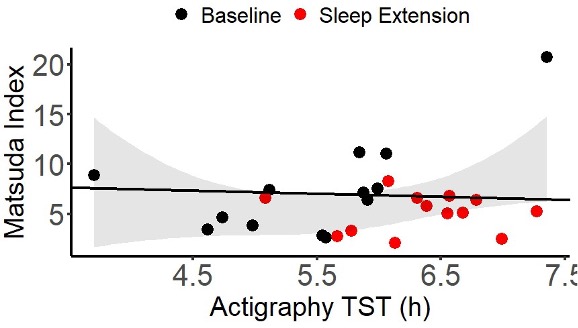
Figure 2: Linear mixed-effect regression associating Matsuda Index with total sleep time measured by actigraphy.
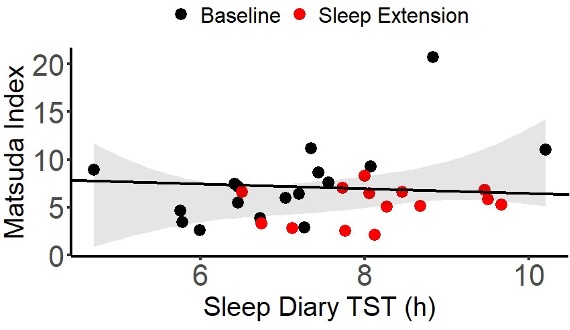
Figure 3. Linear mixed-effect regression associating Matsuda Index with total sleep time measured by sleep diary.
Lastly, we created a Bland-Altman plot to compare sleep duration by actigraphy and sleep duration by sleep diary.Similarly to the linear mixed-effect regression comparing sleep duration by actigraphy and sleep diary, the Bland-Altman plot shows that as sleep duration increases by actigraphy, sleep diary reports approximately 1.2 hours more sleep than actigraphy data.
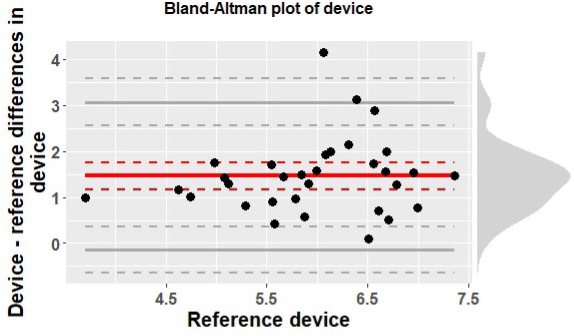
Figure 4: Bland-Altman plot shows a comparison between scored actigraphy data and sleep diary data. Actigraphyserved as the reference device, with sleep diary data being compared with it. The red line represents the mean difference, with the solid gray lines representing the limits of agreement (LoA). The dashed lines are the 95% CI.
Discussion
The primary focus of this research was to compare sleep duration measured by actigraphy and sleep diarymethods. A secondary outcome of this research was to investigate the relationship between sleep duration and insulin sensitivity. Our findings revealed a statistically significant difference in sleep duration as reported by wrist-wornactigraphy and sleep diary entries, with the latter consistently overestimating total sleep time compared to actigraphy. This emphasizes the importance of refining research methods for future sleep research. However, our analysis did not yield a statistically significant relationship between insulin sensitivity and sleep duration measured by either actigraphyor sleep diary. This contradicts previous research findings suggesting a link between shorter sleep duration and decreased insulin sensitivity. Our findings indicate a need to explore alternative factors, such as potential shifts in circadian timing resulting from sleep extension, which may influence insulin sensitivity. Further research is needed to see the potential relationship between circadian rhythms and insulin sensitivity.
References
Depner, C. M., Melanson, E. L., Eckel, R. H., Snell-Bergeon, J. K., Perreault, L., Bergman, B. C., Higgins, J. A., Guerin, M. K., Stothard, E. R., Morton, S. J., & Wright Jr., K. P. Ad libitum Weekend Recovery Sleep Fails toPrevent Metabolic Dysregulation during a Repeating Pattern of Insufficient Sleep and Weekend Recovery Sleep. (2019). Current Biology, 29(6), 957-967. https://doi.org/10.1016/j.cub.2019.01.069
Lehrer, H. M., et al. (2022). “Comparing polysomnography, actigraphy, and sleep diary in the home environment: TheStudy of Women’s Health Across the Nation (SWAN) Sleep Study.” Sleep Adv 3(1): zpac001.
National Heart, Lung, and Blood Institute. (2022, March 24). What are sleep deprivation and deficiency? https://www.nhlbi.nih.gov/health/sleep-deprivation
Rundo, J. V. and R. Downey, 3rd (2019). “Polysomnography.” Handb Clin Neurol 160: 381-392.
Watson, N.F., Safwan Badr, M., Belenky, G., Bliwise D.L., Buxton, O.M., Buysse, D., Dinges, D. F., Ganwisch, J., Grander, M.A., Kushida, C., Malhotra, R.K., Martin, J.L., Patel, S.R., Quan, S.F., & Tasali, E. (2015). Recommended Amount of Sleep for a Healthy Adult: A Joint Consensus Statement of the American Academy of Sleep Medicine and Sleep Research Society. Journal of Clinical Sleep Medicine, 11(6), 591-592.https://doi.org/10.5664/jcsm.4758
