College of Social and Behavioral Science
137 Perceptions of Climate Change
Amelia Ballard; Tabitha Benney; Rachel Christensen; and Mac Fackrell
Faculty Mentor: Tabitha Bennett (Political Science, University of Utah)
Abstract
Climate change is a very pressing issue that our current world is facing, and it is only getting worse. Climate change affects lower-income populations significantly more than higher-income populations due to a lot of different factors. Because of this, we decided to research how college students specifically at the University of Utah perceive climate change in their personal lives. We want to see if people who grew up with lower socioeconomic status and attend the University of Utah have different perceptions of climate change than those who grew up with higher socioeconomic status. We asked the question “How do varied income and other socioeconomic identifiers affect the severity of how citizens in Utah experience climate consequences?” We used a 25-question survey that asked questions about demographics including race, major, parental income, and others. We also asked questions about how they perceive climate change and how it has affected their personal lives. We received 45 responses from a diverse number of individuals attending the U. Our resultswere very interesting and we found that most people attending the University of Utah are fairly affluent and may not experience the same negative effects that some low-income communities face. We did find a lot of interesting correlations between how people view climate change and how much money their parents make, but we did not get enough data to generalize this to larger populations, or to be able to say how all people are affected.
Introduction
Our research was focused on how differences in socioeconomic status perpetuate perceptions of climate change within a diverse and local student body. The topic of environmental justice is increasing in popularity as climate disasters continue to become more prevalent. Different socioeconomic and sociodemographic factors can influence the level to which environmental injustice is experienced. Identifiers such as race, ethnicity, income, social status, location, andeducation can all affect the way climate change is experienced and responded to. We hypothesize that those of lower economic standing (living near or below the poverty line of each respective location) as well as minorities and people of color are subjected to disproportionately negative responses and impacts of climate change, thus defining environmental injustice.
Methods
In conducting this research, we aimed to explore the perceptions and experiences of climate change within an extensive and diverse student body. As will be explained further in this section, we used socioeconomic factors and general demographics as our variables to measure perceptions. It is important to note that our analysis aimed to conclude an overarching generalizable conclusion on perception, which is distinctive from risk perception. Risk perception is a subjective construct distinguished by potential damage or harm; and is often unknowingly used by the generalpublic through various factors such as trust, experiences, and emotions (Sullivan & White, 2019). The reason for the discernment is that measuring risk perception implies a prior knowledge base concerning climate change. For example, if we asked a subject about their perceived risks regarding increased flood rates—it would be assuming that the subject understands the reason and the outcomes for the flood increase. Our goal was to establish how much a population truly knows of climate change and how their socioeconomic demographics change the perception of that knowledge. Further research can then look forward to areas in risk mitigation, policy advertisement, or potential education curriculum.
Data
In this analysis, we used a quantitative survey method to obtain our data. We selected this method because our sample was college students, and we needed a relatively quick and straightforward method. We predicted a higher response rate from a survey than other qualitative or mixed methods. Another reason for our decision to conduct research with a survey is the opportunity it presented for snowball sampling. We asked subjects to pass on the survey to as many people as they would like after completing their responses. While other methods also allow for snowball sampling, the scale that we were striving for was simpler via survey. This way created a more generalizable conclusion due to the randomization of individuals who may be surveyed. Our study consisted of three main segments; 1) establishing demographics, 2) understanding respondents’ knowledge of climate change, and 3) gauging respondents’ perception of climate change. To do this, we asked questions about identified race, gender, income, and characteristics of their academics. Next, we asked questions whose answers will be quantified into scales based on knowledge and perception.After completing the questions, the respondent was allowed to disclose any more information or anecdotes that they felt were relevant through a text box. It was a chance for us to hear first-hand experiences regarding climate change, which we did not overtly address in the drafted survey. Collectively our questions covered our goal of understanding a general perception of climate change based on socioeconomic factors. We hoped to get honest answers that help us understand the relationship between our two variables.
Sample
Our goal was to sample as wide of a range of people as we were able to. We sent our survey out to U of U students in hopes that people from different races, socioeconomic statuses, ages, sexes, and neighborhoods would respond. Because we were looking at how different groups perceive climate change, we needed people from all different backgrounds to get the best results possible. We ensured that we got the survey out to enough people so that we were able to get at least a few participants from different demographics. Having a wide range of participants made our data more generalizable. It gave us a good understanding of people’s views on climate change and how that changes depending on different factors. We made an easy- to-access survey with around ten questions concerning views on climate change and then sent it to people over text or social media.
We sent it to friends as well as group chats and other organizations that wehad access to. We also asked everyone who took the survey to send it to just one person that they know, in hopes of a snowball effect. By doing this we hoped to get it out of our close circles of friends and get people that we don’t know to answer our survey.
When sending the survey out to people we made sure to let participants know that it is a super quick survey and anonymous, so that they may be more willing to take it. The sampling probability we used was non-probability. This was because we have narrowed our participants to just U of U students, and we have written our questions so that they are only applicable to U of U students. If we had other people answering our survey it might have skewed our data. We were also trying to get our data from different demographics, so if we don’t have enough information from one group we may try to get more responses from that demographic specifically.
Measures
The main concepts that we were measuring in this study were different U of U students’ perceptions of climate change and how they have been affected. We were trying to find the difference in perception among individuals with different socioeconomic statuses (SES). The independent variable in our study is socioeconomic status. SES is a combination of the social and economic standing of an individual or group. Studies have shown that as SES goes either up or down, perceptions and views of climate change also change.
There are a lot of other factors that can also contribute to the perception of climate change, but we believe that SES is the most important. Some of the other variables that are also considered are sex, age, neighborhood, or occupation. We measured this by anonymously asking our participants questions about their race, sex, age, income, occupation, etc. The dependent variable in our study was personal perception of climate change. Perception of climate change can mean a lot of different things, but we are narrowing it down to how people feel about the overall issue of warming temperatures and the results of it like bad air quality, bad water quality, or other major effects that have affected their day to day personal life. We measured this by asking our participants questions about climate change and how they feel about it. We also made these questions simple and easy to understand so that even people who don’t understand or know a lot about climate change could answer them.
Analysis
Our two variables, socioeconomic status, and perception of climate change were measured concerning a variety of factors including age, race, age, and income level. After collecting our responses from our surveys, we laid out the data in a spreadsheet with multiple tables to determine what factors are most common when it comes to someone’s SES and/or perceptions of climate change. Inversely, we found what factors were irrelevant or highly specific to one type of identifier such as age, sex, race, or income level instead of a combination. Dissecting this information leads us to clarity regarding factors that contribute to environmental injustices and perceptions of climate change in the Salt Lake Valley.
Results
As stated before, we sent out a survey to different groups around campus asking a series of questions regarding their demographics, and how they perceive climate change. Our survey was intended for only students attending the University of Utah and we got 45 responses from a wide range of different people. Our respondents were about two-thirds female and one-third male. They were between the ages of 18-27 with about 50% being 19 or 20, and 60% of our respondents were second or third years in school. About 86% of respondents were white, 7% were mixed race, and the other 7% identified as either Asian or Hispanic. We surveyed mostly undergraduate students but of our 45 responses, we had one graduate response. There was a very wide range of majors within our responses, but there was not one, in particular, that was the most common. Our respondents were split between 50% out-of-state students, and 50% in-state students. Most importantly we had a wide range of respondents from different socioeconomic statuses. To try to measure this we asked a series of questions about money. About 62% of our respondents do not pay their tuition. 26% of our respondents do pay for their tuition fully. The other respondents reported paying for theirtuition partially, some with scholarships some with help from others. The majority of our respondents do receive some money for tuition from scholarships. Because we are surveying college students, we decided to ask about parents’ income as opposed to personal income. About 30% of our respondents’ parents make over $200,000 annually, 17% of respondent’s parents make between $151,000 and $200,000, 20% of respondent’s parents make between $101,000 and 150,000, 30% of respondent’s parents make between $51,000 and 100,000 and 4% or respondents parents make less than $50,000 annually.
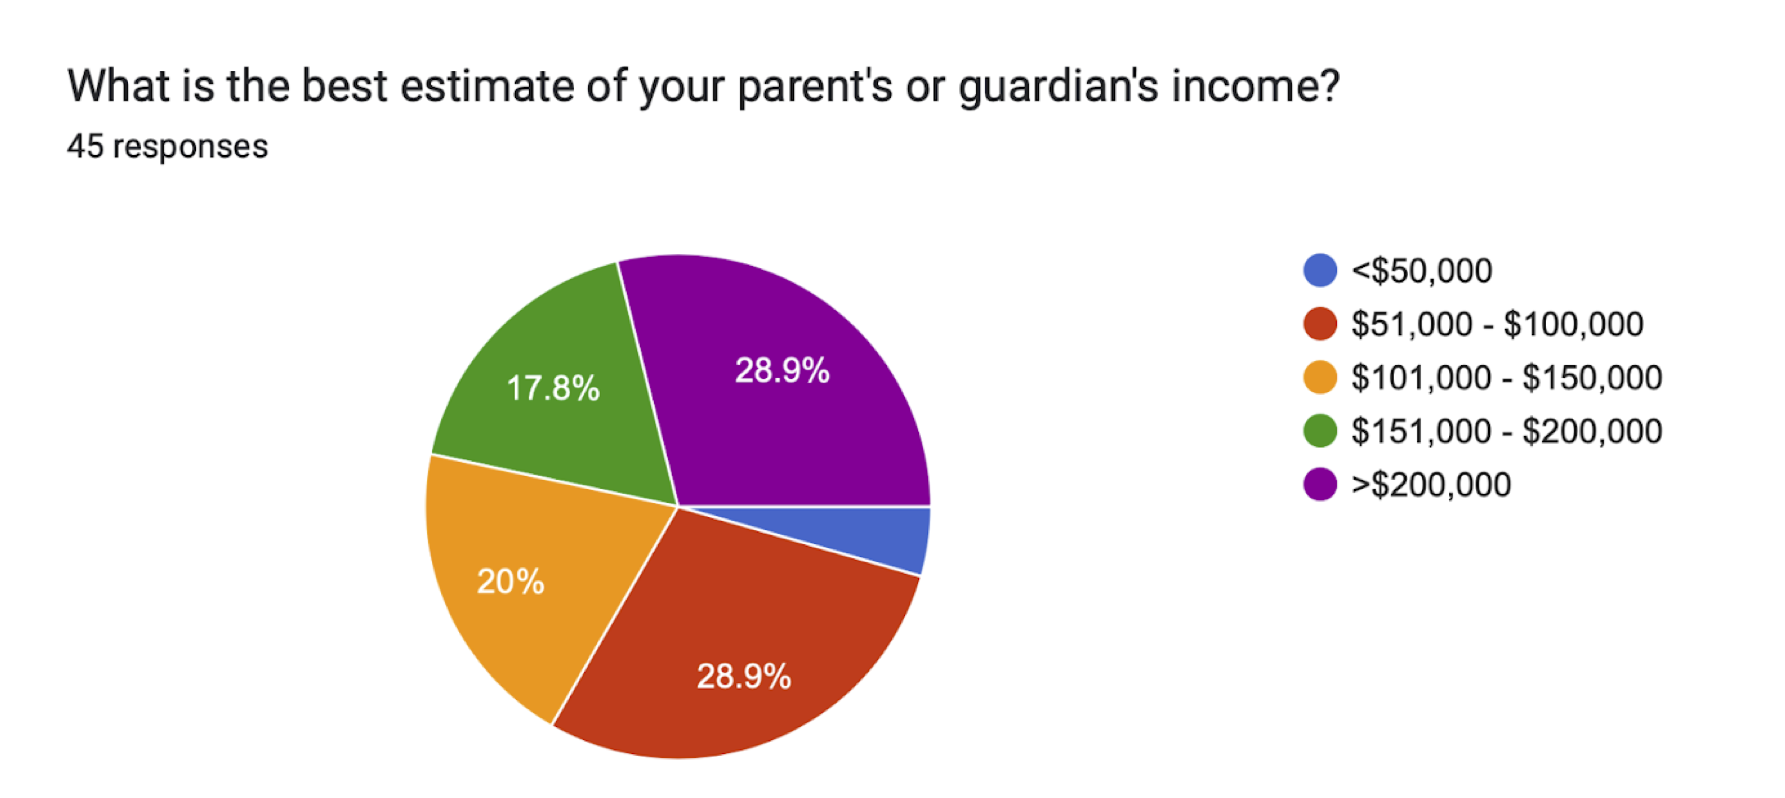
When comparing these demographics to other literature it is important to look at how our respondents compare to studies done on a more generalizable and broad scale, so we are going to compare them to the state of Utah. The average household salary in Utah is approximately $74,000 annually whereas 79% of our respondents reported that theirparents make $100,000 or more annually. The rest of our demographics are difficult to compare to other literature because we only surveyed college students attending the University of Utah, and most studies use a broader range of people.
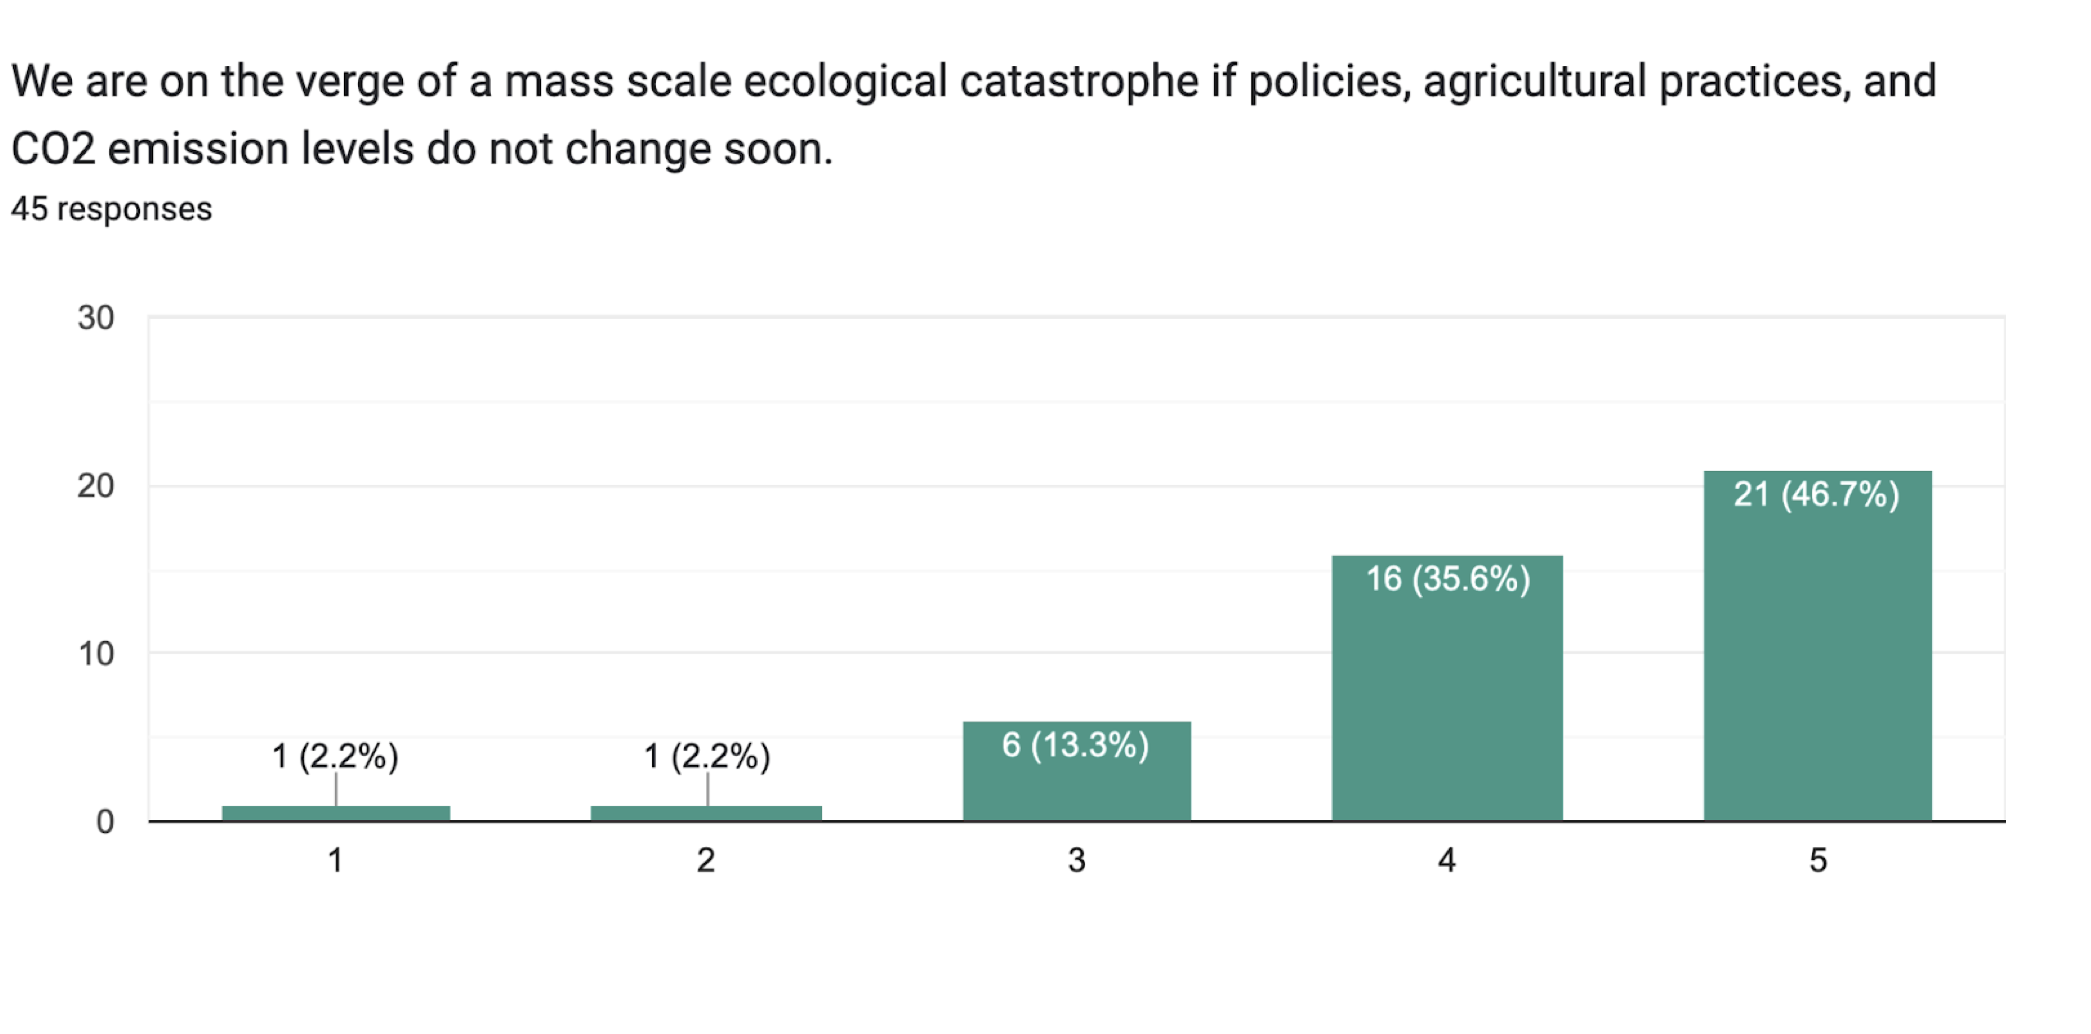
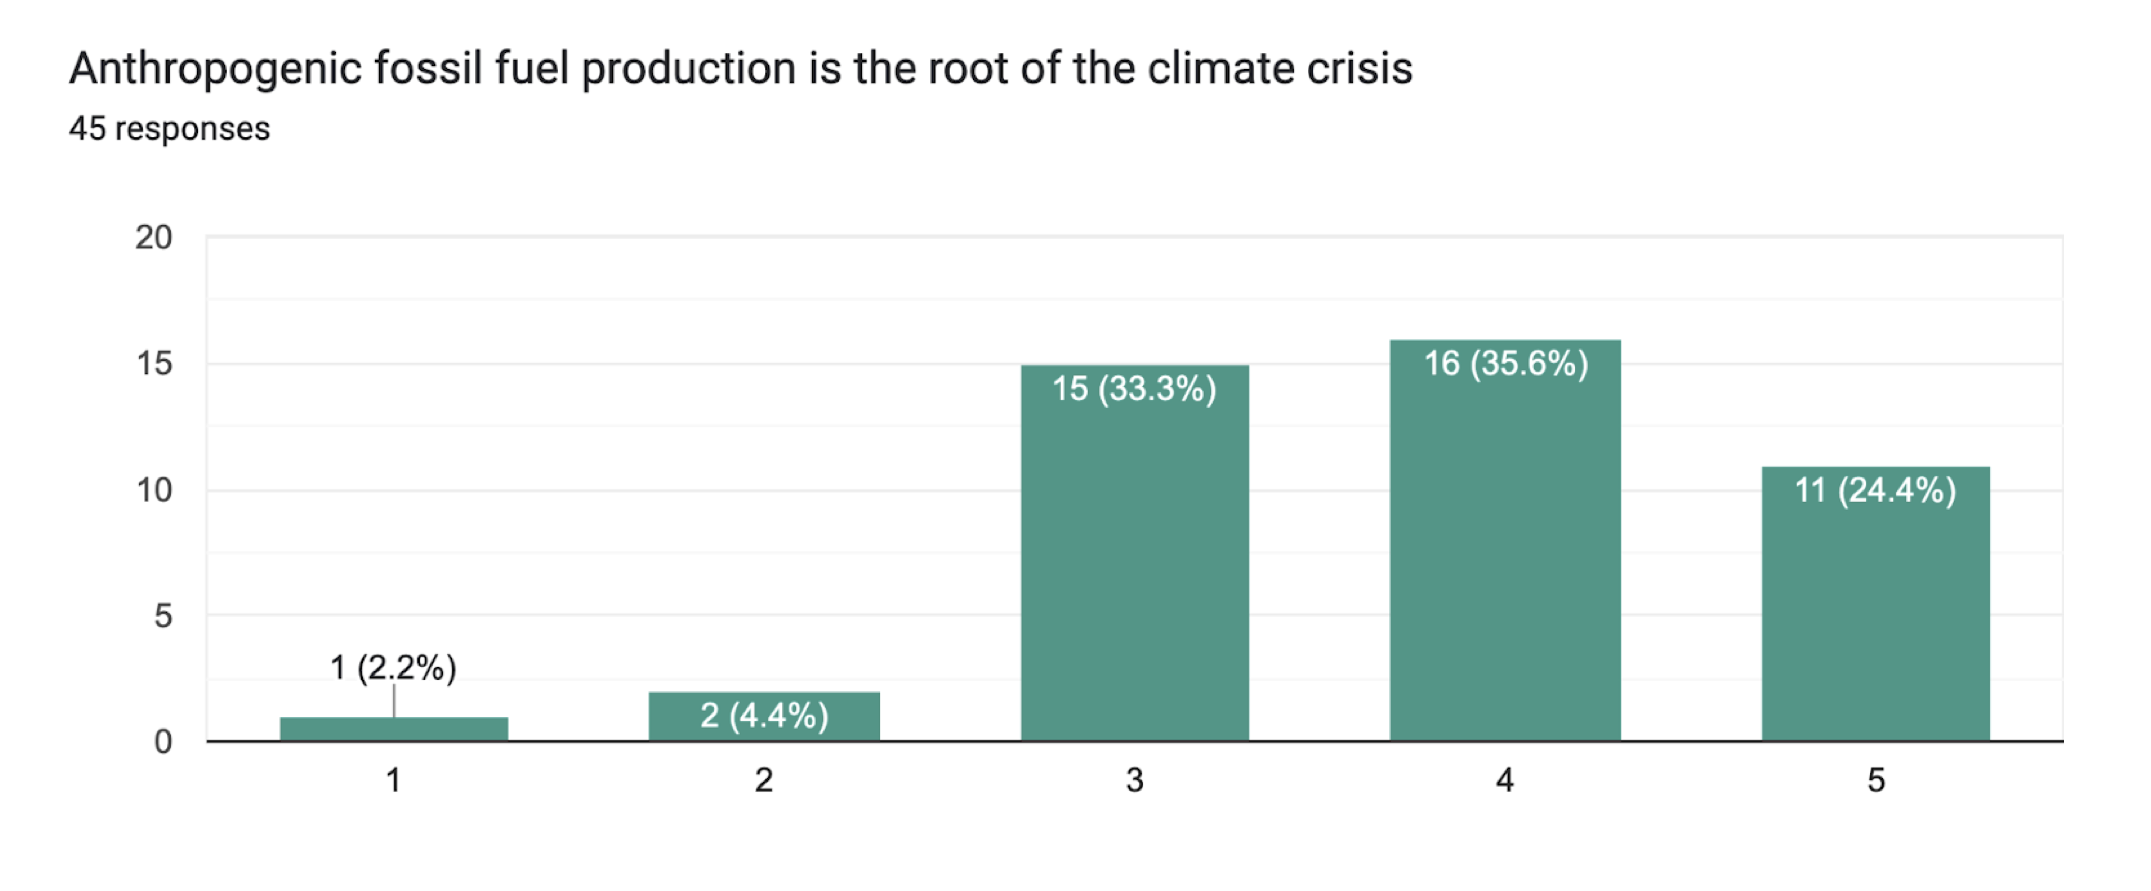
The second section of our survey consisted of five different statements paired with a scale of agreement. Our aim with this section was to gaugeour respondent’s base knowledge of the climate crisis, from there wefocused on perceptions in the third section. What we found were generally negatively skewed graphs. As pictured below, these questions discussed the consequences of the climate crisis, and a vast majority of subjects chose between strongly agree, agree, and neutral respectively. From these graphs, we seem to yield that our respondents have a general grasp of the climate crisis.
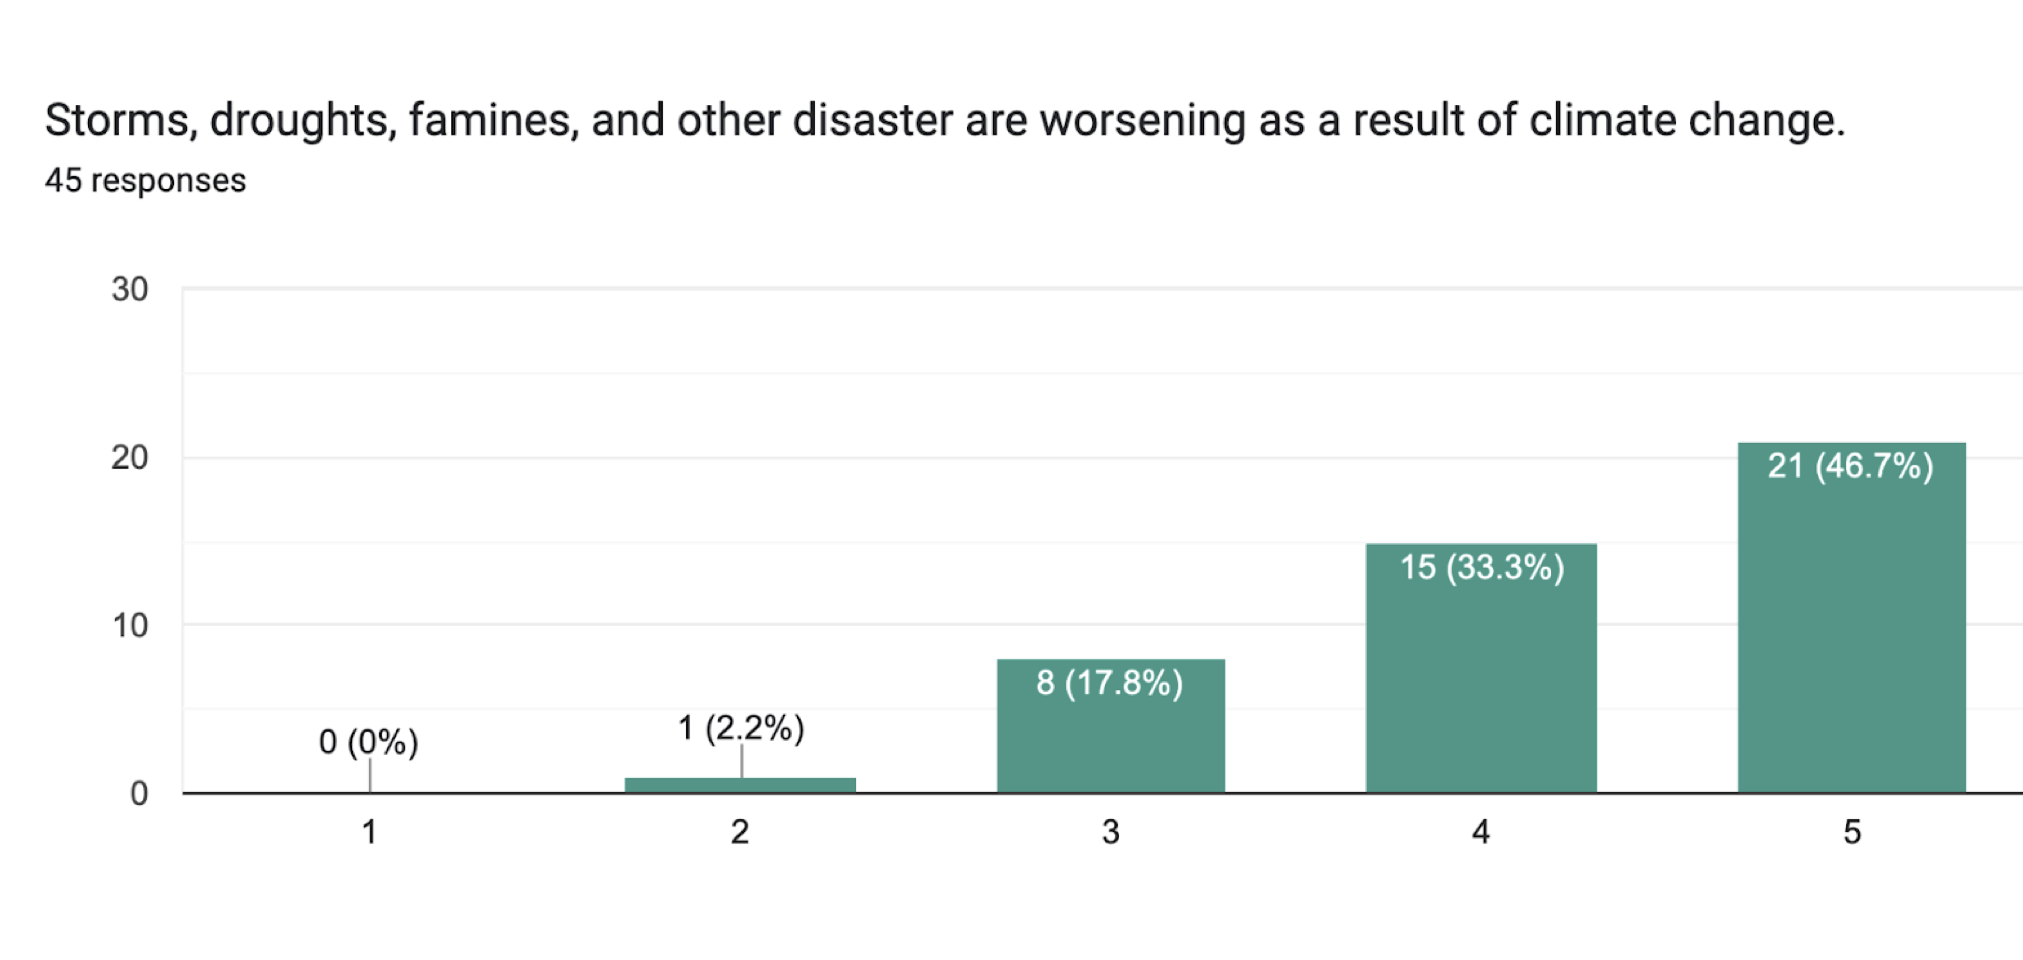
However, there was only a single graph that did not strongly agree with its highest response rate. This question is asked directly: Do you believe that anthropogenic fossil fuel production is the root cause of climate change? It appears it is harder for people to wholeheartedly agree on a root cause of climate change, even though they strongly agree with the existence of the climate crisis and the consequences of anthropogenic fossil fuel use. This result impacts the last section of our survey. There’s an apparent disconnect in the perception between individuals and the climate crisis regarding the root cause of climate change.
We followed that by asking questions that would dissect how peopleperceived climate change and how that may be related to their age, major, or family income. Some of the questions were directed at asking what the difference between climate change and global warming may or may not be. Of our respondents, 44% didn’t believe there was a difference between the terms global warming, climate change, and climate crisis while 31% did think there was. The reasons respondents gave for either were “climate change is an umbrella term that includes global warming” or “change – shift in climate, crisis – disaster, global warming – all-encompassing.” These terms are interpreted differently by many. When asked what climate threats were most pressing out of several categories, air and water health, carbon emissions, and homelessness and refugees were of the utmost concern. The most important according to our survey was reducing carbon consumption and emissions with a 42% response rate with homelessness and air and water health following behind with 15%. What we found most surprising is that despite variations in causes and definitions of climate change, 62% or about one-third of those surveyed believed they would be affected by changes in climate somehow. Additionally, roughly 58% believed that other people around the world would feel the effects of climate change the most, a rather ethnocentric perspective that is increasingly common in wealthier countries.
When asked about more socioeconomic and demographic impacts, about half of our sample believed that climate change disproportionately affects disadvantaged communities, and only about 7% didn’t. Around 40% of respondents felt relatively responsible for taking action against climate change, a positive and hopeful result we hope is applicable on a larger scale rather than just to University of Utah students. Overall, respondents believed that climate change is a present and growing threat, disadvantaged communities are affected at greater rates than their peers, and that we have a responsibility to address and make changes to better our planetary health.
Discussion
Understanding the various perceptions of climate change proved insightful ata foundational level. Our hypothesis was centered around the idea that relative socioeconomic status influenced positive or negative perceptions regarding the climate and the responses one would take. The data that we got did support our hypothesis to an extent. We were able to see a few trends relating to socioeconomic status and perception of climate change, but most of our respondents were fairly affluent, so it was hard to measure how people from very different socioeconomic statuses perceive climate change. This was also one of our limitations, we did not have enough time or resources to get our survey to people who are truly experiencing poverty. We were limited to individuals who are attending the University of Utah, and most people who can afford college are somewhat affluent, so that was another one of our limitations. Our project did have a lot of strengths though. We were able to get our survey out to a wide range of people at the University of Utah and see how different majors, ages, hometowns, and other factors change how students perceive climate change. Future research that has more time and resources would be able to survey a much larger sample of people and could use much more generalizable data. This being said, our research is still very important to this topic because it shows a little bit about how college students specifically think about climate change, which could be interesting when looking at other similar universities. Overall, this entire project was super interesting and important to us and we were very pleased with what we were able to learn by researching and surveying this topic.
Works Cited
Banzhaf, S., Ma, L., & Timmins, C. (2019). Environmental Justice: The Economics of Race, Place, and Pollution. Journal of Economic Perspectives, 33(1), 185–208. https://doi.org/10.1257/jep.33.1.185
Gellers, J. C., & Jeffords, C. (2018). Toward Environmental Democracy? Procedural Environmental Rights and Environmental Justice. Global Environmental Politics, 18(1), 99–121. https://doi.org/10.1162/GLEP_a_00445
Halkos, G.,& Zisiadou, A. (2017). Relating environmental performance with socioeconomic and cultural factors. Environmental Economics and Policy Studies, 20(1), 69–88. https://doi.org/10.1007/s10018-017-0182-9
McDonald, Y. J., & Jones, N. E. (2018). Drinking water violations and environmental justice in the United States, 2011-2015. American Journal of Public Health, (1971), 108(10), 1401–1407. https://doi.org/10.2105/ AJPH.2018.304621
Renteria, R., Grineski, S., Collins, T., Flores, A., & Trego, S. (2022). Social disparities in neighborhood heat in the Northeast United States. Environmental Research, 203, 111805. https://doi.org/10.1016/j.envres.2021.111805
Schwartz, N. A., von Glascoe, C. A., Torres, V., Ramos, L., & Soria- Delgado, C. (2015). “Where they (live, work and) spray”: Pesticide exposure, childhood asthma and environmental justice among Mexican-American farmworkers. Health & Place, 32, 83–92. https://doi.org/10.1016/j.healthplace.2014.12.016
Sullivan, A., & White, D. D. (2019). An Assessment of Public Perceptions of Climate Change Risk in Three Western U.S. Cities. Weather, Climate, and Society, 11(2), 449–463. https://doi.org/10.1175/WCAS-D-18-0068.1
Spina, F. (2015). Environmental Justice and Patterns of State Inspections. Social Science Quarterly, 96(2), 417–429. https://doi.org/10.1111/ssqu.12160
Swope, C. B., Hernández, D., & Cushing, L. J. (2022). The Relationship of Historical Redlining with Present-Day Neighborhood Environmental and Health Outcomes: AScoping Review and Conceptual Model. Journal of Urban Health, 99(6), 959–983. https://doi.org/10.1007/ s11524-022-00665-z
Wiedenhofer, D., Lenzen, M., & Steinberger, J. K. (2013). Energy requirements of consumption: Urban form, climatic and socio-economic factors, rebounds and their policy implications. Energy Policy, 63, 696–707. https://doi.org/10.1016/ j.enpol.2013.07.035
