John and Marcia Price College of Engineering
18 Signal Processor for Electrogram and Electroanatomic Data (SPEED)
Rui Jin; Rob MacLeod; Lindsay Rupp; and Anna Busatto
Faculty Mentor: Rob S. MacLeod (Biomedical Engineering, University of Utah)
Introduction
The electrocardiogram is the most commonly used tool to diagnose and assess cardiac conditions, such as rhythm abnormalities, myocardial ischemia, and heart failure. However, clinical diagnosis and management of abnormal cardiac activity are challenging due to the remote nature of body-surface electrocardiogram measurements, with a median accuracy of 67% among physicians [1]. One approach to improve the understanding and accuracy of electrocardiographic studies is to conduct mapping studies, in which 10-100 catheter-based electrodes are placed carefully inside the blood pools of the heart, typically accessed from the femoral vein. The recorded signals, being of closer proximity, have higher amplitude and spatial resolution than the ECG, but they also require specialized software to be analyzed, quantified, and visualized. We developed the Signal Processor for Electrogram and Electroanatomic Data (SPEED), a new, open-source, unified pipeline to facilitate effective signal processing and visualization of cardiac-mapping signals.
Methods
Our pipeline is based on three existing toolboxes: the Preprocessing Framework for Electrograms Intermittently Fiducialized from Experimental Recordings (PFEIFER), OpenEP, and map3d [2, 3, 4]. PFEIFER is a toolset for sophisticated signal-processing of cardiac electrograms that allows the user to select semi-automatically fiducial markers, which are time points and intervals of interest within a heartbeat [2]. OpenEP primarily accepts as input complete electroanatomic data, including both processed cardiac electrograms and spatial geometry; OpenEP provides built-in functions for analyzing and visualizing cardiac electrograms, such as displaying potentials on the cardiac geometry [3]. Finally, map3d is a toolset designed to provide flexible and user-interactive visualizations of time signals distributed on surfaces [4]. Since the software packages are all open-source and provide complementary workflows for managing electrograms, our goal was to integrate the three software packages and present them to the user through a new graphical user interface (GUI) that utilizes all three applications simultaneously.
Results
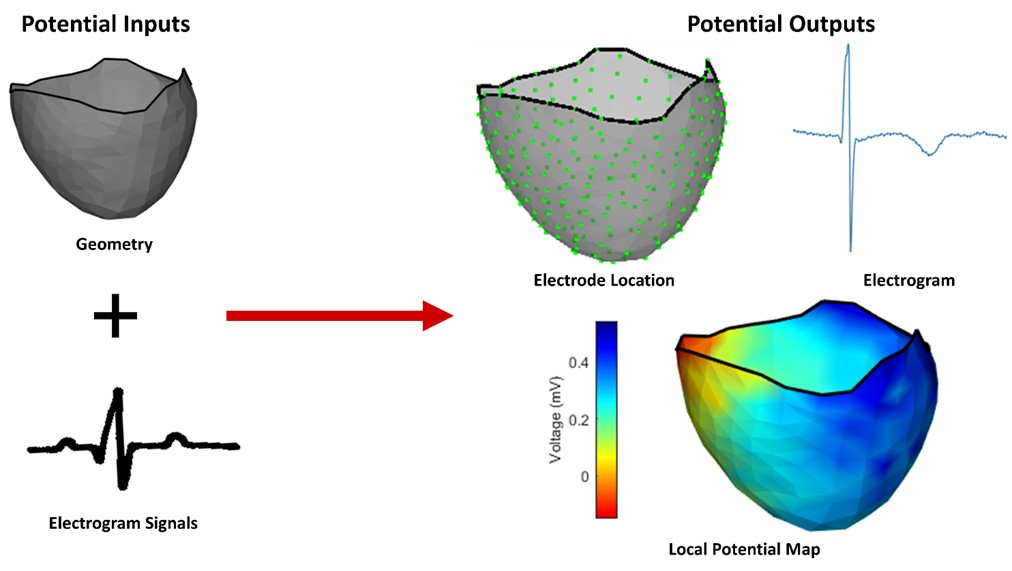
We developed SPEED in MATLAB, as all three toolboxes are developed or easily interface with MATLAB. The primary interface to SPEED incorporates a data-centric design such that the user can provide the electrogram and geometry files to be processed, and the algorithm automatically determines the applicable functions based on the input type (Figure 1). Since the software packages can parse data into more interpretable open-source formats, the user can also export the processed data for further analysis, as well as visualize and quantify the data features.

Figure 1:
The sample pipeline created by SPEED. The user can provide electrogram signals and/or geometry as the input(s) and the algorithm can determine the applicable functions based on the format and the content. Sample functions include visualizing the electrode location, displaying the electrograms, and mapping the local potentials to the surfaces described by the geometry.
Discussion
SPEED offers the user a more thorough and unified workflow for analyzing cardiac-mapping signals compared to any of its components. PFEIFER, OpenEP, and map3d functionalities can be utilized simultaneously, allowing for a versatile and powerful processing pipeline. For instance, the user can extract key features from the recorded electrograms and visualize the location of the corresponding electrodes, a previously unavailable feature. In addition, the open-source nature of the software packages allows the user to modify or expand the functions to suit their individual needs. The software design of SPEED is still in the early stages; thus, as with most software, further development and user testing will follow to make the algorithms compatible with more data types and implement additional features.
Conclusion
SPEED processes and displays complex information in a clear and accessible way, allowing the user to perform subsequent interpretations and analyses more easily. Through integrating the software packages, SPEED supports the following functionalities: (1) in-depth filtering and processing of electrogram signals, (2) visualizing anatomic geometry and electrode locations, and (3) mapping three-dimensional potentials and activation times of cardiac electrophysiology. The goal of SPEED is to help scientists and cardiologists achieve a more efficient workflow, as well as to improve the efficiency and accuracy of clinical diagnosis of heart diseases in the future.
References
1] D. A. Cook, S.-Y. Oh, and M. v. Pusic. (2020). Accuracy of Physicians’ Electrocardiogram Interpretations. JAMAIntern. Med. [Online]. 180(11), pp. 1461–1471. Available: https://doi.org/10.1001/jamainternmed.2020.3989. [Access Date]: 11/04/2023.
[2] Rodenhauser, et al. (2018). PFEIFER: Preprocessing Framework for Electrograms Intermittently Fiducializedfrom Experimental Recordings. J. Open Source Softw. [Online]. 3(21), pp. 472 Available: https://doi.org/10.21105/joss.00472. [Access Date]: 11/04/2023.
[3] E. Williams, et al. (2021). OpenEP: A Cross-Platform Electroanatomic Mapping Data Format and Analysis Platform for Electrophysiology Research. Front. Physiol. [Online]. 12, pp. 646023. Available: https://doi.org/10.3389/fphys.2021.646023. [Access Date]: 11/04/2023.
[4] S. MacLeod and C. R. Johnson. (1993). Map3d: interactive scientific visualization for bioengineering data. Proc. 15th Annu. Int. Conf. IEEE Eng. Med. Biol. Soc. [Online]. 15(1), pp. 30–31, Available: https://doi.org/10.1109/IEMBS.1993.978414. [Access Date]: 11/04/2023.

