19 VOC, VSM, SIPOC
TOOLS FOR IDENTIFYING AND ELIMINATING OVERPROCESSING WASTE
Identifying and eliminating waste requires more than a surface-level understanding of workflows. While basic process mapping or flowcharting can outline the steps in a process, tools like Voice of the Customer (VOC), Value Stream Mapping (VSM), and SIPOC diagrams go deeper. These tools not only help organizations visualize workflows but also drive alignment between processes and customer needs, ensuring that unnecessary or redundant tasks are eliminated.
Each tool offers a unique approach to reducing waste, particularly overprocessing, by addressing key inefficiencies:
- Voice of the Customer (VOC) pinpoints tasks or processes that fail to align with customer expectations, helping organizations focus on what truly adds value.
- Value Stream Mapping (VSM) highlights steps in the value chain that are redundant or non-value-adding, providing a detailed view of inefficiencies.
- SIPOC diagrams ensure that inputs and outputs are aligned with customer needs, avoiding over-engineering and unnecessary complexity.
These tools allow teams to analyze inefficiencies at multiple levels—whether through understanding customer priorities, examining detailed workflows, or summarizing the big picture of a process. By using VOC, VSM, and SIPOC, organizations can identify and eliminate overprocessing waste more effectively, paving the way for smoother workflows, reduced lead times, and improved customer satisfaction.
Voice of the Customer (VOC)
The Voice of the Customer (VOC) is a systematic approach to gathering and understanding customer needs, expectations, and preferences. Overprocessing often stems from a misalignment between what customers value and what organizations deliver. VOC helps bridge this gap by ensuring that processes and outputs are designed to meet actual customer expectations, rather than assumptions or excessive quality standards.
Steps for Conducting VOC
-
Identify the Customers
VOC begins with identifying all the relevant customers for the process or product being analyzed. This includes both external customers (end-users, clients) and internal customers (downstream teams or departments).
- What to Do:
- Write down who benefits from the process or product.
- Differentiate between primary customers (e.g., external buyers) and secondary customers (e.g., internal users like a sales team).
- For example, in a manufacturing process, external customers might be the consumers purchasing the product, while internal customers could be the assembly line workers who rely on earlier production stages.
-
Define the Objectives
Determine what questions you are trying to answer through VOC analysis. Focus on understanding customer expectations, pain points, and areas where processes may exceed or fall short of their needs.
- What to Do:
- Ask: What do we want to learn from our customers?
- Define specific areas to explore, such as product quality, delivery speed, usability, or service features.
- For example, Are we providing features customers don’t value? Are we meeting the quality level they expect without over-engineering?
-
Gather Customer Feedback
To capture the “voice” of the customer, organizations must engage their customers directly using various data collection methods. The goal is to gather insights into what customers value in simple, actionable terms.
- What to Do:
- Use quantitative methods, such as surveys or questionnaires, to capture measurable data on customer preferences (e.g., satisfaction ratings, feature importance).
- Use qualitative methods, such as interviews, focus groups, or direct observation, to capture deeper insights into customer expectations and frustrations.
- Collect data from both actual customers and internal stakeholders who represent customer needs.
- Example Questions to Ask:
- What features or outcomes are most important to you?
- What challenges do you face when using this product/service?
- Are there aspects of the product/service that do not add value for you?
-
Analyze the Feedback
Once feedback is gathered, it must be organized and analyzed to identify key themes, trends, and gaps between customer expectations and current processes.
- What to Do:
- Categorize feedback into themes, such as quality, speed, cost, or usability.
- Look for gaps where customer needs are unmet or where processes exceed expectations (e.g., overprocessing).
- Use tools like Affinity Diagrams to group similar feedback or Pareto Analysis to identify which issues have the greatest impact.
- Key Insight:
- Focus on identifying tasks or steps that customers find unnecessary or excessive. For example, customers may indicate that they don’t value premium packaging if it doesn’t improve the product itself.
-
Prioritize Customer Needs
Not all customer feedback will be equally important. The next step is to prioritize the insights based on their impact on customer satisfaction and business outcomes.
- What to Do:
- Use tools like a Kano Model to classify feedback into categories:
- Must-haves: Critical features or outcomes the customer expects.
- Performance features: Elements that improve satisfaction as they are enhanced.
- Delighters: Unexpected features that exceed expectations but are not essential.
- Focus on eliminating overprocessing in areas that are not must-haves or performance features.
- Use tools like a Kano Model to classify feedback into categories:
When analyzing feedback, delighters—unexpected features that exceed customer expectations but are not essential—should be handled carefully. While they can create positive impressions, they often come with costs that may contribute to overprocessing.
- What to Do:
- Evaluate the effort and resources required to deliver these delighters. If they significantly increase complexity or costs without aligning with core customer needs, consider scaling them back or eliminating them.
- Retain delighters if they provide a competitive advantage or align with strategic goals, but ensure they do not detract from delivering on must-haves and performance features.
For example, while premium packaging might impress customers, if it doesn’t contribute to core value and adds unnecessary costs, it could be simplified without impacting satisfaction.
-
Align Processes with Customer Needs
Finally, use the insights from the VOC analysis to adjust processes and ensure they align with customer expectations. This is where overprocessing is addressed directly.
- What to Do:
- Map the current process and identify steps that do not directly contribute to what customers value.
- Eliminate unnecessary steps, reduce excessive quality standards, or simplify workflows to align with customer needs.
- Test changes with customers to ensure the revised process meets their expectations.
- Example:
- If customers indicate they value timely delivery more than additional product features, reduce time spent on over-engineering and reallocate resources to improve delivery speed.
Value Stream Mapping
Value Stream Mapping (VSM) is a structured visual tool used to analyze and optimize the flow of materials and information through a process. To help students create their own Value Stream Maps, it’s important to understand the typical components, their shapes, and their meanings. Each element of a VSM provides critical insights into the process, helping to distinguish between value-added and non-value-added activities.
Typical Components of a Value Stream Map
Process Steps
-
- Shape: Rectangle
- Meaning: Represents each discrete step or activity in the process, such as assembling parts, reviewing a document, or delivering a service.
- Details to Include:
- A brief description of the step (e.g., “Assemble Component A” or “Approve Application”).
- Time metrics, such as cycle time (time to complete one unit) or lead time (total time from start to finish).
- Tip: Use one rectangle for each step in the process. Ensure every step is documented, including potential bottlenecks or delays.
Material Flow
-
- Shape: Straight arrow (solid line)
- Meaning: Shows the physical movement of materials or products between process steps.
- Details to Include:
- The direction of flow (e.g., materials moving from one workstation to the next).
- Any areas where materials are delayed or waiting (e.g., in storage or inventory).
Information Flow
-
- Shape: Dashed or zig-zag arrow
- Meaning: Represents the flow of communication or information required to complete the process. This could include approvals, instructions, or data transfers.
- Details to Include:
- Source and destination of information (e.g., “Manager Approval Sent to Team”).
- Types of communication (e.g., emails, phone calls, software systems).
Inventory or Work-in-Process (WIP)
-
- Shape: Triangle
- Meaning: Indicates where materials, products, or tasks are waiting between process steps. These are often bottlenecks or areas that contribute to overprocessing.
- Details to Include:
- The number of items or tasks in inventory (e.g., 50 units waiting for assembly).
- Time spent in inventory or WIP before moving to the next step.
Timeline
The timeline in a Value Stream Map can be visualized as a value ladder or Lead Time ladder, where each “rung” represents the activities in the process and their contribution to value. This helps clearly distinguish between value-added time (steps that directly contribute to what the customer values) and non-value-added time (delays, waiting, or unnecessary tasks).
Value Ladder Concept
- Upper Rungs: Represent non-value-added activities, such as waiting for approvals, inventory storage, or redundant inspections. These rungs do not contribute to customer value but add to the total time and cost of the process.
- Lower Rung: Represents the value added time component of the lead time.
Customer Requirements
-
- Shape: Box or cloud at the far right
- Meaning: Represents the final output of the process and what the customer expects. This could include product specifications, service levels, or delivery timelines.
- Details to Include:
- Customer demand rate (e.g., “500 units per day”).
- Quality expectations (e.g., “99% defect-free”).
Suppliers
-
- Shape: Box or cloud at the far left
- Meaning: Represents the sources of inputs needed to start the process. These could be external vendors or internal departments.
- Details to Include:
- Key materials or resources provided by the supplier.
- Delivery frequency or conditions (e.g., “Weekly shipment of raw materials”).
How the Components Work Together
When creating a VSM, these components are arranged in a logical flow, starting with suppliers on the far left and ending with customer requirements on the far right. Each process step, connected by material and information flows, is analyzed to identify inefficiencies, delays, and non-value-added activities.
For example:
- A rectangle (“Assemble Component A”) might connect to a triangle (inventory of 30 units), followed by another rectangle (“Inspect Component A”). If the inspection step adds no value to the customer but slows down the flow, it could be flagged as overprocessing.
Analyze the Map:
-
- Identify delays, redundancies, or bottlenecks (e.g., too much time spent waiting for the coffee to brew).
- Suggest improvements, such as reducing batch sizes or eliminating unnecessary steps.
SIPOC Diagram
A SIPOC (Suppliers, Inputs, Process, Outputs, Customers) diagram provides a high-level view of a process, summarizing its key components and their relationships. This tool is particularly useful for identifying areas where overprocessing may occur by clarifying what is required at each stage and aligning outputs with customer expectations.
Purpose of SIPOC
SIPOC helps organizations:
- Understand the “big picture” of a process.
- Identify misalignments between inputs, processes, and outputs.
- Pinpoint non-value-added activities that contribute to overprocessing.
Steps to Create a SIPOC Diagram
- Define the Process
- Identify the process you want to analyze. Clearly define its start and end points. For example, the process could be “order fulfillment” or “designing a new product.”
- List the Components of SIPOC
- Suppliers: Identify who provides the inputs to the process (e.g., vendors, internal teams).
- Inputs: List the raw materials, information, or resources needed to complete the process.
- Process: Outline the major steps in the process at a high level (typically 5-7 steps).
- Outputs: Define the deliverables or outcomes of the process (e.g., finished products, reports).
- Customers: Identify the recipients of the outputs (internal or external).
- Analyze and Align
- Review the SIPOC diagram to identify areas of misalignment or inefficiency. For example, are suppliers providing inputs that exceed what is necessary? Are process steps adding complexity without contributing to the outputs customers value?
Visual Representation
A SIPOC diagram is typically presented as a table or flowchart with columns for each component (Suppliers, Inputs, Process, Outputs, Customers).
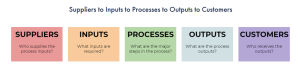
Image source: https://www.bobstanke.com/blog/six-sigma-sipoc-diagrams-for-marketing
Integrating the Tools
While each tool—VOC, VSM, and SIPOC—has its own strengths, they are most effective when used together. VOC ensures that processes are customer-focused, VSM provides a detailed view of workflows to identify inefficiencies, and SIPOC offers a high-level summary for alignment across the supply chain. By integrating these tools, organizations can develop a comprehensive strategy for identifying and eliminating overprocessing waste.
Conclusion
Tools like VOC, VSM, and SIPOC are critical for identifying and eliminating overprocessing waste. They provide structured, visual methods for analyzing processes, aligning them with customer needs, and streamlining workflows. By applying these tools, organizations can not only reduce overprocessing but also improve overall operational efficiency and customer satisfaction.
Discussion Questions
- How does overprocessing differ from other forms of waste, and why is it harder to identify?
- How can VOC help identify tasks that don’t align with customer needs?
- What role does VSM play in visualizing inefficiencies and overprocessing?
- How does a SIPOC diagram provide clarity in aligning processes with customer needs?
- How can VOC, VSM, and SIPOC be used together to address overprocessing?
Self-Assessment Questions
- Can you identify value-added vs. non-value-added tasks in your organization’s workflows?
- Are there redundant steps in your processes that could be eliminated?
- How would you use VOC to better understand customer priorities?
- Have you used SIPOC or VSM before? If so, did they help reduce inefficiencies?
- What is one example of overprocessing in your organization, and how would you address it?
Media Attributions
- Screenshot 2025-08-06 135132