23 Kaizen TQM SPC
Quality Management Systems: A Comprehensive Guide
Quality management has evolved significantly since the industrial revolution, incorporating various philosophies and methodologies from around the world. This guide explores the major quality management systems, their practical applications, and their impact on modern business operations.
Understanding Kaizen Philosophy
Historical Context and Development
Kaizen emerged from the ashes of post-World War II Japan as a revolutionary approach to business management and continuous improvement. During Japan’s reconstruction period, Toyota Motor Corporation pioneered many of the fundamental principles that would become known as Kaizen. This development was significantly influenced by W. Edwards Deming, an American quality management expert who worked extensively with Japanese manufacturers. Deming’s teachings on statistical quality control and systematic improvement methodology became cornerstone elements of the Kaizen philosophy.
The Essence of Kaizen
The word “Kaizen” combines two Japanese terms: “Kai” (change) and “Zen” (good), literally meaning “change for the better” or “continuous improvement.” Unlike traditional Western approaches that often focused on breakthrough innovations, Kaizen emphasizes the power of small, incremental improvements made consistently over time. This philosophy rests on the belief that everything can be improved, and that small changes, when accumulated, lead to substantial results.
Key Principles and Implementation
At its core, Kaizen operates on the principle that small, daily improvements, consistently applied, create significant long-term benefits. The philosophy maintains that every process, no matter how well it performs, contains waste and opportunities for improvement. These improvements don’t require massive investments or groundbreaking innovations; instead, they rely on the collective wisdom and daily efforts of all employees.
The Five Fundamental Elements
Kaizen’s success relies on five fundamental elements that work together to create a comprehensive improvement system:
- Teamwork: Kaizen emphasizes collaborative effort across all levels of an organization. This includes cross-functional teams, quality circles, and group problem-solving sessions. The philosophy maintains that the best improvements come from those closest to the work.
- Personal Discipline: Individual commitment to improvement is essential. This includes maintaining standards, following procedures, and consistently looking for ways to enhance one’s work.
- Improved Morale: Kaizen creates a positive work environment by involving employees in meaningful improvements. When workers see their suggestions implemented and their efforts recognized, it leads to increased job satisfaction and engagement.
- Quality Circles: These are small groups of employees who meet regularly to discuss quality issues and propose solutions. Quality circles serve as a formal structure for implementing Kaizen principles and fostering employee involvement.
- Suggestion Systems: A robust suggestion system allows all employees to contribute improvement ideas. Effective systems include prompt evaluation of suggestions, quick implementation of viable ideas, and recognition for valuable contributions.
Daily Practice and Implementation
In practice, Kaizen manifests through daily activities where employees at all levels engage in identifying and implementing improvements. This might involve:
- Regular team meetings to discuss potential improvements
- Standardized processes for submitting and evaluating suggestions
- Rapid implementation of approved improvements (often called “Kaizen Events”)
- Documentation and sharing of successful changes
- Recognition and celebration of improvements, regardless of size
The power of Kaizen lies not in any single dramatic change but in the cumulative effect of countless small improvements made consistently over time. This approach creates a sustainable culture of continuous improvement that becomes embedded in the organization’s DNA.
Total Quality Management (TQM)
Historical Development and Evolution
Total Quality Management emerged as a comprehensive management approach in the 1950s, though it didn’t gain widespread recognition until the 1980s. This evolution was shaped by several quality management pioneers who revolutionized how organizations approach quality. W. Edwards Deming introduced statistical quality control methods and his famous 14 points for management. Joseph Juran emphasized the importance of top management involvement and the Pareto principle in quality improvement. Philip Crosby promoted the concept of “zero defects” and the idea that quality is free when done right the first time.
Core Principles and Framework
Customer-Centric Focus
At the heart of TQM lies an unwavering focus on customer satisfaction. This extends beyond traditional external customer relationships to include internal customers within the organization. Organizations implementing TQM develop sophisticated systems to capture and integrate the Voice of Customer (VOC) into their decision-making processes. This involves systematic collection and analysis of customer feedback, regular market research, and the development of customer-driven specifications. The goal is to not just meet customer expectations but to anticipate and exceed them.
Employee Engagement and Empowerment
TQM recognizes that quality improvement cannot be achieved without the active participation of every employee. This principle manifests through several key initiatives:
- Quality circles bring together employees to identify, analyze, and solve work-related problems
- Cross-functional teams ensure diverse perspectives in problem-solving and improvement efforts
- Comprehensive training programs develop both technical and soft skills
- Suggestion systems provide formal channels for improvement ideas
- Empowerment programs give employees authority to make decisions affecting their work
Process-Centered Management
TQM adopts a process view of organizations, recognizing that quality products and services result from quality processes. This approach involves:
- Systematic process mapping to understand workflow and identify improvement opportunities
- Continuous process optimization through data analysis and improvement methodologies
- Development and maintenance of detailed Standard Operating Procedures (SOPs)
- Comprehensive process documentation to ensure consistency and facilitate training
Integrated Systems Approach
Rather than treating quality as a separate function, TQM integrates quality management into every aspect of organizational operations. This integration includes:
- Strategic planning that incorporates quality objectives
- Data-driven decision making at all levels of the organization
- Development and implementation of comprehensive quality policies
- Establishment of meaningful performance metrics that align with organizational goals
Implementation and Practice
Successful TQM implementation requires a systematic approach that addresses all core elements simultaneously. Organizations typically begin by:
- Establishing strong leadership commitment
- Developing a clear implementation plan
- Creating appropriate organizational structures
- Providing necessary resources and training
- Implementing measurement systems
- Fostering a quality-focused culture
The effectiveness of TQM depends on the organization’s ability to maintain a holistic view while addressing specific quality issues. Success requires consistent leadership support, employee engagement, and a long-term commitment to continuous improvement.
Statistical Process Control (SPC)
Statistical Process Control represents a sophisticated method of quality management that relies on statistical principles to monitor and control processes. At its core, SPC is built upon the fundamental principles of normal distribution and statistical analysis, providing a scientific approach to process improvement and control.
Statistical Process Control provides a powerful visual management system through control charts, which plot process data over time alongside statistically calculated control limits. These charts serve as an early warning system, enabling managers to distinguish between normal process variation and significant deviations that require attention. By plotting measurements and calculating upper and lower control limits based on the process’s natural variation, control charts create a clear visual signal when a process strays from its expected behavior. This graphical representation transforms complex statistical concepts into an intuitive tool, allowing managers to make quick, data-driven decisions about when to investigate and adjust their processes, and when to leave them alone.
The Nature of Variation
All processes contain variation. Whether manufacturing parts, providing services, or executing administrative tasks, no two outputs are ever exactly the same. Understanding this variation and its sources is fundamental to effective process control and improvement.
Common Cause Variation
Common cause variation represents the natural rhythm of a process – the inherent fluctuations that occur even when everything is working as designed. Think of it as similar to human breathing: while each breath might be slightly different in depth or duration, these differences follow a natural, predictable pattern.
In manufacturing, common cause variation might manifest as minute differences in product dimensions due to normal tool wear, slight temperature fluctuations, or minor variations in raw material properties. These variations remain stable and predictable over time, falling within expected limits. They are built into the very fabric of the process, resulting from countless small factors interacting in random ways.
What makes common cause variation particularly important is its predictability. While we cannot eliminate it entirely, we can measure and understand it. This understanding allows us to set realistic expectations for process performance and establish meaningful control limits. When only common cause variation is present, the process is said to be “in statistical control” – stable and predictable, though not necessarily meeting all specifications.
Special Cause Variation
Special cause variation, in contrast, represents disruptions to the normal process flow. These are unexpected changes that signal something has fundamentally shifted in the process. Returning to our breathing analogy, special cause variation would be like suddenly gasping for air after running up stairs – a clear departure from normal breathing patterns.
These variations might arise from equipment malfunctions, significant material changes, operator errors, or environmental disruptions. Unlike common cause variation, special cause variation creates unpredictable patterns that fall outside normal expectations. When special causes appear, the process becomes unstable and unpredictable, requiring immediate investigation and corrective action.
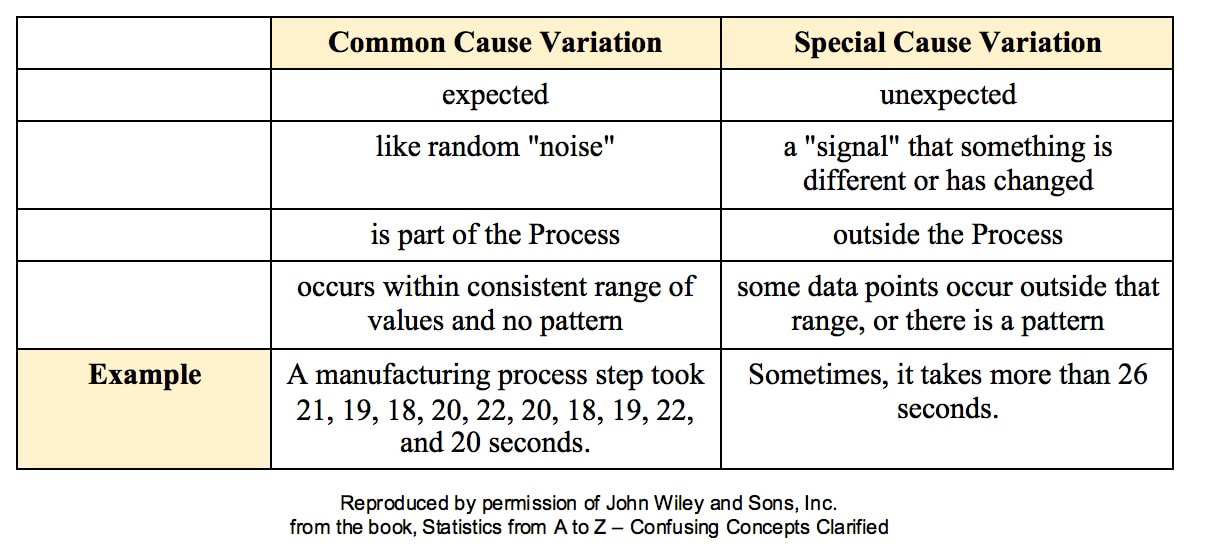
Source: https://www.statisticsfromatoz.com/blog/statistics-tip-common-cause-vs-special-cause-variation
The Management Challenge
Understanding whether variation stems from common or special causes fundamentally shapes our management approach. Treating common cause variation as if it were special cause variation (or vice versa) can actually make processes worse. This mistake, which Dr. W. Edwards Deming called “tampering,” often leads to unnecessary process adjustments that increase rather than decrease variation.
For common cause variation, improvement requires fundamental changes to the process itself – perhaps redesigning equipment, updating procedures, or investing in new technology. These changes take time and resources but lead to lasting improvements in process capability.
Special cause variation, however, demands immediate investigation and correction. The goal is to identify and eliminate the unusual disturbance, returning the process to its stable state. This might involve fixing broken equipment, retraining operators, or addressing environmental factors that have changed.
Impact on Process Control
This understanding of variation forms the foundation for statistical process control. Control charts, the primary tools of SPC, help distinguish between these two types of variation. By establishing statistically valid control limits based on common cause variation, we can quickly identify when special causes emerge.
The art of process management lies in correctly identifying the type of variation present and responding appropriately. This requires not just statistical knowledge, but also deep process understanding and careful judgment. Success comes from developing this understanding and applying it consistently in daily operations.
Statistical Foundations in SPC: The Normal Distribution and Central Limit Theorem
Ultimately, SPC relies on sampling inspection of process measurements. Sampling is a statistical term that refers to examining a small, representative portion of a larger population to draw conclusions about the whole. Rather than inspecting every single item or measurement (which would be time-consuming and often impractical), SPC uses carefully selected samples taken at regular intervals to monitor process performance.
The foundation of SPC rests on fundamental statistical principles, particularly the normal distribution and the Central Limit Theorem. The normal distribution, characterized by its symmetric bell-shaped curve, describes many natural phenomena and manufacturing processes. However, its real power in SPC comes from the Central Limit Theorem (CLT), which explains why we can rely on normal distribution principles even when individual measurements aren’t normally distributed.
The Central Limit Theorem Explained
The Central Limit Theorem states that when we take sufficiently large samples from any population, regardless of its underlying distribution, the distribution of sample means will approximate a normal distribution. This remarkable property has several important implications for SPC:
- Sample means will be normally distributed even if individual measurements follow different patterns (exponential, uniform, or other distributions)
- The larger the sample size, the closer the sampling distribution approaches normality
- Generally, samples of size 30 or more are sufficient for the CLT to take effect, though smaller samples often work well
- The standard deviation of sample means (standard error) decreases as sample size increases, following the relationship σx̄ = σ/√n
Practical Applications in Process Control
This theoretical foundation has profound practical implications for SPC:
- Subgrouping Strategy
- When we collect samples in rational subgroups, their averages will be normally distributed
- This allows us to use normal distribution-based control limits with confidence
- The variation between subgroup averages becomes more predictable and easier to interpret
- Control Limit Calculation
- The 3-sigma limits used in control charts are based on normal distribution properties
- Approximately 99.73% of sample means will fall within ±3 standard deviations of the center line
- This provides a reliable basis for detecting special cause variation
Control Chart Implementation and Analysis
Control charts form the backbone of Statistical Process Control, transforming raw data into actionable insights. Each control chart tells a story about process behavior through a carefully structured visual display. At its heart, every control chart shares common elements:
- – a central line representing the process average,
- – control limits defining the boundaries of acceptable variation, and
- – chronologically plotted data points that reveal process behavior over time.
Variables vs. Attributes Charts
The selection of an appropriate control chart depends primarily on the nature of the data being measured. Variables charts handle continuous measurements – things we can measure on a continuous scale like length, weight, or temperature. The most commonly used variables charts are:
X̄-R charts (Average and Range charts) serve as the workhouse of process control, particularly useful when sampling multiple items at regular intervals. The X̄ portion tracks the sample averages, while the R chart monitors process variability through ranges. This dual-chart system provides a comprehensive view of both process center and spread.
X̄-S charts function similarly but use standard deviation instead of range to measure variability. These charts prove particularly valuable for larger sample sizes where standard deviation provides a more sensitive measure of variation than range.
Individual-Moving Range (I-MR) charts address situations where taking multiple measurements isn’t practical or possible. These charts plot individual measurements and their moving ranges, making them ideal for processes with long cycle times or destructive testing.
Attributes charts, on the other hand, handle discrete data – counts of defects or classifications of items as good or bad. The primary types include:
P-charts monitor the proportion of defective items in varying sample sizes, making them highly adaptable to real-world situations where sample sizes fluctuate. NP-charts serve a similar purpose but work with constant sample sizes, tracking the actual number of defective items.
C-charts and U-charts focus on defect counts rather than defective items. C-charts track the total number of defects in constant-sized samples, while U-charts accommodate varying sample sizes by measuring defects per unit.
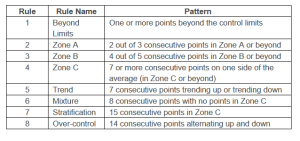
Pattern Recognition in Control Charts: Rules for Special Cause Variation
Control charts reveal process instability through specific patterns that statisticians and quality professionals have identified as reliable indicators of special cause variation. These patterns, often called “run rules” provide systematic criteria for identifying when a process needs investigation. Here are the primary rules that signal special cause variation:
Points Beyond Control Limits
The most obvious signal is any single point falling beyond the three-sigma control limits. This represents a significant deviation from expected process behavior, with only a 0.27% chance of occurring naturally in a stable process. Such points demand immediate investigation, as they clearly indicate a substantial process disruption.
Zone Rules
Control charts are typically divided into zones, each representing one standard deviation:
- Zone A: Between 2 and 3 sigma from centerline
- Zone B: Between 1 and 2 sigma from centerline
- Zone C: Within 1 sigma of centerline
Special cause patterns emerge when points show unusual behavior within these zones:
- Two out of three consecutive points in Zone A indicates process instability
- Four out of five consecutive points in Zone B or beyond suggests a significant shift
- Eight consecutive points on one side of the centerline indicates a process shift

Source: https://www.spcforexcel.com/knowledge/control-chart-basics/control-chart-rules-interpretation/
Trend Patterns
Several trend-based rules signal special cause variation:
- Six or more points in a row steadily increasing or decreasing
- Fourteen or more points alternating up and down
- Fifteen consecutive points within Zone C (indicating abnormally low variation)
- Eight consecutive points outside Zone C (showing excessive variation)
Source: https://www.spcforexcel.com/knowledge/control-chart-basics/control-chart-rules-interpretation/
Cyclic Patterns
Regular oscillations or cycles in the data often indicate systematic issues:
- Alternating high and low patterns might suggest machine wear
- Regular cycles could indicate shift changes or environmental factors
- Predictable patterns occurring at fixed intervals warrant investigation
The 7 Quality Tools
The seven basic tools of quality form a fundamental set of visual techniques for process analysis and problem-solving. While each has specific applications, they work together to provide a comprehensive approach to quality improvement.
Overview of the Tools
- Cause-and-Effect (Fishbone) Diagrams
Create systematic views of potential problem causes, typically organized around the 6M categories: Man, Machine, Method, Material, Measurement, and Mother Nature (Environment). These diagrams excel at organizing brainstorming sessions and linking causes to effects. - Check Sheets
Provide structured forms for data collection, making it easy to gather and organize information about process problems. Whether tracking defect locations or types, they ensure consistent data collection for further analysis. - Control Charts
Monitor processes over time to distinguish between common and special cause variation. We’ve covered these extensively in previous sections. - Histograms
Display frequency distributions of data, showing patterns and spread of measurements. Their shapes can reveal important process characteristics and potential improvement opportunities. - Pareto Charts
Apply the 80/20 principle to identify the “vital few” causes responsible for most problems. These charts help prioritize improvement efforts by focusing on the most significant issues first. - Scatter Diagrams
Explore relationships between variables, helping identify potential correlations. These simple x-y plots can reveal patterns that suggest cause-and-effect relationships. - Flowcharts
Map processes step by step, making it easier to understand workflows and identify improvement opportunities. Different types serve different purposes, from basic process documentation to detailed cross-functional analysis.
Conclusion
Quality management systems have evolved into sophisticated frameworks that combine statistical rigor with practical implementation strategies. Through this comprehensive examination of major quality management approaches – from Kaizen’s continuous improvement philosophy to TQM’s holistic organizational perspective and SPC’s statistical foundations – several key themes emerge.
First, successful quality management requires a balanced integration of technical and human elements. While statistical tools and methodologies provide the analytical framework, the human aspects – employee engagement, leadership commitment, and cultural transformation – are equally crucial for successful implementation.
Second, the evolution of quality management systems demonstrates a shift from reactive inspection-based approaches to proactive, prevention-focused strategies. Modern quality systems emphasize process control and improvement rather than product inspection, recognizing that quality must be built into processes rather than inspected into products.
Third, the complementary nature of different quality management approaches suggests that organizations need not commit exclusively to a single system. Rather, they can selectively adopt elements from various approaches to create a customized quality management framework that aligns with their specific needs and objectives.
Media Attributions
- Screenshot 2025-08-18 085736