9 Kaoru Ishikawa
Quality Circles, Cause and Effect Diagram, Seven Basic Quality Tools
Jonathan Ebbeler and Rick Hardcopf
Kaoru Ishikawa (1915 – 1989)
The year 1962 had many milestones; USA astronaut John Glenn orbited the earth, the first James Bond film was released, the ANC’s Nelson Mandela was arrested, the Cuban missile crisis occurred, and the Beatle’s first record “Live Me Do” was released. It was also the year Dr. Kaoru Ishikawa’s Quality Control Circles were formalized by the Japanese Union of Scientists and Engineers (JUSE). Dr. Ishikawa is known as the Father of Japanese Quality due to his significant contributions to quality control, process improvement, and operations management.
Kaoru Ishikawa was born in Tokyo, Japan, on July 13, 1915. He developed an early interest in mathematics and engineering, which he pursued passionately throughout his life. He earned a Master’s degree in applied chemistry in 1939 and a doctorate in mechanical engineering in 1960, both from the University of Tokyo.
Ishikawa’s career began with the Navy in 1939, where he worked as a naval technical officer until 1941. From 1941 to 1947, he worked with the Nissan Liquid Fuel Company. It was at Nissan that he developed his renowned Cause and Effect diagram in 1945. Also known as the fishbone diagram or Ishikawa diagram, the Cause and Effect diagram proved to be a valuable tool for identifying the root cause of problems. During this time, Dr. Ishikawa also gained experience in production and quality control, which would later form the basis of his work in Total Quality Control (TQC) and Quality Control Circles (QCC).
In 1946, he joined the Japanese Union of Scientists and Engineers (JUSE) to concentrate on quality control research. In 1947, Ishikawa became a Professor at the University of Tokyo, where he focused on statistical quality control. In 1960, Ishikawa became the director of JUSE, where he continued his work in quality control and TQC. He also established the Quality Control Research Group, which helped to popularize TQC and QCC methodologies throughout Japan and worldwide.
In his career, Dr. Ishikawa received numerous awards and honors for his contribution to the field of quality control, including the Deming Prize in 1952, the Grant Award in 1972, the Shewhart Medal in 1982, and the Japanese Order of the Sacred Treasure Second Class in 1988. He wrote five books on quality control which are still in publication and considered the basis of modern-day TQC. His legacy lives on through his enduring impact on businesses and organizations worldwide.
Cause and Effect Diagram (Ishikawa or Fishbone Diagram)
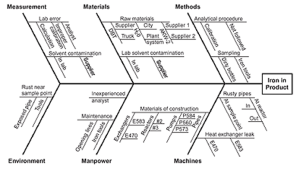
The Cause and Effect diagram, also known as the fishbone diagram or Ishikawa diagram, is a visual tool used to identify the root causes of process problems. The diagram is shaped like a fishbone, with the head of the fish representing the problem or issue and the bones representing potential causes (see figure below). The diagram is created by first identifying the problem or issue and writing it at the head of the fishbone. Potential causes of the problem are then identified through brainstorming and written as the ‘bones of the fish’. To facilitate organized brainstorming, potential root causes are often grouped into major categories prior to the start of brainstorming, such as measurement, materials, methods, mother nature (environment), manpower, and machines (the 6 M’s).
The Ishikawa diagram is an essential tool in operations management for several reasons.
- It helps teams identify a problem’s root causes rather than simply addressing the symptoms. This can lead to more effective and longer-lasting solutions.
- The diagram encourages cross-functional collaboration and communication. By involving stakeholders from different areas of the organization in identifying and analyzing potential causes, teams can gain a more comprehensive understanding of the issue and develop solutions that are more likely to be successful.
- It is a valuable tool for continuous improvement efforts. By regularly analyzing processes and identifying potential causes of issues, organizations can continually improve their operations and reduce waste and defects over time.
Quality Control Circles
Quality control circles (a.k.a. quality circles) are autonomous groups of employees that do similar work and gather regularly to analyze and solve work-related problems. The groups are generally small (3 – 12 employees) and led by a supervisor. While solutions may be presented to management, when possible, workers implement solutions themselves. Quality circles empower employees to be responsible for the performance of the processes in which they work. In this way, they support one of the basic tenets of Total Quality Management (TQM). While quality circles were originally described by Dr. Edwards Deming in the 1950’s, they were popularized by Dr. Ishikawa and the term ‘quality circles’ was coined by Dr. Ishikawa in his book, “What is total Quality Control? The Japanese Way” (Ishikawa, 1985).
Seven Basic Tools
Dr. Ishikawa popularized the “7 Basic Quality Tools” to help workers of various technical backgrounds identify and solve problems. While the tools were developed by other quality experts (except for the fishbone diagram), Dr. Ishikawa popularized them as a set, significantly increasing their popularity and use. The tools are widely used in quality control and process improvement and have become a standard in many industries. The tools help to identify issues, prioritize areas for improvement, and monitor and control processes over time, leading to more efficient and effective operations and higher-quality products and services. The seven tools include:
- Flow Chart (Process Map): A flow chart is used to make the steps in a process visible, thereby facilitating the identification of problems which keep a process from performing better.
- Check Sheet (Data Tables): A check sheet is a simple data collection tool used to record and organize data in a structured manner. The check sheet helps to identify patterns and trends in data and can be used to track defects, errors, and other quality issues.
- Pareto Chart: A Pareto chart is a graphical representation of data that helps to identify the most significant factors affecting a process or product. According to Dr. Joseph Juran, it separates the ‘vital few’ elements that contribute to most problems or defects in a process from the ‘trivial many’ that contribute to only a small percentage of issues.
- Cause and Effect Diagram: Described previously.
- Histogram: A histogram is a graphical representation of data that shows the distribution of a process or product characteristic. It helps to visualize the data and identify patterns, such as whether it is normally distributed or skewed.
- Scatter Diagram: A scatter diagram is a graphical representation of data that shows the relationship between two variables. It is used to identify correlations between variables, such as whether an increase in one variable leads to an increase or decrease in another variable.
- Control Chart: A control chart is a tool used to monitor and control a process over time. It helps to track process performance and identify when a process is out of control or not meeting specifications.
The Big Ideas for Operations Management
Kaoru Ishikawa significant contributions earned him the title of “Father of Japanese Quality.” He is most known for the development of the cause and effect diagram, and the popularization of quality control circles (QCC) and the seven basic quality tools.
Sources
ASQ. (2023). The 7 Basic Quality Tools for Process Improvement. American Society for Quality. https://asq.org/quality-resources/seven-basic-quality-tools
Hessing, T. (2023). Kaoru Ishikawa. 6σstudyguide.Com. https://sixsigmastudyguide.com/kaoru-ishikawa/
History-biography. (2023). Kaoru Ishikawa. History-Biography. https://history-biography.com/kaoru-ishikawa/
Ishikawa, K. (1985). What is total quality control? The Japanese way. Prentice Hall.
Union of Japanese Scientists and Engineers. (2015). Kaoru Ishikawa, The Man and Quality Control. Union of Japanese Scientists and Engineers. http://www.juse.jp/ishikawa/e/man/