4 Information Literacy and Management
Laura K. Garner-Jones
Chapter 4 Overview
- Define information literacy
- Information disorders
- Information literacy and evidence-based practice in clinical decision-making
- Practical strategies for assessing source credibility
- Staying current in a rapidly evolving digital environment
- Information management
Introduction
In chapter 1, we reviewed the three informatics competencies that nurses must have to improve nursing practice and patient care, and provided an overview of the first competency, basic computer literacy. In this chapter, information literacy and information management competencies will be discussed.
The second informatics competency, information literacy, is defined as a set of skills that allow you to “recognize when information is needed and have the ability to locate, evaluate, and use effectively the needed information” (American Library Association, 2020). As nurses, we frequently need to be able to find information and resources to support our work and our patients. With practice, you can become more and more efficient at knowing where to look for answers.
Due to the rapid advancement of technology and medical knowledge, having information literacy competencies allows nurses to stay current with new technologies, treatments, and protocols, and ensures that the patients they care for receive the best possible care (Cho et al., 2018). In addition, information literacy helps nurses think critically, assessing the necessary data and information and making clinical decisions rapidly (Rafi et al., 2019). In fact, Malik et al. (2025) determined that nurses who had high information literacy skills were able to make better clinical decisions and were more satisfied in their roles.
Information is available in multiple formats, and ultimately, the patient’s well-being can depend on the accuracy of health information. Therefore, nurses must be able to differentiate where to go and have evaluation skills to determine appropriate online health resources and share their expertise in assessing and evaluating the content, specifically with the patient populations that they serve.
Information Disorders
Watch this short video that describes the differences between misinformation, disinformation, and malinformation.
Information Literacy And Evidence-Based Practice in Clinical Decision-Making
Evidence-based practice (EBP) is the “process of collecting, processing, and implementing research findings to improve clinical practice, the work environment, or patient outcomes. It is a problem-solving approach to clinical practice that incorporates high-quality evidence from well-designed studies along with the patient’s values and desires, and the clinician’s knowledge and expertise to make decisions about a patient’s care” (Memorial Sloan Kettering Cancer Center Library, 2025).
EBP is also a component of the American Nurses Association (ANA) “Scholarly Inquiry” Standard of Professional Practice. The ANA defines EBP as “A lifelong problem-solving approach that integrates the best evidence from well-designed research studies and evidence-based theories; clinical expertise and evidence from assessment of the healthcare consumer’s history and condition, as well as health care resources; and client, family, group, community, and population preferences and values” (American Nurses Association, 2021).
Utilizing evidence-based practice means that nurses provide patient care based on research studies, data, and clinical expertise and do not just do something “because that’s the way it has always been done.” A simple example of nurses promoting evidence-based practice is the utilization of peppermint to relieve nausea. Throughout history, peppermint has been used for an upset stomach and to relieve the feeling of nausea. This idea was frequently rejected in the medical field because there was no scientific evidence to support it. However, in 2016, two critical care nurses, encouraged by scholarly evidence, developed a peppermint inhaler for clients to use when they were feeling nauseated and found it was 93% effective in relieving nausea (Briggs et al., 2016).
Abdekhoda & Khezri (2021) found that informatics competencies (computer skills, information literacy, and information management) had a direct and positive relationship with EBP. In other words, for patients to receive evidence-based care, nurses must be competent in informatics. One of the reasons behind this finding is that nurses must have a baseline knowledge of information literacy concepts so that data and information can be located, evaluated, and utilized for the improvement of patient care.
It is imperative, though, that when we are locating evidence-based solutions, we ensure that the information and sources are of high quality, because the decisions we make directly affect the patients we serve. Informatics has made finding information easier than ever; in fact, clinical practice guidelines, treatment protocols, and policies and procedures (P&P) are some of the most commonly used applications of clinical informatics used by nurses. Computers, handheld devices, and applications make finding guidelines, protocols, and P&P readily available (Carter-Templeton et al., 2025).
Resources for nursing practice that are often embedded in clinical informatics software, applications, and EHRs:
- Clinical Practice Guidelines: Recommendations made by the best available research and by those with clinical expertise in the specified area or condition. An example of clinical practice guidelines is Advanced Cardiac Life Support recommendations released at least every 5 years by the American Heart Association and the American Red Cross.
- Treatment Protocols: The course of action that healthcare providers should follow in certain situations or with certain diagnoses. These are typically set using an interdisciplinary approach and instituted by organizations based on current evidence or clinical practice guidelines. An example of a treatment protocol is the use of a standard insulin sliding scale or a protocol for patients with pneumonia or diagnosed with a stroke.
- Policy and Procedures (P&P): Organizational guidelines. Even though there are P&P for non-patient care tasks and activities, nurses should pay special attention to patient care protocols, which are typically based on current evidence or clinical practice guidelines and are regularly reviewed. Following P&P also ensures standardized practices, minimizes errors, ensures compliance with regulations, and protects nurses from liability. An example of a patient care P&P is guidelines on the care of a central line.
Other places that healthcare providers can turn to to find answers or data
- Scholarly literature: When searching for evidence, always ensure that your sources are peer-reviewed, which means that before the article was published, it was evaluated by other subject matter experts. Systematic reviews and meta-analyses are great ways to get an analysis of an overview of existing research on a subject, and randomized controlled trials are the “gold standard” in research, based on their ability to determine cause and effect and minimize bias.
- Internet sources: Most internet sources cannot be defined as only good or bad. Information falls on a spectrum, so it is our role as nurses to evaluate where the information falls on the spectrum and how to utilize the information we find. In addition, because of our connections to patients, we may find ourselves navigating information that patients find online. Educating patients on the problems with finding accurate health information on the internet is imperative in the management of chronic illness, compliance, and positive outcomes. We will explore the support of patients’ health literacy in Chapter 5.
Practical Strategies for Assessing Source Credibility
You likely know how to find some sources when you conduct research. And remember—we think and research all the time, not just in school or on the job. If you’re out with friends and someone asks where to find the best Italian food, someone will probably consult a phone app to present choices. This quick phone search may suffice to provide an address, hours, and possibly even menu choices, but you’ll have to dig more deeply if you want to evaluate the restaurant by finding reviews, negative press, or personal testimonies. According to the University of Southern California (2018), information literacy is a set of skills with lifetime benefits. “It helps people do well in school, work, and personal matters because they can recognize the difference between good information and bad information and evaluate situations from several perspectives.”

Why is it important to verify sources? The words we write (or speak) and the sources we use to back up our ideas need to be true and honest, or we would not have any basis for distinguishing facts from opinions that may be, at the least damaging level, only uninformed musings but, at the worst level, intentionally misleading and distorted versions of the truth. Maintaining a strict adherence to verifiable facts is a hallmark of a strong thinker and a patient safety advocate.
You probably see information presented as fact on social media daily, but as a critical thinker, you must practice validating facts, especially if something you see or read in a post conveniently fits your perception. You may be familiar with the Facebook and Instagram hoaxes requiring users to copy and paste a statement that they will not grant permission for these social media sites to make public the content from their private pages. Maybe you’ve seen any number of posts and memes that inaccurately associate famous people with memorable quotations. We may even allow ourselves to believe inaccurate claims as truth when we experience different emotions, including anger, fear, or loneliness; we want to believe a claim is true because it aligns with how we are feeling, regardless of any verifiable source. Be diligent in your critical thinking to avoid misinformation!
Domain names (Table 4.1) can help you determine the purpose of the site, but you shouldn’t rely solely on this website marker.
Table 4.1 – Domain name guidance
| Domain | User |
|---|---|
| .edu | Used by educational institutions (i.e., colleges, universities, school districts); usually reliable sources of information, but individual members of these institutions may be able to create web pages on the site under the official domain that do not reflect the values of the school |
| .com/.biz | Used by commercial or business groups; may be valid, but also may be used to sell products, services, or ideas |
| .gov | Used by government agencies; typically valid |
| .org | Used by organizations, such as nonprofit groups or religious entities, may present information slanted toward a specific denomination or cause. You’ll need to verify validity. |
| .net | Originally created for networks or groups of people working on the same problem, .net is still a viable option for noncommercial sites such as personal blogs or family websites. You’ll need to verify validity. |
Determining the validity of a source should include looking into the author’s credentials, experience, and status in the discipline; the actual content of the source material; any evidence the source presents as support; and whether any biases exist that may make the source questionable.
A simple acronym that can be used to guide the evaluation of websites is the CRAP evaluation method.
The CRAP method was developed by Molly Beestom, a librarian at Dominican University of California (Utah State University, n.d.).
- C is for Currency
- R for Reliability
- A is for Authority
- P is for Perspective
Knowing that not all information is equal, the CRAP method can help you know if the website information you find is current, accurate, unbiased, and from a trustworthy source. You will be using the CRAP method in Unit B to evaluate websites that you could potentially provide to the patients that you care for.
As an introduction to this method, review the information on this website.
Staying Current in a Rapidly Evolving Digital Environment
When you need to research a health-related topic, you probably start with a search engine. That can be helpful, but it may lead you down incorrect paths and waste time. Quality information directly affects the decisions we make as nurses, so focusing on sources that are scholarly will lead to better information and improved patient outcomes.
As a student, you have access to extensive stores of subscription-based scholarly and evidence-based content to start analyzing any topic. After you graduate, access to scholarly evidence can be limited. Nurses who work at large facilities or university-affiliated hospitals will usually continue to have access to databases and subscriptions. For nurses who work in smaller community hospitals, ambulatory care, long-term care, or independent practices, subscription access may be limited or unavailable; however, there are other options:
Free or Low-Cost Access to Scholarly Databases or Websites
- Bookshelf: Access to healthcare books and documents.
- Clinical Practice Guidelines (CPG): The National Guideline Clearinghouse, a former repository for clinical practice guidelines, is no longer available due to funding cuts. The following are excellent sites to search for CPG’s.
- American College of Physicians
- Agency for Healthcare Research and Quality
- Elsevier
- National Center for Complementary and Integrative Health
- National Institute for Health and Care Excellence
- National Institutes of Health 1) Select the Institute that pertains to your topic, 2) Use the institutes “search” feature to look for “clinical practice guidelines”, “practice guidelines”, or “guidelines”.
- Clinical Trials: Database of clinical studies being conducted around the world.
- Cochrane Databases: Access to systematic reviews, some systematic reviews have “free access” or “open access.”
- Daily Med: Database that provides the Food and Drug Administration labeling information for prescription and nonprescription drugs, devices, supplements, and medical foods.
- Directory of Open Access Journals: Access to scholarly articles that are free; users will need to ensure that articles are peer-reviewed.
- Google Scholar: Search engine for scholarly literature; users will need to ensure that articles are peer-reviewed.
- PubMed: 38 million citations for medical and nursing literature. Some citations may include links to full-text content. If full-text is not available, nurses can order the article from public libraries for a nominal fee using interlibrary loan services.
- TRIP Medical Database: Clinical search engine committed to helping users to quickly find and use high-quality research evidence so support practice and care. If you sign up for a free account, you can save your searches and get email alerts for new evidence of interest.
- University of York Centre for Reviews and Dissemination: Based in the UK, the center aims to disseminate high-quality evidence for use internationally.
Some general places to explore educational, inspirational, and thought-provoking material:
- Exploring the TED website is worth a few minutes of time. There you’ll find short videos (limited to 18 minutes) of speaking demonstrations by diverse experts in fields covering all disciplines. If you are in an exploratory phase of your thinking and researching, you can scan the TED Talk topics related to your interest area.
- Khan Academy, created in 2008 by Salman Khan, is an online learning resource for students and teachers containing tutorials, videos, and practice sets in a variety of subjects from science and mathematics to grammar lessons.
Information Management
The third and final informatics competency (in addition to computer science and information literacy) that all nurses must develop in order to provide safe, quality, and competent care is information management. “Information management is a process consisting of 1) collecting data, 2) processing the data, and 3) presenting and communicating the processed data as information or knowledge (The Technology Informatics Guiding Education Reform (TIGER) Initiative, 2011).
Working with and in interprofessional teams, entering accurate data, communicating with digital information, and retrieving data require skill sets in health informatics. In healthcare, nurses, providers, and the entire interprofessional team use data to make critical clinical decisions. If there are gaps in information in the EHR, decisions based on missing or incomplete information could lead to poor outcomes. “Missing medical information can be a detriment to care in many settings, but perhaps more so in areas of high acuity, where healthcare providers may be forced to make rapid decisions that are challenging to patient safety” (Carter-Templeton et al., 2025). Understanding how data is collected, entered, stored, and retrieved requires hands-on experience, recognizing what it is communicating, and how to apply the results of what is retrieved.
Billions of bits of data are collected every second in healthcare organizations (Waxman & Knighten, 2023). Data analytics is the analysis of real or projected data so that it can be used in decision-making (Alexander et al., 2019). Entering, retrieving, analyzing, and visualizing data to make decisions is using informatics and technology skills to guide actions in large disease outbreaks, identifying patient care issues within a hospital or unit, and delivering care to the patients we serve. Using “data” just like using scholarly sources would be considered EBP, because healthcare providers and organizations use the evidence (the data) to ensure best practice.
Data analytics has the potential to impact patient care by helping healthcare professionals gather, interpret, and apply data, specifically from databases or from the EHR. Historical data can provide insights into past events to determine patterns and trends. An example of this would be tracking infection rates in different units. In addition, data can also give insight into “why” something happened, which can help healthcare providers to find underlying causes and potentially mitigate those causes (Park University, 2024).
As mentioned in Chapter 3, data from the EHR can also forecast potential outcomes and suggest the best course of treatment with the assistance of machine learning, statistical algorithms, and AI. Ultimately, the amount of healthcare data that is generated is significant, but data analysis requires intentional efforts to ensure that quality data exists, that the data extracted is customized to the needed elements, and that the results of the analysis are used in a positive and meaningful way (Carter-Templeton et al., 2025).
Tables, Graphs, and Charts
Tables are commonly used to organize data in a concise yet usable format that allows maximum viewing of all of the data (Waxman & Knighten, 2023). Table 4.2 is an example of a simple table that has specific actionable information.
Table 4.2 – Example of a Simple Table
| Patient | Systolic | Diastolic | 02 Vent Input by RT | # of Meds | MD orders | RN intervention | CNA interventions |
|---|---|---|---|---|---|---|---|
| 1 | 130 | 90 | 50 | 15 | 10 | 30 | 15 |
| 2 | 190 | 100 | 90 | 20 | 20 | 50 | 16 |
| 3 | 110 | 50 | 20 | 5 | 4 | 15 | 5 |
| 4 | 120 | 86 | 40 | 10 | 4 | 10 | 4 |
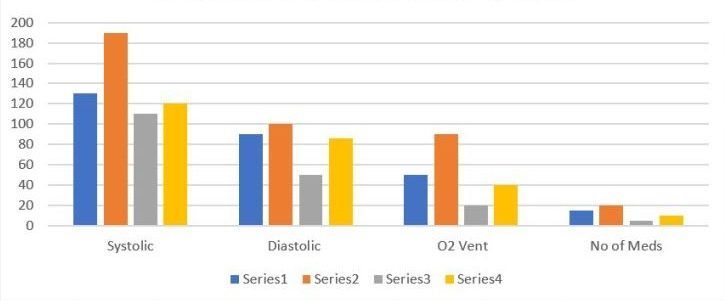
When presenting data, it is best to present it in a visual format that tells a story (Waxman & Knighten, 2023). Graphs/charts are used to give a visual representation of data (See Graph 4.1). Graphs/charts condense large amounts of information into easy-to-understand formats that can clearly and effectively communicate important points. A word of caution, some visual representations of data lose the precision and details from the data in table form (Waxman & Knighten, 2023). For example, the difference between Table 4.2 and Graph 4.1 is the exactness of the numbers.
Graph 4.1 – Example of Some Data from Table 4.2 Presented Visually
Activity: Reading Table, Graphs, and Charts
Being able to “read” tables, graphs, and charts means that we can look at the data numerically and/or visually and understand what the data or graph/chart is trying to say. It involves picking out data points of interest and gives a quick synopsis of what the table, graph, or chart is about. Since data and data analysis are often used in healthcare, it is important that nurses are able to participate in information management because of the positive impact data can have on patient care. Some examples of data use that can positively improve patient care include:
-
- Data from the EHR, visually represented in a graph, can be useful in trending patient vital signs. Some EHRs make this possible with just a few clicks of the mouse.
- Government or non-profit databases can provide mortality rates and comorbidities in tables and charts or allow you to compare rates of chronic disease based on variables (sex, gender, age). This can be used to educate patients or identify risk factors for populations that you serve.
- Quality improvement: Data can be accessed and analyzed to determine patient trends, and knowledge from the data can be utilized to create plans for change. Below is a case study example of the use of data to improve the quality of patient care. Answer the questions, and then check your answers.
Activity 1: The Use of Data, Patient Falls
As a nurse, you notice that the unit you are working in is having an increase in patient falls. This is concerning to you, and you wonder why this increase is occurring. You approach your manager, and working together, you extract data from the EHR comparing your unit to some other units in the hospital.
| Patient Falls |
|||
|---|---|---|---|
| Fall Type | Medical: Unit 1 | Your Unit: Unit 2 | Surgical: Unit 3 |
| OOB | 4 | 3 | 2 |
| Slipped | 5 | 6 | 2 |
| Confused | 10 | 15 | 13 |
| Meds | 6 | 20 | 4 |
| Lighting | 3 | 4 | 6 |
| Wet | 2 | 3 | 5 |
| TOTAL FALLS | 30 | 51 | 32 |
Interpretation activity:
- Which unit overall of the three has the most falls?
- What is the most common cause of falls for all units?
- What is the most common cause of falls in your unit?
- How can you use this data in a “positive and meaningful way?”
- What type of graph/chart would be an effective way of presenting this data?
Reading and Interpreting Bar Graphs and Line Graphs
How do you determine the best way to present data and information to stakeholders? Bar graphs and line graphs are common ways that data can be presented graphically, which can influence others to make quality improvement changes in patient care. Bar graphs are best utilized when comparing data that has multiple categories. Line graphs are best utilized when the data is quantitative and you want to show how the data changes over time.
In your assignment this week, you will be reviewing datasets and reading and interpreting tables and graphs. The following two activities will help you prepare to read and interpret tables, bar graphs, and line graphs.
Activity 2 – Reading and interpreting a bar graph (comparing categorical data)
The horizontal bar graph shows the percentage of people aged 65 or older in each Local Health District of Utah (Utah Department of Health & Human Services, 2020).
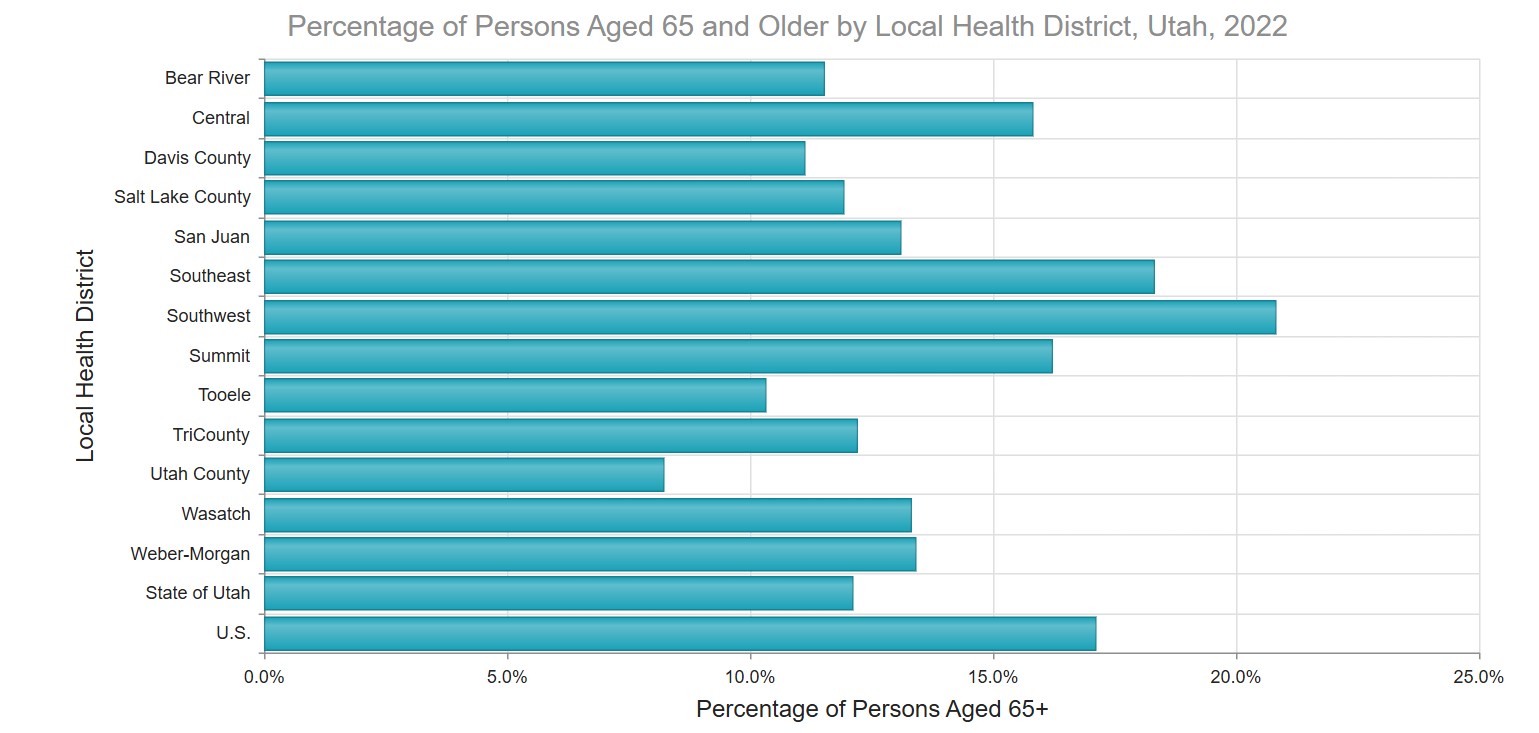
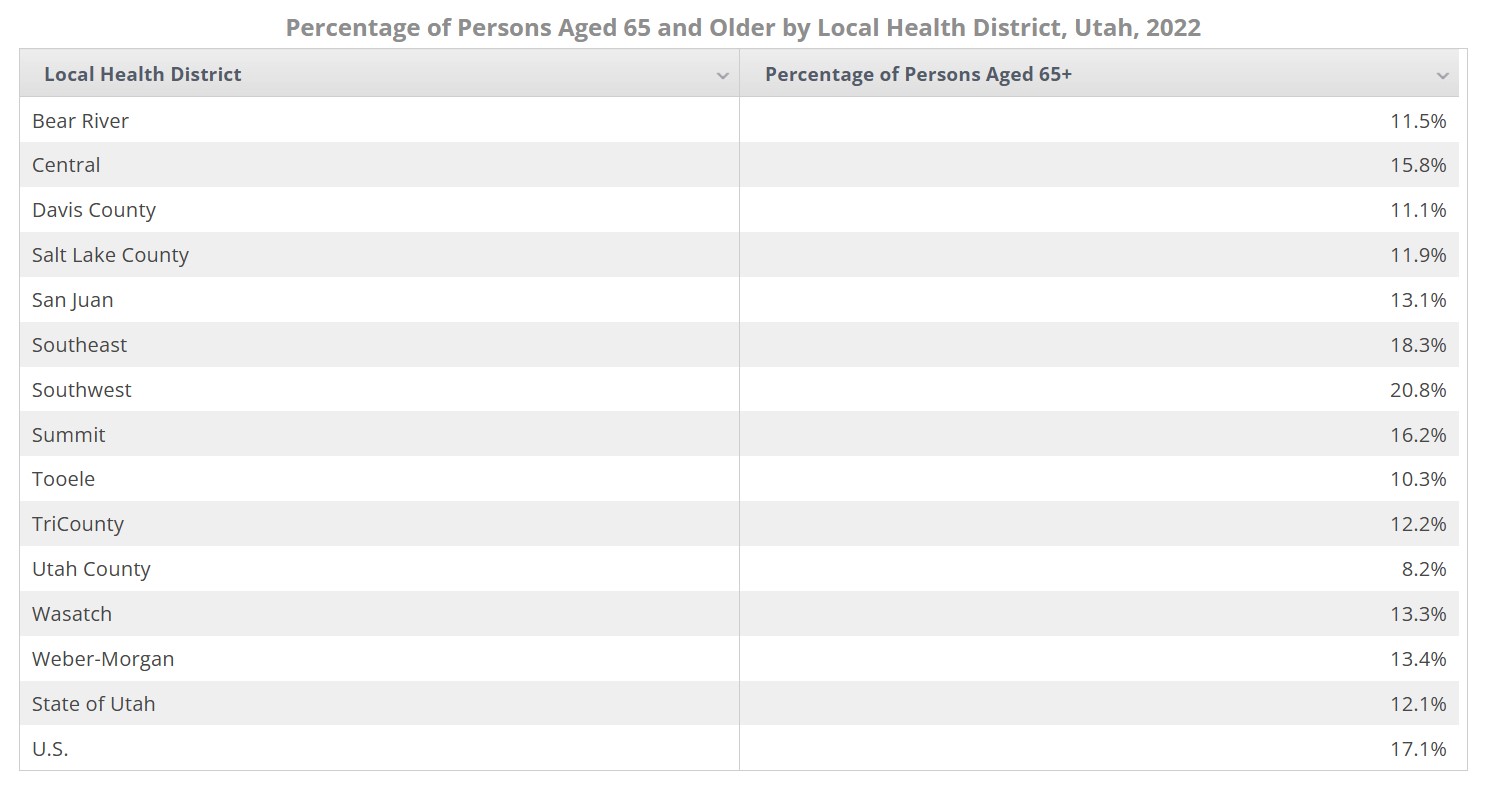
Interpretation activity:
- Estimate the percentage of people who are 65 years old or older in the United States.
- Which areas have a higher percentage of people who are 65 years old or older than the percentage in the United States?
- Which area has the lowest percentage of people who are 65 years old or older?
- What is the difference (in percentage) between the health districts that have the highest and lowest population over 65?
- Why is this information important?
Activity 3: Reading and Interpreting a line graph (used for quantitative data and trending over time)
The table and line graph show a percentage comparison from 2019 to 2021 of women with postpartum depression symptoms based on race and ethnicity (Centers for Disease Control and Prevention, 2021).
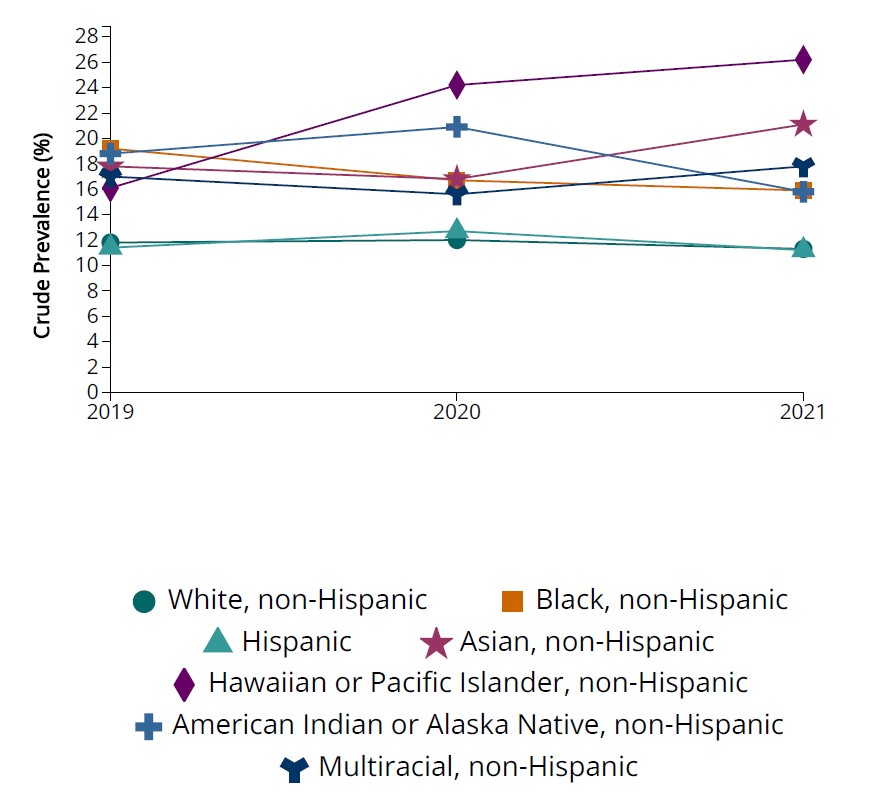
| Year | White | Black | Hispanic | Asian | Hawaiian or Pacific Islander | American Indian or Alaska Native | Multiracial |
|---|---|---|---|---|---|---|---|
| 2019 | 11.8 % | 19.2 % | 11.4 % | 17.8 % | 16.1 % | 18.8 % | 17.0 % |
| 2020 | 12.0 % | 16.7 % | 12.7 % | 16.8 % | 24.2 % | 20.9 % | 15.6 % |
| 2021 | 11.3 % | 15.9 % | 11.2 % | 21.1 % | 26.2 % | 15.8 % | 17.8 % |
Interpretation activity:
- On the graph, describe the pink/purple star line.
- On the graph, describe the trend of the purple diamond line.
- On the graph, describe the trend of the orange, square line.
- What race/ethnicity had the highest percentage of postpartum depression symptoms in 2019? How much did it change from 2019 to 2021?
- What race/ethnicity had the highest percentage of postpartum depression symptoms in 2021? How much did it change from 2019 to 2021?
- What other significant changes in other races/ethnicities can you see from the data?
- Speculate why the biggest change may have occurred, why this data is important, and how you could use it in the care of patients.
Conclusion
In today’s healthcare landscape, nurses must be equipped with informatics competencies: computer literacy, information literacy, and information management to provide safe, high-quality, and evidence-based patient care. As this chapter highlighted, information literacy enables nurses to find, evaluate, and apply reliable sources of health information, not only for clinical decision-making but also to support and educate patients. Information management skills empower nurses to collect, interpret, and communicate data in meaningful ways. By understanding how to use data to identify trends, improve outcomes, and guide practice, nurses contribute to informed decision-making and continuous quality improvement at both the individual and organizational levels. Together, these competencies form a foundation for lifelong learning, professional growth, and patient advocacy. As future chapters will explore, nurses who are confident in informatics are better prepared to lead, innovate, and collaborate across interprofessional teams, ultimately enhancing healthcare delivery and shaping the future of nursing practice.
References:
- Abdekhoda, M. & Khezri, H. (2021). Investigating the impact of health informatics literacy on the evidence-based practice of nursing. Online Journal of Nursing Informatics (OJNI), 25(2). https://www.himss.org/resources/online-journal-nursing-informatics
- Alexander, S. Frith, K. H., Hoy, H. (2019). Applied clinical informatics for nurses. Jones & Bartlett Learning.
- American Library Association (n.d.) Information literacy. Accessed February 1, 2020. https://literacy.ala.org/information-literacy/
- American Medical Informatics Association. (2023). Informatics: Research and practice. https://amia.org/about-amia/why-informatics/informatics-research-and-practice
- American Nurses Association. (2021). Nursing: Scope and standards of practice (4th ed.). American Nurses Association. https://www.ncbi.nlm.nih.gov/books/NBK591808/
- Briggs, P., Hawrylack, H., & Mooney, R. (2016). Inhaled peppermint oil for postop nausea in patients undergoing cardiac surgery. Nursing 46(7), 61-67. https://doi.org/10.1097/01.NURSE.0000482882.38607.5c
- Carter-Templeton, H., Alexander, S., & Frith, K. (2025). Applied clinical informatics for nurses (3rd ed.). Jones & Bartlett Learning.
- Centers for Disease Control and Prevention. (2021). Chronic disease indicators: Postpartum depression symptoms in women with a recent live birth based on race and ethnicity 2019-2021. Chronic Disease Indicators – https://www.cdc.gov/cdi/. Retrieved July 27, 2025 from: https://cdi.cdc.gov/?location=US&category=MAT&indicators=MEN03
- Cho, H., Han, K., & Park, B. K. (2018). Associations of eHealth literacy with health-promoting behaviours among hospital nurses: A descriptive cross-sectional study. Journal of Advanced Nursing, 74(7):1618–27. https://pubmed.ncbi.nlm.nih.gov/29575085/
- Malik, R. M., Naveed, M. A., & Rafique, G. M. (2025). Effect of information literacy skills on clinical decision-making among nurses effect of information literacy skills on clinical decision-making among nurses. Journal of Information Management and Practices, 5(1), 29-47. https://doaj.org/article/0cb79638b4214a87bf63b9401d4d5b7b
- Park University. (2024, October 16). Data analytics: Transforming patient care delivery. https://www.park.edu/blog/data-analytics-in-healthcare-transforming-patient-care-delivery/
- Rafi, M., JianMing, Z., & Ahmad, K. (2019). Technology integration for students’ information and digital literacy education in academic libraries. Information Discovery and Delivery, 47(4), 203–217. https://doi.org/10.1108/IDD-07-2019-0049
- Technology Informatics Guiding Education Reform (TIGER) Initiative. (2011). Informatics competencies for every practicing nurse: Recommendations from the TIGER collaborative. https://www.tigersummit.com/uploads/3.Tiger.Report_Competencies_final.pdf
- University of Southern California (2018, November 8). The value of information literacy. Online Learning: USC Library Science Degree Online. https://librarysciencedegree.usc.edu/blog/what-exactly-is-information-literacy-and-what-role-does-it-play-in-education/
- Utah Department of Health and Human Services. (2022). Health indicator report of Utah population characteristics: Age distribution of the population. Public Health Indicator-Based Information System (IBIS). Utah.gov. https://ibis.utah.gov/ibisph-view/indicator/view/AgeDistPop.65LHD.html
- Waxman, K. T., & Knighten, M. L. (2023). Financial and business management for the Doctor of Nursing Practice (3rd ed.). Springer Publishing.
Media Attributions:
- Analyzing Big Data created by VectorPortal.com is licensed under a CC BY 4.0 International license
- Shout Out UK. (2020, May 26). How to understand mis-information, dis-information, and mal-information [Video]. YouTube. https://www.youtube.com/watch?v=HD5MmuLDeFE&t=172s
OER Resources Utilized in this Section:
- Baldwin, A. (2020, March 27). College success section 7.7: Information literacy. https://openstax.org/books/college-success/pages/1-introduction Licensed using a Creative Commons Attribution 4.0 License.
- Clark, K. (2023). The health informatics guide: A beginner’s guide to systems. Universities at Shady Grove Pressbooks. https://shadygrove.pressbooks.pub/informatics/ Licensed under a Creative Commons Attribution-NonCommercial 4.0 International License
- Cortez, M. A. T. (2020). Let’s get literate: All about information literacy. Wix. https://mtcortez1.wixsite.com/informationliteracy Licensed with an Attribution-Non-Commercial-Share-Alike 4.0 international (CC BY-NC-SA 4.0).
- Ernstmeyer, K., & Christman, E. (Eds.). (2024). Nursing fundamentals 2E (2nd ed.). Open RN | WisTech Open. https://wtcs.pressbooks.pub/nursingfundamentals/ Licensed under a Creative Commons Attribution 4.0 International (CC-BY) license
- McKenna, H. J., Chang, L., & Brinkerhoff, M. R. (2023). Numeracy. A quantitative reasoning approach. https://uen.pressbooks.pub/uvumqr/ Licensed under a Creative Commons Attribution-NonCommercial-ShareAlike 4.0 International License.
Activity Answers:
A set of skills that allow you to “recognize when information is needed and have the ability to locate, evaluate, and use effectively the needed information"
Process of collecting, processing, and implementing research findings to improve clinical practice, the work environment, or patient outcomes.
A .process consisting of collecting data, processing the data, and presenting and communicating the processed data as information or knowledge
